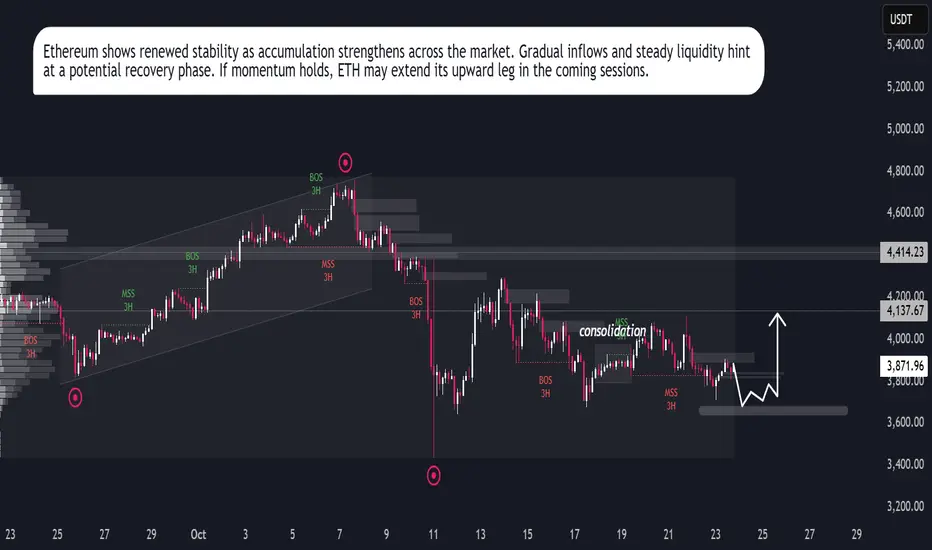
ETH Eyes Upside RunEthereum shows signs of regaining strength after a prolonged corrective phase. The asset is currently stabilizing, supported by gradual inflows from institutional participants and renewed investor accumulation. Market behavior indicates controlled volatility, suggesting a preparation phase before a potential expansion.
Network data reflects consistent transaction activity, while liquidity concentration hints at sustained participation from long-term holders. The recent stabilization in funding rates and improved open interest add weight to the recovery outlook.
If momentum continues to build under these conditions, Ethereum could enter a structured growth cycle in the coming sessions.
Ethupdate
Ethereum Accumulation Before BreakoutEthereum has regained bullish momentum after a recent correction phase, supported by improving sentiment in the broader crypto market. The asset is displaying early signs of stabilization as traders begin accumulating around value zones, indicating renewed confidence among market participants.
From a macro perspective, Ethereum continues to benefit from increasing network activity, particularly within the DeFi and Layer-2 ecosystems. The sustained growth in on-chain transactions and staking participation reflects long-term investor interest, adding strength to the current recovery phase.
Market data also shows that institutional inflows into major crypto assets are on the rise, with Ethereum standing out due to its strong fundamentals and ecosystem resilience. This inflow supports the likelihood of a continued price rebound, as liquidity and trading volume remain consistent.
Overall, ETHUSDT is showing a constructive recovery setup. The combination of improving sentiment, strong fundamentals, and gradual accumulation suggests a potential medium-term bullish continuation, provided global market conditions remain favorable.

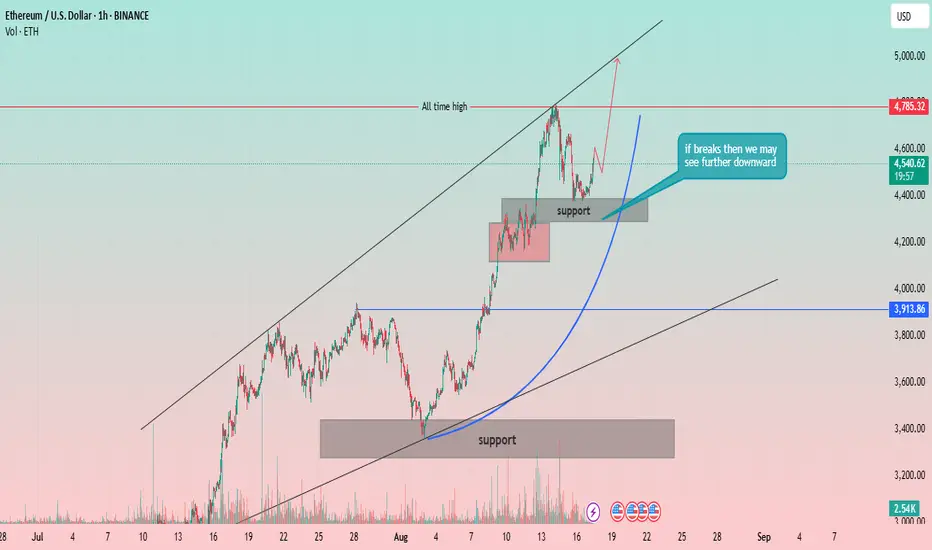
Ethereum (ETH) 1H Chart: Re-testing the All-Time High?Strong Uptrend Channel: The price of Ethereum has been moving within a well-defined ascending channel, indicated by two parallel black trendlines. This strong channel suggests a sustained bullish momentum.
All-Time High: A significant resistance level is marked as the "all-time high" at approximately 4,785.32 USD. The price has recently tested this level.
Support Levels:
Major Support Zone: A broad support zone is identified between approximately 3,300 USD and 3,450 USD. This zone has previously acted as a strong base for a price rally.
Recent Support Zone: A smaller, more recent support zone is marked around 4,200 USD. The price has consolidated within this area after its recent push towards the all-time high.
Price Action and Projections:
The price recently reached a peak near the all-time high and has since pulled back, consolidating within the recent support zone.
A key annotation states, "if breaks then we may see further downward." This highlights the importance of the 4,200 USD support zone. A break below this level could indicate a potential deeper retracement, possibly towards the lower trendline of the channel or the major support zone.
A parabolic arc is drawn (blue line), suggesting a potential trajectory for the price to continue its move higher from the current level, with a goal of re-testing or breaking the all-time high.
Volume: The chart includes a volume indicator, showing significant volume spikes during the major rallies and drops, confirming strong market interest and participation.