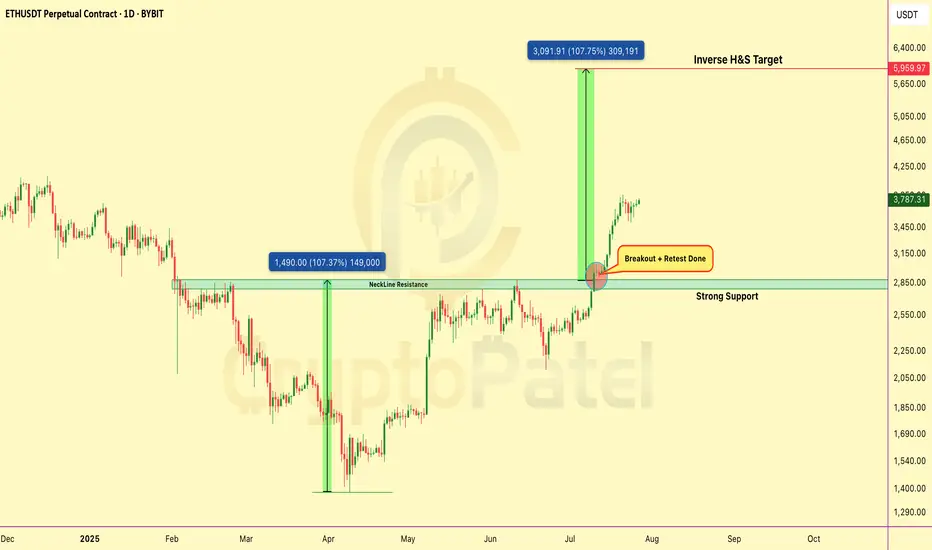
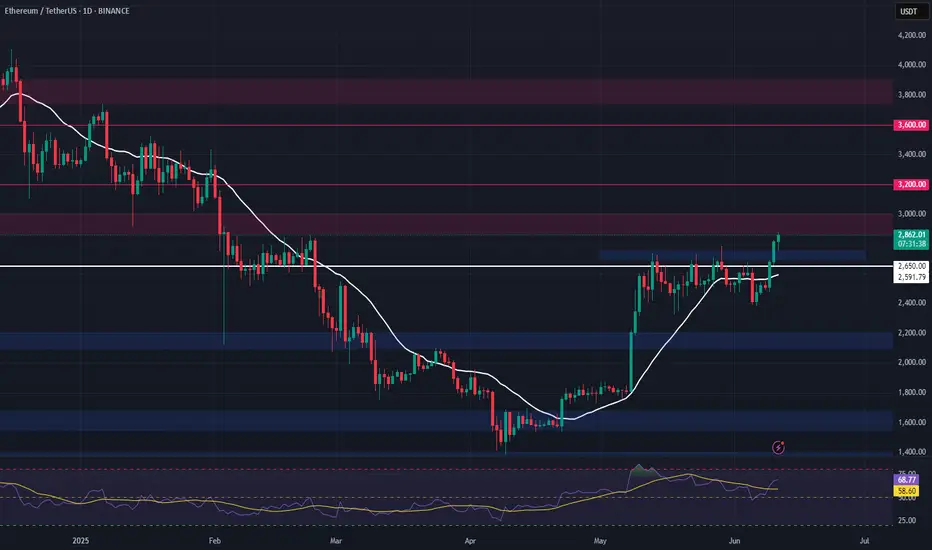
Ethereum Breakout Confirmed – Retest CompletedCRYPTOCAP:ETH has broken out Inverse Head & Shoulders on daily chart.
✅ Neckline breakout above $2,850
✅ Retest successful – strong support confirmed
✅ Targeting full move toward $6,000
Structure is bullish, momentum building. As long as #Ethereum holds above the neckline, continuation is likely.
Note: NFA & DYOR
ETHUSDT
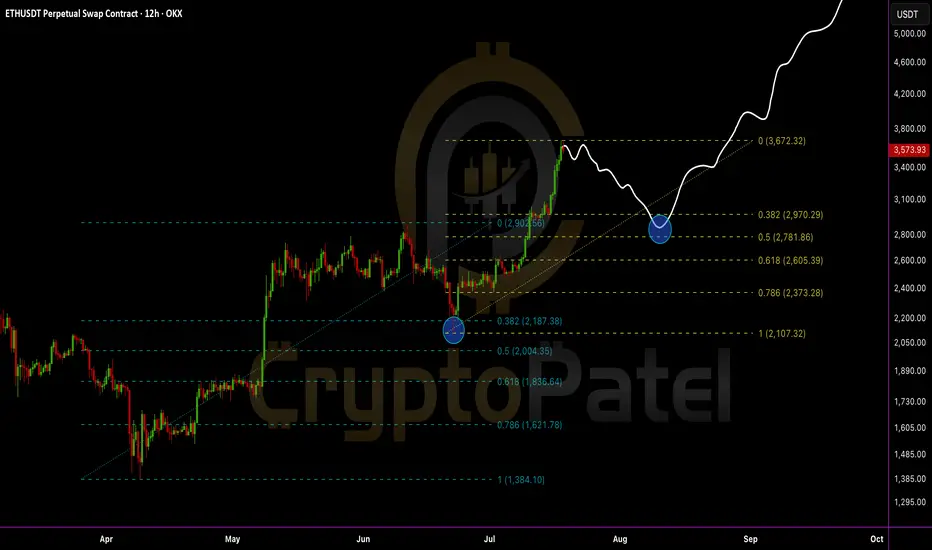
Everyone’s bullish now… but smart traders are waiting for this EEthereum just tapped a key resistance near $3,672 and is starting to show signs of cooling off.
A healthy retracement could bring ETH back to:
0.382 Fib – $2,970
0.5 Fib – $2,781
0.618 Fib – $2,605 (Strong demand zone)
IMO, we can expect ETH to revisit the $2,700–$3,000 zone before the next leg up.
This area will be the golden re-entry for long-term targets of $6,000–$8,000.
Stop-loss: Recent high and candle close above $3,675
Structure remains bullish:
✅ Previous dips into Fibs triggered strong buybacks
✅ Clean higher highs and higher lows
✅ Demand zone + retracement = opportunity
My View: Let price pull back. Then load up again. Bigger wave incoming.
DYOR | NFA
is Ethereum ready to $10,000Ethereum just broke out of a massive inverse head & shoulders and it’s flying past $3,400 again after 5 months. 🚀
Chart looks Bullish for a run toward $6K… but don’t be surprised by a dip to ~$2,800 first.
ETH is super bullish.
Next stops: $6K → $8K → $10K.
NFA & DYOR

$ETH IS FLIRTING WITH A MASSIVE BREAKOUTCRYPTOCAP:ETH IS FLIRTING WITH A MASSIVE BREAKOUT
Price is hovering just below the HIGH LIQUIDITY ZONE at $2,867 — a major inflection point!
✅ Break above… We could see a parabolic push toward ATHs.
❌ Rejection = A sharp correction might hit hard.
It’s make or break time for Ethereum.
What’s your plan if this breaks?
NFA & DYOR

ETH Long Setup: Key Support Zone at $2,453.72The $2,453.72 zone on CRYPTOCAP:ETH looks promising for our next potential long setup.
It’s a key support level and holds significant liquidity—definitely a zone worth watching.
This is not financial advice. Always trade at your own risk.

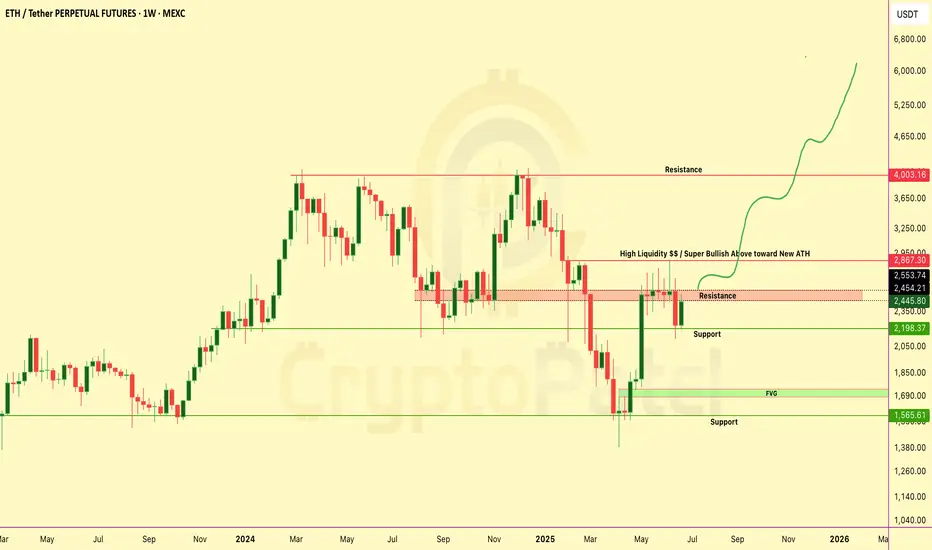
ETHEREUM Weekly Chart Breakdown – Massive Move Loading?ETHEREUM Weekly Chart Breakdown – Massive Move Loading?
ETH just pumped +9.9% this week... but it’s what comes next that really matters 👇
Key Resistance Wall → $2,867
🔹 This zone is packed with liquidity traps and past rejections.
🔹 Break this level = Unlocks ATH push toward $4K–$6K-$10k
Why This Chart Matters:
✅ Bullish structure reclaim
✅ Targeting “High Liquidity” zone above
✅ Possible parabolic rally if breakout confirms
Dips = Opportunities
If ETH dips from here... don’t panic.
→ Every dip = fresh accumulation zone
→ Below $2,000 = golden buy zone for long-term bulls
Liquidity Zone Break it = ATH rally incoming
Reject it = Buy the dip and ride the next wave
Comment & tag a friend who needs this alpha!
NFA & Dyor
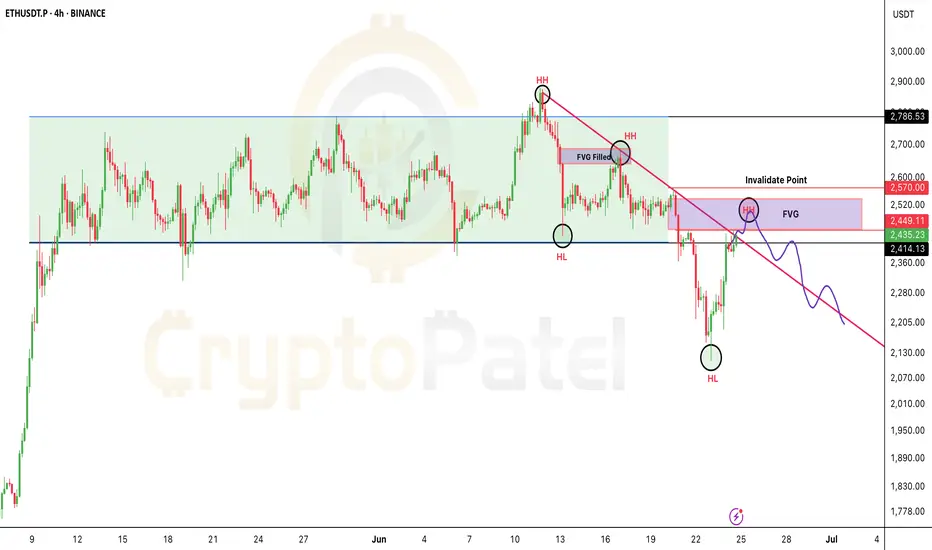
If you're shorting Ethereum, watch $2570 closely.If you're shorting Ethereum, watch $2570 closely.
If a candle closes above $2570, that invalidates the short — time to exit.
Why?
Because above this level, the risk/reward flips against you.
Better to wait for a cleaner entry with less risk, more reward.
Target: $2000
Retweet if this helps your trade plan.
NFA & DYOR
ETH/USDT Dumped hard as I predicted and next Target?ETH SHORT HIT — As Predicted!
Hey fam
Hope you enjoyed the ETH short setup I shared earlier when price was around $2700–$2800
ETH is now down 22% from that level.
Broke support just like we discussed…
And remember I said — if $2500 breaks, we could see $2200.
Well… we’re already there now ✅
What Now?
This is where we start accumulating on spot.
Why?
Because ETH is currently at the 0.5 Fib level — could hold.
If not, we target 0.618 Fib for next entry.
Best Accumulation Zone: $2200–$1800
Strong bullish OB around $1782–$1840
If price drops there, expect a solid bounce!
I’m personally watching this zone for spot entries targeting $8000–$10,000 next run 🚀
Let me know below if you're buying this dip!
And as always… stay tuned for the next sniper setup.
NFA & DYOR
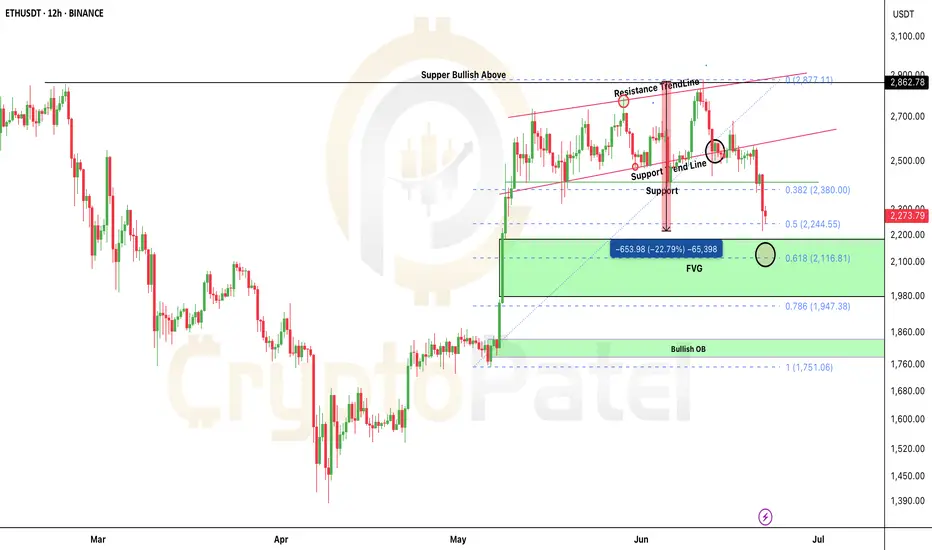
$ETH BLOODBATH: -15% Dump! Next Stop $2100? CRYPTOCAP:ETH BLOODBATH: -15% Dump! Next Stop $2100?
I shorted right from $2862 — nailed the move.
Now trading below critical $2550 support.
👉 Hold $2550? Reversal towards $3000-$4000 possible.
👉 Lose it? We likely fill $2100-$2200 FVG — 0.618 fib at $2116.
$2860 remains THE level to watch for a New ATH.
💬 Comment your ETH target!
🔁 Retweet if this helps your gameplan.

ETH Long Swing Setup – Breakout Retest of Key ResistanceETH has broken above the critical $2,750 resistance, signaling bullish momentum. We’re now watching for a retrace into the $2,700–$2,750 zone, which is expected to act as support for a continuation higher.
📌 Trade Setup:
• Entry Zone: $2,700 – $2,750
• Take Profit Targets:
o 🥇 $3,000
o 🥈 $3,200
o 🥉 $3,700
• Stop Loss: Daily close below $2,650
#Ethereum Breakout Attempt #Ethereum Breakout Attempt 📢
After weeks of consolidation inside this range → CRYPTOCAP:ETH is now testing a breakout above major resistance $2750
👉 If this breakout holds → we could see a BIG upward rally toward $3500–$4000 in the coming weeks. 🚀
Keep an eye on this level — the next move could be massive.

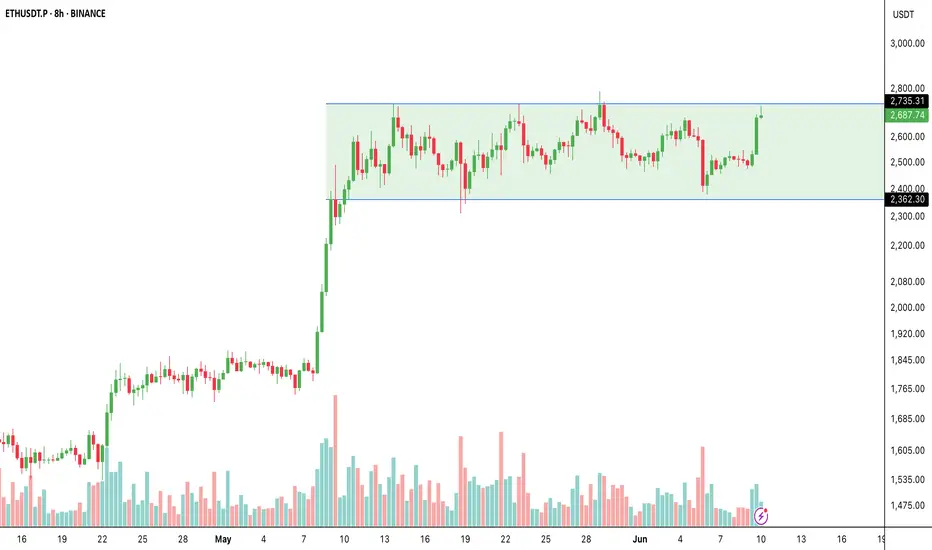
Ethereum Breakout Imminent?🚨 Ethereum Breakout Imminent?
CRYPTOCAP:ETH has been trading in a wide range:
👉 Support: ~$2,362
👉 Resistance: ~$2,735
Now ETH is once again testing this critical resistance zone with higher lows and rising volume — a classic breakout setup in play.
What to watch:
✅ Break & close above $2,735 → $2,800 → $2,900 → $3K
❌ Rejection → back to $2,400–$2,500 range.
Summary:
Ethereum is building momentum → next move could be explosive.
Will it break out or rotate? Stay sharp!
NFA & DYOR
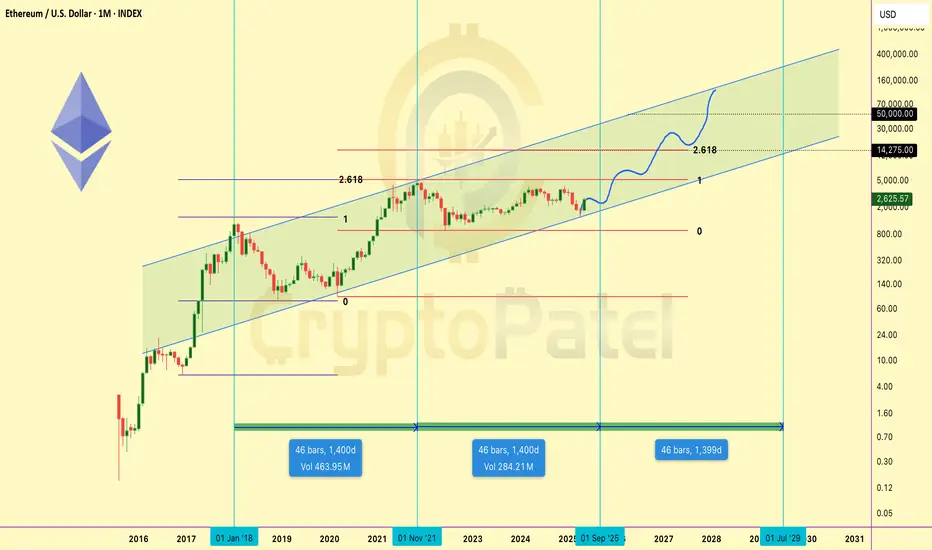
Ethereum Macro Chart Breakdown – Eyeing $10K+ Targets! Ethereum Macro Chart Breakdown – Eyeing $10K+ Targets!
Let’s zoom out and look at the bigger picture for CRYPTOCAP:ETH – this isn't just a pump; it’s a potential parabolic supercycle forming.
Technical Outlook:
Fractal Pattern Analysis
Ethereum is following a similar macro-structure to its 2017–2021 cycle, where after a long consolidation and accumulation phase, it exploded nearly 30x from bottom to top.
Current price action mirrors the post-2019 structure, and we’re at the same breakout stage right now.
Fibonacci Projections
Using the Fibonacci extension from the previous bear market low to the bull market top, and applying the same ratio from the 2022 bottom:
🔹 1.618 Fib = ~$10,000
🔹 2.618 Fib = ~$14,000
These targets align with Q4 2025–Q1 2026, based on previous cycle timings.
Structural Support
ETH is now trading above its 100-week EMA and holding bullish structure on higher timeframes. Previous resistance at $2,500 has flipped into strong support.
Momentum & Fundamentals
🔹 Layer 2 scaling is booming (Arbitrum, Base, zkSync)
🔹 Institutional ETH ETFs are launching
🔹 ETH powers Web3, DeFi, AI infra, RWAs, and more
🔹 Ultra-sound money supply dynamics + staking yield
🔹 Ecosystem growth is organic and robust
Projected Targets:
🎯 Short/Mid-Term (Q4 2025): $10,000 – $14,000
🚀 Ultra Long-Term (2029–2030): $40,000 – $50,000
If you still believe ETH is “just another altcoin,” you’re missing the bigger picture. Ethereum isn’t a meme — it’s the backbone of digital value, smart contracts, and future finance.
I’m long and accumulating ETH on dips. This isn’t just a trade — it’s a conviction play.
🗨️ Drop your ETH target in the comments 👇
🔁 Share this with someone sleeping on ETH!
Note: This is NFA So DYOR
Eth - Consolidation Eth in a massive consolidation zone rigjt now.
We never broke wick high we got close and rejected. If btc pushes past ath and eth moves again this would be the third test and a massive squeeze.
Not trading this range right now until confirmations but keep an eye on that wick for now

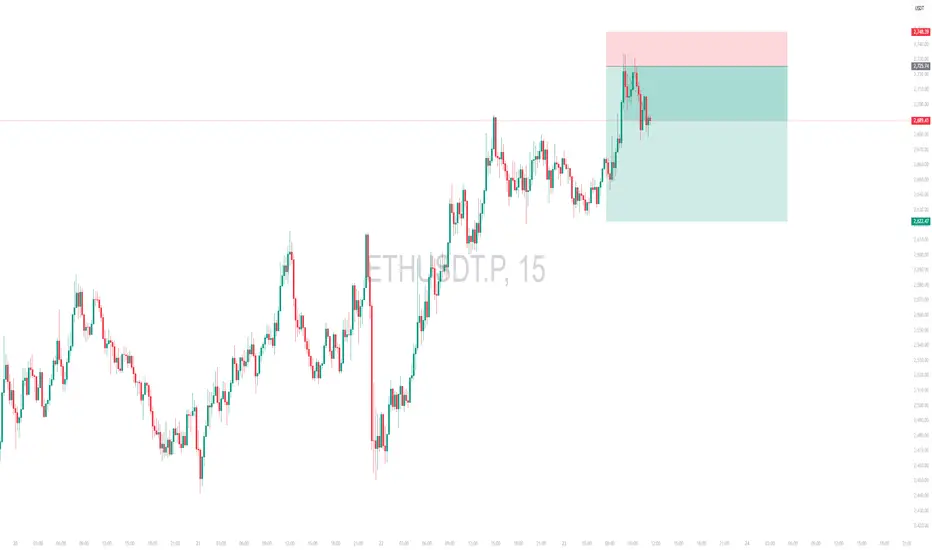
Intraday Short Setup | May 23rd 25 | Valid Until Daily CloseThis is the trade I was looking for but was too early for my day!
Price has pushed into a potential intraday Pivot supply zone (red box) where sellers may step in. This trade is based on the expectation of a rejection from this area.
Entry: Red box — a short entry zone aligned with overhead supply
Stop Loss: Above the red zone (invalidates the setup)
Target: Green box — area to consider partial/full exit based on momentum
ETHUSDT has shown a strong bounce but is now approaching a key pivotal resistance zone
Risk-reward is favorable with a tight invalidation and clean downside target
Price may stall or reverse near the red box, creating short opportunity
Note:
This is an intraday trade idea that expires at 00:00 UTC (Daily Candle Close). Re-evaluate the setup if price remains indecisive near the entry zone close to that time.
ETHEREUM MEGA CYCLE ALERT🚨 ETHEREUM MEGA CYCLE ALERT 🚨
CRYPTOCAP:ETH just bounced from the same support zone that sparked its last bull run 🔥
This could be the start of Wave 5 — and if history repeats…
🎯 Target: $10,000 ETH
Last time this pattern showed up? ETH went 10x.
Don’t fade the chart.
👉 Like & Retweet if you’re riding this wave
👇 Tag a friend who’s still sleeping on ETH!

ETH Technicals Hint at Breakout — All Eyes on the 2588 Level📊 Cycle Structure:
HWC (Higher Wave Cycle): Bullish 🔼
MWC (Middle Wave Cycle): Ranging 🔁
LWC (Lower Wave Cycle): Bullish 🔼
The overall market structure leans bullish. With both HWC and LWC pointing upward, the directional pressure favors long setups.
❗️If you're looking for a short position, this analysis isn't for you.
🔍 Price Action Structure & Entry Scenario:
A strong resistance zone at 2588 has already been tested four times.
A fifth touch often increases the probability of a breakout — especially in a bullish-biased environment.
A 1H ascending trendline sits right below the resistance, acting as dynamic support.
📌 My Strategy: Pre-Breakout Entry
My approach focuses on entering before a confirmed breakout — riding the early wave toward resistance.
This includes watching for compression, weak selling volume, and bullish candlestick structures.
⚠️ This method is inherently riskier, and the chance of getting stopped out is higher, so solid risk management is essential.
👥 Based on trading style, here’s how different traders might approach this:
🔁 Reactive traders can wait to see how price reacts at the trendline.
🔓 Breakout traders should wait for a confirmed 15min or 1H close above 2588.
🐳 Those expecting a sharp whale-driven move may consider placing a Buy Stop Order above resistance.
🎯 Entry Levels & Risk Management:
Aggressive Entry: Pre-breakout trigger near 2588 (riskier).
Conservative Entry: Wait for a confirmed breakout candle above 2588.
Stop-loss idea: Below the 1H trendline, acting as a dynamic support.
📉 Invalidation Level:
My bullish outlook holds as long as we’re above 2387.
If price closes below that, I’ll re-evaluate for a possible short — but until then, the focus remains on the long side.
💬 Want me to analyze a specific coin?
Drop it in the comments — I’ll review and pick one for the next post.
⚠️ Without proper risk management, you're just a ticking time bomb.
— PXA 📊

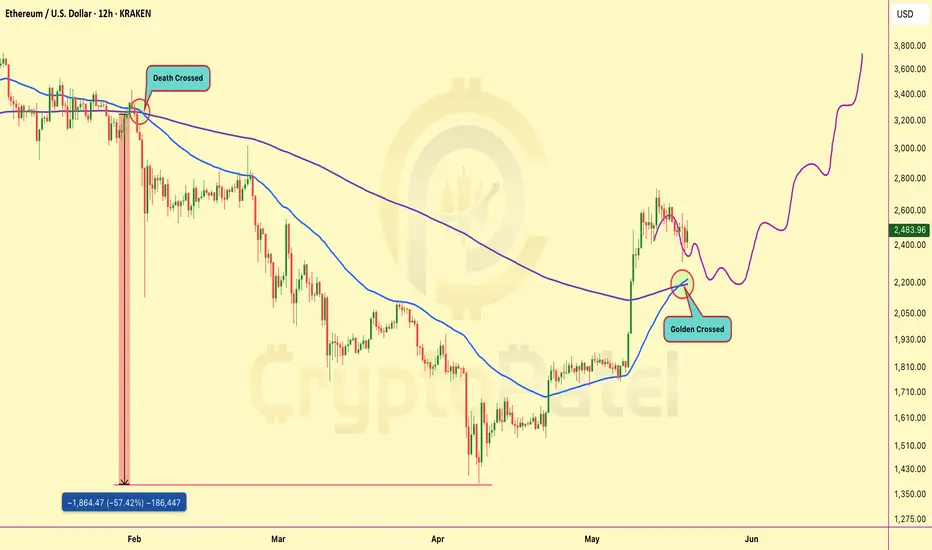
Ethereum Golden Crossed so What Next? $5000?🚨 CHART ALERT: CRYPTOCAP:ETH just flashed a GOLDEN CROSS on the 12H after months of bleeding!
Last time we saw a DEATH CROSS, #Ethereum crashed -57%.
Now it's doing the opposite — this could be the start of a massive pump! 🚀
TARGET? Maybe $3,800-$5000+ soon! 📈
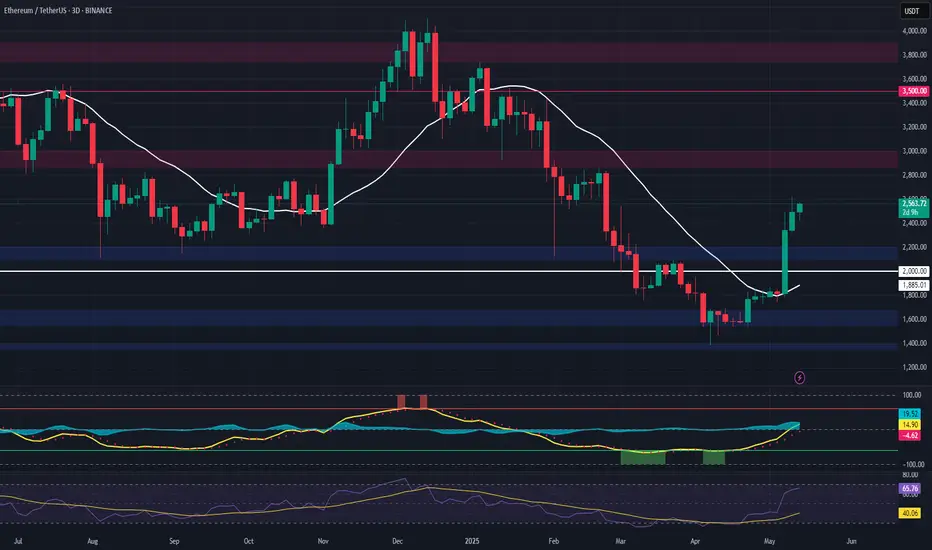
Ethereum - Technical Analysis Overview week of May 19–25, 2025Predicting Ethereum's (ETH) price movement for the week of May 19–25, 2025, involves analysing recent technical indicators, market sentiment, and external factors. Below is a concise technical analysis based on available data, focusing on key indicators and potential price trends. Note that cryptocurrency markets are highly volatile, and this analysis is not financial advice—always conduct your own research.
#Technical Analysis Overview
Current Price (as of May 17, 2025): Approximately $2,550, at the time of posting
Market Sentiment: Neutral to bullish, with mixed signals from technical indicators and a Fear & Greed Index.
Recent Performance: ETH has risen 29.61% over the past week and 16.61% over the past month, showing strong short-term momentum but facing potential resistance at 2,750 - 3,050
#Volume and Volatility:
Recent trading volume has surged (from $22.02B to $42.95B daily), indicating strong market interest.
Volatility remains high (17.61% over the past 30 days), suggesting potential for sharp price swings.
For support and resistance please refer the chart

$ETH Pullback Loading: Is $1,800 the Next Big Buy Zone?Ethereum (ETH/USDT) Technical Outlook – Dip Analysis
After a strong bullish impulse breaking the downtrend, ETH is now entering a corrective phase.
Key Observation: Price has filled a major FVG (Fair Value Gap) near $2,500 and is showing signs of rejection.
🔻 Short-Term Bias: Bearish Retracement
We anticipate a pullback into the lower FVG zone between $1,854–$2,186, aligning with the +OB (Order Block) at ~$1,854-$1790 — a strong demand zone.
🟩 Buyers may step in here, making it a potential accumulation zone before the next leg up.
If this zone holds, ETH could resume its uptrend targeting the upper OB/FVG zone near $3,400–$3,600.
Strategy: Watch for bullish confirmation in the $1,800–$2,000 zone for potential long setups.

Ethereum (ETH) – Early Recovery Setup After Liquidity SweepEthereum has printed a bullish deviation below key liquidity ($1,500) and reclaimed the 20-day EMA, flipping prior resistance into support — a classic signal of early reversal momentum.
We're now watching for a pullback into the $2,100–$2,200 demand zone to offer an optimal spot entry before a potential move into higher timeframe targets.
🔹 Entry Zone:
$2,100 – $2,200 (pullback into reclaimed support/demand)
🎯 Take Profit Targets:
🥇 $3,000
🥈 $3,500
🥉 $3,900
🛑 Stop Loss:
Close below $2,000 (to invalidate reclaim of structure)
Ethereu ETHUSDT Price Outlook: Key Resistance at 2005–2055 Level"On the Daily Time Frame, the levels 2005.00 and 2055.21 are key resistance zones. If the price approaches this area, there is a high probability of rejection. Should the market show bearish confirmation on the 1-hour time frame from this region, it may indicate a potential move lower—possibly to hunt liquidity near the trendline around 1730. Further downside could lead the price into the demand zone between 1600 and 1500, where it may find support."
No trade setup is ever 100% certain. Every trade carries both risk and reward. Effective risk management is the key to long-term success in trading.
Thanks for Your Support.

Ethereum Spot Bidding Zones - Ethereum is currently trading at 1462$ down 64% from its ATH
- Ethereum has underperformed BTC throughout the whole Crypto cycle and currently its continuing to do the same
- Ethereum has deviated below its important Market Structure Shifts and currently trying to pierce below its origin of the move
- Ethereum has a very good buying interest around 882$-1280$ this is a broader range where you should be keeping your eyes on in order to bid for Ethereum
- Another catalyst that I can see on the board is ETH/BTC pair vs BTC/DOM one is ready to bottom out near its point of interest on the other hand other is ready to top out
- BTC/D bearish and ETH/BTC bullish will print a lot of money in alts watch out both
