ETH/USDT Bullish Reversal AnalysisETH/USDT Bullish Reversal Analysis 🚀📈
🔍 Chart Overview:
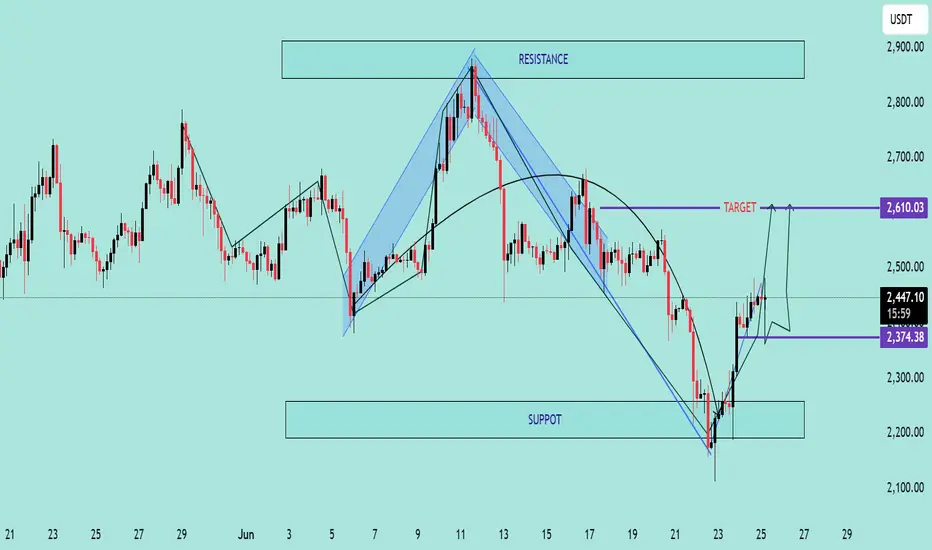
Ethereum (ETH) has shown a strong bullish reversal from the support zone near $2,200, forming a V-shaped recovery pattern. The price is currently trading around $2,450, with upward momentum targeting the next key resistance level.
📌 Key Technical Highlights:
✅ Support Zone:
Clearly respected at $2,200 – $2,300 range
Multiple candle wicks suggest strong buyer interest
✅ Resistance Zone:
Major resistance expected around $2,900
Historical rejection indicates potential selling pressure
✅ Target Level:
Short-term target marked at $2,610 🟣
If momentum sustains, price could push towards this zone before facing resistance
📈 Bullish Momentum:
Strong breakout from downtrend channel
Formation of higher highs and higher lows
Price action respecting upward trend structure
🛠 Pattern Structure:
Reversal pattern after corrective phase
Bullish engulfing candles suggest continuation
📊 Forecast Path:
Two potential scenarios are outlined:
📈 A clean push to the $2,610 target, followed by consolidation
🔄 A short pullback to $2,374 before continuation to the target
⚠️ Conclusion:
ETH/USDT is showing bullish signs with potential to reach $2,610. Watch for consolidation or pullbacks as buying opportunities, but be cautious of heavy resistance above $2,900. Ideal for short- to mid-term bullish setups.
🔔 Recommendation:
Monitor price action around $2,374–$2,450 zone for potential entries with tight risk
Ethusdtidea
ETH/USDT Bullish Reversal from Support ZoneChart Analysis:
The chart illustrates a range-bound consolidation with clear support around $2,381.45 and resistance near $2,556.54.
🔍 Key Observations:
✅ Multiple Support Tests: Price has tested the support zone several times (highlighted by orange circles) and respected it, indicating strong buying interest at the lower boundary.
📉 Fakeout and Recovery: A false breakout below support occurred, but the candle quickly reversed, signaling a bear trap and potential for bullish momentum.
🔼 Rejection Wick & Consolidation: A strong rejection wick on the most recent candlestick shows buyers defending the zone aggressively. The current price action shows consolidation — a bullish accumulation pattern.
🎯 Upside Target: Based on the range breakout projection, the price could potentially revisit the resistance zone at $2,556.54, marked as the TARGET on the chart.
📌 Technical Outlook:
🟢 Bias: Bullish as long as the price holds above $2,381.45.
💹 Entry Idea: Aggressive buyers may enter near current levels with a stop below the wick low.
🛑 Risk Level: Tight stop-loss needed as the structure relies heavily on support holding.
📈 Conclusion:
A classic range rebound setup is forming with potential for upside movement back toward resistance. A breakout above $2,556.54 could initiate a trend continuation rally

ETH/USDT – Bearish Rejection from Resistance ZoneETH/USDT – Bearish Rejection from Resistance Zone 🚨🧱
The chart reflects a clear bearish structure for Ethereum (ETH/USDT), presenting multiple rejection signals from the resistance zone (~$2,750 - $2,850) marked by red arrows. Here's the breakdown:
🔴 Resistance Zone
Price attempted to break above this zone three times, each met with a sharp rejection.
This indicates strong seller dominance and confirms the zone as a solid supply area.
📉 Current Market Structure
After the last rejection, ETH broke below minor support, turning structure bearish.
Price is currently trading around $2,529.69, forming lower highs and lower lows – a textbook downtrend.
🟢 Support Zone Target
The price is expected to move downward toward the support zone (~$2,250 - $2,300).
The projection drawn on the chart suggests further selling pressure before any potential reversal.
📊 Conclusion
Unless ETH reclaims the resistance zone, the bearish bias remains strong. A move to the support zone looks likely in the near term, where buyers may reassess the market.
📌 Trade Note:
Resistance holds ➡️ look for short entries 📉
Support approaches ➡️ prepare for potential bounce or consolidation

ETHUSD SHOWING A GOOD UP MOVE WITH 1:8 RISK REWARD ETHUSD SHOWING A GOOD UP MOVE WITH 1:8 RISK REWARD
DUE TO THESE REASON
A. its following a rectangle pattern that stocked the market
which preventing the market to move any one direction now it trying to break the strong resistant lable
B. after the break of this rectangle it will boost the market potential for break
C. also its resisting from a strong neckline the neckline also got weeker ald the price is ready to break in the outer region
all of these reason are indicating the same thing its ready for breakout BREAKOUT trading are follws good risk reward
please dont use more than one percentage of your capitalfollow risk reward and tradeing rules
that will help you to to become a bettertrader
thank you

My Pick for this year Crypto ??? is Ethereum (ETH)ive used schiff picthfork, trend based fib extension, chart pattern , support resistance to get this level and conclusion
NOTE ; This could be long term call, buy eth at cmp my stop loss will be 1100 and target will be 2000 & 3500
