ETH/USDT Bullish Reversal AnalysisETH/USDT Bullish Reversal Analysis 🚀📈
🔍 Chart Overview:
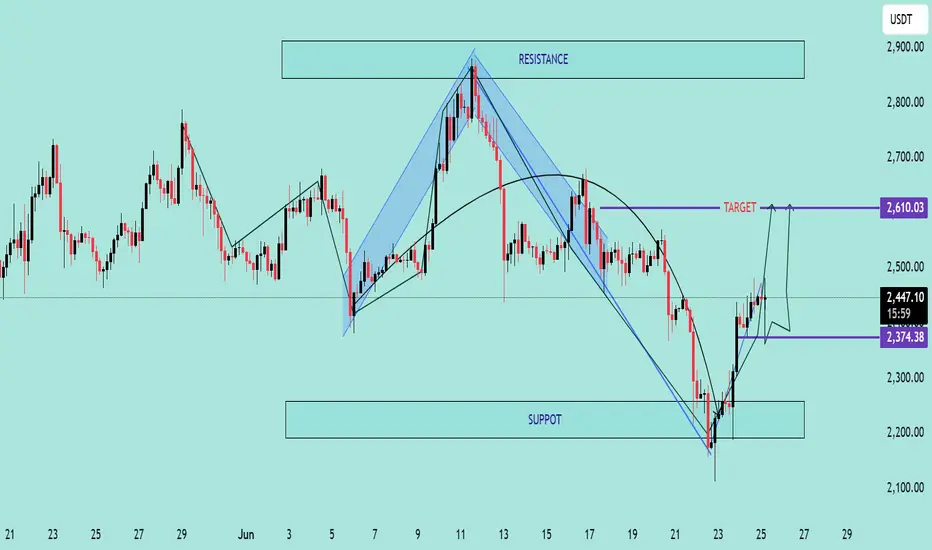
Ethereum (ETH) has shown a strong bullish reversal from the support zone near $2,200, forming a V-shaped recovery pattern. The price is currently trading around $2,450, with upward momentum targeting the next key resistance level.
📌 Key Technical Highlights:
✅ Support Zone:
Clearly respected at $2,200 – $2,300 range
Multiple candle wicks suggest strong buyer interest
✅ Resistance Zone:
Major resistance expected around $2,900
Historical rejection indicates potential selling pressure
✅ Target Level:
Short-term target marked at $2,610 🟣
If momentum sustains, price could push towards this zone before facing resistance
📈 Bullish Momentum:
Strong breakout from downtrend channel
Formation of higher highs and higher lows
Price action respecting upward trend structure
🛠 Pattern Structure:
Reversal pattern after corrective phase
Bullish engulfing candles suggest continuation
📊 Forecast Path:
Two potential scenarios are outlined:
📈 A clean push to the $2,610 target, followed by consolidation
🔄 A short pullback to $2,374 before continuation to the target
⚠️ Conclusion:
ETH/USDT is showing bullish signs with potential to reach $2,610. Watch for consolidation or pullbacks as buying opportunities, but be cautious of heavy resistance above $2,900. Ideal for short- to mid-term bullish setups.
🔔 Recommendation:
Monitor price action around $2,374–$2,450 zone for potential entries with tight risk
ETHUSDTPERP
ETH/USDT Bullish Reversal from Support ZoneChart Analysis:
The chart illustrates a range-bound consolidation with clear support around $2,381.45 and resistance near $2,556.54.
🔍 Key Observations:
✅ Multiple Support Tests: Price has tested the support zone several times (highlighted by orange circles) and respected it, indicating strong buying interest at the lower boundary.
📉 Fakeout and Recovery: A false breakout below support occurred, but the candle quickly reversed, signaling a bear trap and potential for bullish momentum.
🔼 Rejection Wick & Consolidation: A strong rejection wick on the most recent candlestick shows buyers defending the zone aggressively. The current price action shows consolidation — a bullish accumulation pattern.
🎯 Upside Target: Based on the range breakout projection, the price could potentially revisit the resistance zone at $2,556.54, marked as the TARGET on the chart.
📌 Technical Outlook:
🟢 Bias: Bullish as long as the price holds above $2,381.45.
💹 Entry Idea: Aggressive buyers may enter near current levels with a stop below the wick low.
🛑 Risk Level: Tight stop-loss needed as the structure relies heavily on support holding.
📈 Conclusion:
A classic range rebound setup is forming with potential for upside movement back toward resistance. A breakout above $2,556.54 could initiate a trend continuation rally

ETH/USDT – Bearish Rejection from Resistance ZoneETH/USDT – Bearish Rejection from Resistance Zone 🚨🧱
The chart reflects a clear bearish structure for Ethereum (ETH/USDT), presenting multiple rejection signals from the resistance zone (~$2,750 - $2,850) marked by red arrows. Here's the breakdown:
🔴 Resistance Zone
Price attempted to break above this zone three times, each met with a sharp rejection.
This indicates strong seller dominance and confirms the zone as a solid supply area.
📉 Current Market Structure
After the last rejection, ETH broke below minor support, turning structure bearish.
Price is currently trading around $2,529.69, forming lower highs and lower lows – a textbook downtrend.
🟢 Support Zone Target
The price is expected to move downward toward the support zone (~$2,250 - $2,300).
The projection drawn on the chart suggests further selling pressure before any potential reversal.
📊 Conclusion
Unless ETH reclaims the resistance zone, the bearish bias remains strong. A move to the support zone looks likely in the near term, where buyers may reassess the market.
📌 Trade Note:
Resistance holds ➡️ look for short entries 📉
Support approaches ➡️ prepare for potential bounce or consolidation

Ethereu ETHUSDT Price Outlook: Key Resistance at 2005–2055 Level"On the Daily Time Frame, the levels 2005.00 and 2055.21 are key resistance zones. If the price approaches this area, there is a high probability of rejection. Should the market show bearish confirmation on the 1-hour time frame from this region, it may indicate a potential move lower—possibly to hunt liquidity near the trendline around 1730. Further downside could lead the price into the demand zone between 1600 and 1500, where it may find support."
No trade setup is ever 100% certain. Every trade carries both risk and reward. Effective risk management is the key to long-term success in trading.
Thanks for Your Support.

ETHUSDT Short to medium Term sellETHUSDT on 4 hrs. chart is showing resistance.
Technical Analysis:
1. Backtesting within the last 7 days shows that there are no specific patterns in the MACD, RSI, BOLL, and KDJ indicators.
2. Backtesting within the last 30 days also shows no specific patterns in the MACD, RSI, BOLL, and KDJ indicators.
3. The BOLL support price is $2,476.42, and the BOLL resistance price is $2,513.27.

ETH/USDT:- Bullish Momentum Building Towards 1760-1770 Levels ?In this technical analysis, we delve into the current market trends of the ETH/USDT trading pair. The Ethereum cryptocurrency has shown promising signs of bullish momentum, with key buying and selling levels identified for traders to consider.
Buying Area at 1760-1780 Levels:-
Ethereum's recent price action reveals a strong support zone between the 1760-1780 levels. Traders looking to establish long positions can consider accumulating Ethereum within this range, aiming to capitalize on potential price appreciation.
Price Targets at 1950-1960 Levels:-
The ETH/USDT pair is exhibiting a promising uptrend, with price targets set at the 1950-1960 levels. It is essential to monitor price movements closely, as a sustained breach above this range could trigger further gains.
Bullish Order Block Opportunity:-
An intriguing opportunity arises from the presence of a bullish order block at 1760-1770 levels. This block signifies a strong demand area, highlighting the potential for upward price movement. Additionally, if the market corrects itself and ETH/USDT retraces to the 1650-1680 levels, astute traders can consider this a "buy for bag" opportunity.
By staying informed about these key levels and potential opportunities, traders can position themselves for success in the dynamic world of cryptocurrency trading. Follow us on Trading View for real-time updates, in-depth analyses, and actionable insights to enhance your trading journey.

ETHUSDTPERPETHUSDTPERP
buy
buy
buy
buy
buy
buy
buy
buy
buy
buy
buy
buy
buy
buy
buy
buy
buy
buy
buy
buy
buy
buy
buy
buy
buy

ETHUSDT LongETHUSDT Analysis
IMO
Give a Like and Feel free to share your opinions in the comment!
Happy Trading 😊

ETH IN A CRITICAL ZONEETHEREUM is in a critical area from where it could likely breakdown. But the confirmation comes if it breaks the demand zone as well. Breaking the consolidation zone in the upper side with good volumes could give upward rally as well but that doesn't seem to be a likely case currently.


ethusdtp line chart detailsethusdtp line chart details ethusdtp line chart details ethusdtp line chart details ethusdtp line chart details
