ETHUSD SHOWING A GOOD UP MOVE WITH 1:10 RISK REWARDETHUSD SHOWING A GOOD
UP MOVE WITH 1:10 RISK REWARD
DUE TO THESE REASON
A. its following a rectangle pattern that stocked the market
which preventing the market to move any one direction now it trying to break the strong resistant lable
B. after the break of this rectangle it will boost the market potential for break
C. also its resisting from a strong neckline the neckline also got weeker ald the price is ready to break in the outer region
all of these reason are indicating the same thing its ready for breakout BREAKOUT trading are follws good risk reward
please dont use more than one percentage of your capitalfollow risk reward and tradeing rules
that will help you to to become a bettertrader
thank you
Ethusdtrade

ETHUSD-Potential Reversal Eyes LongETHUSD declined into a previously tested support zone, triggering a new Buy signal from SignalPro.
Price is currently attempting to reclaim short-term structure but remains under EMA resistance.
The recent Sell signal failed to create a lower low, potentially signaling bearish exhaustion.
🔍 Educational Setup Observation:
Reclaim Zone: Near 3,790.00
Stop Reference: Below 3,744.71 (beneath structural low)
Target Zone: 4,223.47 — aligned with prior imbalance and resistance from previous high-volume node
If price can decisively reclaim above EMAs, momentum shift may accelerate.
⚠️ This analysis is for educational purposes only. It does not constitute financial advice. Always do your own analysis and apply proper risk management.

ETHUSD Entry at $2,422 with Target at $2,521and Support at 2,3921. Entry Point: ~2,422.2
This is the suggested buy area based on a recent bounce from the support zone.
2. Support Zone (Purple Box):
Bottom boundary: ~2,392.4
Top boundary: ~2,408.4
Price has bounced multiple times here, showing strong buying interest.
3. Resistance Point: ~2,463.9
A clear horizontal resistance line, previously tested.
4. EA Target Point: ~2,522.1
A bullish target if the price breaks above the resistance level.
---
🔶 Highlighted Patterns / Markers
Orange Circles: Indicate key swing highs and lows — possibly used to identify double tops/bottoms or rejection/wick zones.
Blue Arrows: Illustrate the anticipated move from:
Entry (2,408.1) → Resistance (2,463.9) → Target (2,521.2)
Target gain = +111.7 USD (+4.64%)
---
🔻 Stop Loss Level
Set just below the support box at ~2,392.4
Protects from false breakouts or deeper pullbacks.
---
📈 Strategy Outlook
Bullish Bias: The setup expects a breakout from the current price range.
Risk-Reward Ratio: Appears favorable — tight stop and wide target.
Confirmation Needed: A solid breakout and hold above 2,423–2,425 may be the early confirmation signal.
---
📌 Summary
Element Value
Entry Point ~2,422.2
Stop Loss ~2,392.4
Resistance ~2,463.9
Target (TP) ~2,521.2
R:R Ratio Approx. 3:1
Bias Bullish

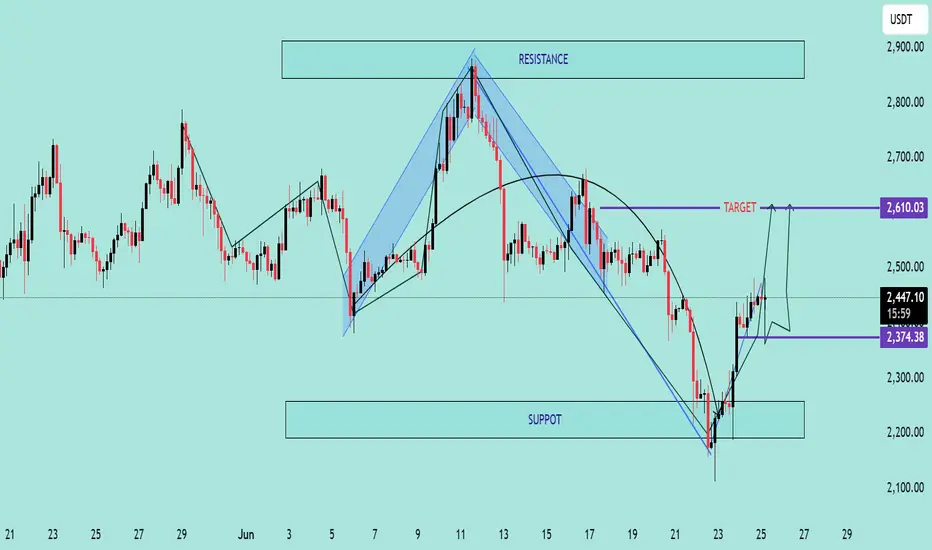
ETH/USDT Bullish Reversal AnalysisETH/USDT Bullish Reversal Analysis 🚀📈
🔍 Chart Overview:
Ethereum (ETH) has shown a strong bullish reversal from the support zone near $2,200, forming a V-shaped recovery pattern. The price is currently trading around $2,450, with upward momentum targeting the next key resistance level.
📌 Key Technical Highlights:
✅ Support Zone:
Clearly respected at $2,200 – $2,300 range
Multiple candle wicks suggest strong buyer interest
✅ Resistance Zone:
Major resistance expected around $2,900
Historical rejection indicates potential selling pressure
✅ Target Level:
Short-term target marked at $2,610 🟣
If momentum sustains, price could push towards this zone before facing resistance
📈 Bullish Momentum:
Strong breakout from downtrend channel
Formation of higher highs and higher lows
Price action respecting upward trend structure
🛠 Pattern Structure:
Reversal pattern after corrective phase
Bullish engulfing candles suggest continuation
📊 Forecast Path:
Two potential scenarios are outlined:
📈 A clean push to the $2,610 target, followed by consolidation
🔄 A short pullback to $2,374 before continuation to the target
⚠️ Conclusion:
ETH/USDT is showing bullish signs with potential to reach $2,610. Watch for consolidation or pullbacks as buying opportunities, but be cautious of heavy resistance above $2,900. Ideal for short- to mid-term bullish setups.
🔔 Recommendation:
Monitor price action around $2,374–$2,450 zone for potential entries with tight risk
ETH/USDT Bullish Reversal from Support ZoneChart Analysis:
The chart illustrates a range-bound consolidation with clear support around $2,381.45 and resistance near $2,556.54.
🔍 Key Observations:
✅ Multiple Support Tests: Price has tested the support zone several times (highlighted by orange circles) and respected it, indicating strong buying interest at the lower boundary.
📉 Fakeout and Recovery: A false breakout below support occurred, but the candle quickly reversed, signaling a bear trap and potential for bullish momentum.
🔼 Rejection Wick & Consolidation: A strong rejection wick on the most recent candlestick shows buyers defending the zone aggressively. The current price action shows consolidation — a bullish accumulation pattern.
🎯 Upside Target: Based on the range breakout projection, the price could potentially revisit the resistance zone at $2,556.54, marked as the TARGET on the chart.
📌 Technical Outlook:
🟢 Bias: Bullish as long as the price holds above $2,381.45.
💹 Entry Idea: Aggressive buyers may enter near current levels with a stop below the wick low.
🛑 Risk Level: Tight stop-loss needed as the structure relies heavily on support holding.
📈 Conclusion:
A classic range rebound setup is forming with potential for upside movement back toward resistance. A breakout above $2,556.54 could initiate a trend continuation rally

Ethereu ETHUSDT Price Outlook: Key Resistance at 2005–2055 Level"On the Daily Time Frame, the levels 2005.00 and 2055.21 are key resistance zones. If the price approaches this area, there is a high probability of rejection. Should the market show bearish confirmation on the 1-hour time frame from this region, it may indicate a potential move lower—possibly to hunt liquidity near the trendline around 1730. Further downside could lead the price into the demand zone between 1600 and 1500, where it may find support."
No trade setup is ever 100% certain. Every trade carries both risk and reward. Effective risk management is the key to long-term success in trading.
Thanks for Your Support.

ETH/USD Breakout Trading Setup – Long Entry with 16% Target PoteEntry Point: $1,593.08
Target Point: $1,807.83
Stop Loss: $1,472.68
Risk/Reward Ratio: Roughly 2.1:1
Indicators Used:
EMA 30 (Red Line) at $1,593.08 (near entry point)
EMA 200 (Blue Line) at $1,605.09
Analysis:
1. Consolidation Phase:
ETH is in a sideways range after a prior downtrend, consolidating within the purple support zone.
This zone (~$1,555 to ~$1,593) has been tested multiple times, suggesting a strong base.
2. Bullish Breakout Anticipation:
The setup expects a breakout above consolidation, targeting a 16.11% move to $1,807.83.
A breakout strategy is being applied, assuming ETH will reverse from this consolidation area a

ETHUSD SHOWING A GOOD DOWN MOVE WITH 1:7 RISK REWARDETHUSD SHOWING A GOOD DOWN MOVE WITH 1:7 RISK REWARD
DUE TO THESE REASON
A. its following a rectangle pattern that stocked the market
which preventing the market to move any one direction now it trying to break the strong resistant lable
B. after the break of this rectangle it will boost the market potential for break
C. also its resisting from a strong neckline the neckline also got weeker ald the price is ready to break in the outer region
all of these reason are indicating the same thing its ready for breakout BREAKOUT trading are follws good risk reward
please dont use more than one percentage of your capitalfollow risk reward and tradeing rules
that will help you to to become a bettertrader
thank you

BUY ETHEREUM ⧫ - 1DEthereum has been one of our favorite and strong project, from the past few months it has been continue increasing, thus not giving a chance to buy at cheap, but now is the time to build some positions as the price drops to $3300 (nearly 6%) from the recent highs. Considering this Bull market, Ethereum will make new all time highs .
Must use stop loss in trading , this is my personal view and not a financial advice. Cryptocurrency market is highly volatile and thus can lead to financial loss, kindly #DYOR.

ETHUSDT LongETHUSDT Analysis
IMO
Give a Like and Feel free to share your opinions in the comment!
Happy Trading 😊

ETH could hit 245 dollorETH is following ascending channel since its last fall to 86 dollars, On 30th April it tried to break out upward channel resistance but unable sustain the movement and thereafter it is moving downward with slight resistance of trend line that is depicted with green color. The white lines are Fibonacci retrenchment level 0.5,0.61,0.786 that represents 187, 211, 245 level respectively,the price is facing resistance from 211.
If price breaks that level it will hit 245 level within next 2 to 3 days , buy it at 215 with volume confirmation
