ETH/USDT Bullish Reversal AnalysisETH/USDT Bullish Reversal Analysis 🚀📈
🔍 Chart Overview:
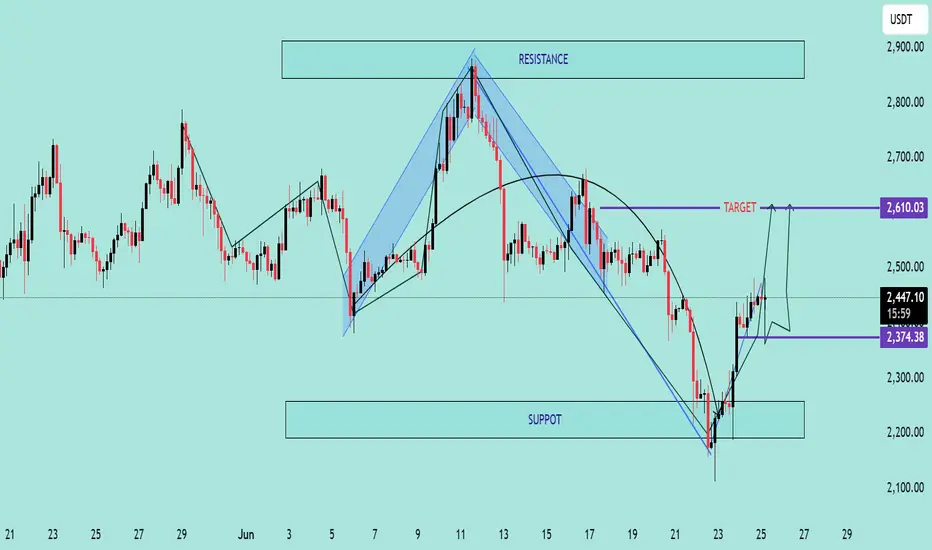
Ethereum (ETH) has shown a strong bullish reversal from the support zone near $2,200, forming a V-shaped recovery pattern. The price is currently trading around $2,450, with upward momentum targeting the next key resistance level.
📌 Key Technical Highlights:
✅ Support Zone:
Clearly respected at $2,200 – $2,300 range
Multiple candle wicks suggest strong buyer interest
✅ Resistance Zone:
Major resistance expected around $2,900
Historical rejection indicates potential selling pressure
✅ Target Level:
Short-term target marked at $2,610 🟣
If momentum sustains, price could push towards this zone before facing resistance
📈 Bullish Momentum:
Strong breakout from downtrend channel
Formation of higher highs and higher lows
Price action respecting upward trend structure
🛠 Pattern Structure:
Reversal pattern after corrective phase
Bullish engulfing candles suggest continuation
📊 Forecast Path:
Two potential scenarios are outlined:
📈 A clean push to the $2,610 target, followed by consolidation
🔄 A short pullback to $2,374 before continuation to the target
⚠️ Conclusion:
ETH/USDT is showing bullish signs with potential to reach $2,610. Watch for consolidation or pullbacks as buying opportunities, but be cautious of heavy resistance above $2,900. Ideal for short- to mid-term bullish setups.
🔔 Recommendation:
Monitor price action around $2,374–$2,450 zone for potential entries with tight risk
Ethusdtrend
ETH/USDT – Bearish Rejection from Resistance ZoneETH/USDT – Bearish Rejection from Resistance Zone 🚨🧱
The chart reflects a clear bearish structure for Ethereum (ETH/USDT), presenting multiple rejection signals from the resistance zone (~$2,750 - $2,850) marked by red arrows. Here's the breakdown:
🔴 Resistance Zone
Price attempted to break above this zone three times, each met with a sharp rejection.
This indicates strong seller dominance and confirms the zone as a solid supply area.
📉 Current Market Structure
After the last rejection, ETH broke below minor support, turning structure bearish.
Price is currently trading around $2,529.69, forming lower highs and lower lows – a textbook downtrend.
🟢 Support Zone Target
The price is expected to move downward toward the support zone (~$2,250 - $2,300).
The projection drawn on the chart suggests further selling pressure before any potential reversal.
📊 Conclusion
Unless ETH reclaims the resistance zone, the bearish bias remains strong. A move to the support zone looks likely in the near term, where buyers may reassess the market.
📌 Trade Note:
Resistance holds ➡️ look for short entries 📉
Support approaches ➡️ prepare for potential bounce or consolidation

BUY ETHEREUM ⧫ - 1DEthereum has been one of our favorite and strong project, from the past few months it has been continue increasing, thus not giving a chance to buy at cheap, but now is the time to build some positions as the price drops to $3300 (nearly 6%) from the recent highs. Considering this Bull market, Ethereum will make new all time highs .
Must use stop loss in trading , this is my personal view and not a financial advice. Cryptocurrency market is highly volatile and thus can lead to financial loss, kindly #DYOR.


There are so much confluences to be bullish on EthusdtDaily time frame price hovering up over the POC. price walking through in an upside parallel channel cpm is over the trend line.
Rsi bottom up, price hloding 38.2 fib level.
Reason: Not to be bullish or bearish always. your life is your choice.
