EURAUDEURAUD is showing similar behavior to other EUR pairs — strong bullish move with a break in structure. Now just waiting for a retracement back down into the 4H demand zone before looking for long opportunities.
Would like to see price come into that zone, react, and show signs of strength again before considering buys. Just being patient and letting the setup come to me.
EURAUD

BUY IDEA EURAUD Looking to buy EURAUD after pull back expecting bulls to continue pushing the market higher.

EUR/AUD Bullish Channel Trade Setup –Demand Zone Bounce Strategy📉 1. Downtrend Ends
🔽 Price was falling earlier (left side of chart)
🔄 Then it reversed at the bottom of the channel (yellow dot)
➡️ Trend Change Begins
📈 2. Uptrend Channel Forms
📊 Channel consists of:
🔵 Resistance Line (upper blue)
🟢 Support Line (lower blue)
🔁 Price is bouncing between these two lines like a pinball:
🔵 Resistance Line
| 🔼
🟢 Support Line
💠 3. Key Trading Zone
🔷 DEMAND ZONE: (Bright blue box)
🟦 Between 1.74697 and 1.75349
👉 Buyer interest expected here
🎯 4. Trade Setup (Bullish Idea)
🟢 Entry Point:
📍 1.75349
✨ Near support zone and channel bottom
🔻 Stop Loss:
🚫 1.74710
📉 Below the demand zone, protects from downside
🎯 Target Point:
🎯 1.77800
📈 Near the resistance line at the top of the channel
📊 Strategy Flow (Emoji Dots Path)
📉 🔽 🔽 🔽
🟡 Bottom found
⬆️ 🔼 🔼 🔼
📈 Enters channel
🟦 Price enters DEMAND ZONE
🔽
🔵 Entry: 1.75349
🔼
🎯 Target: 1.77800
✅ Final Thoughts
This is a clean bullish setup within a rising channel
✅ Wait for price action confirmation (like a bullish candle 🕯️) in the demand zone
🔒 Protect with your stop loss
🚀 Potential reward is strong if it bounces up

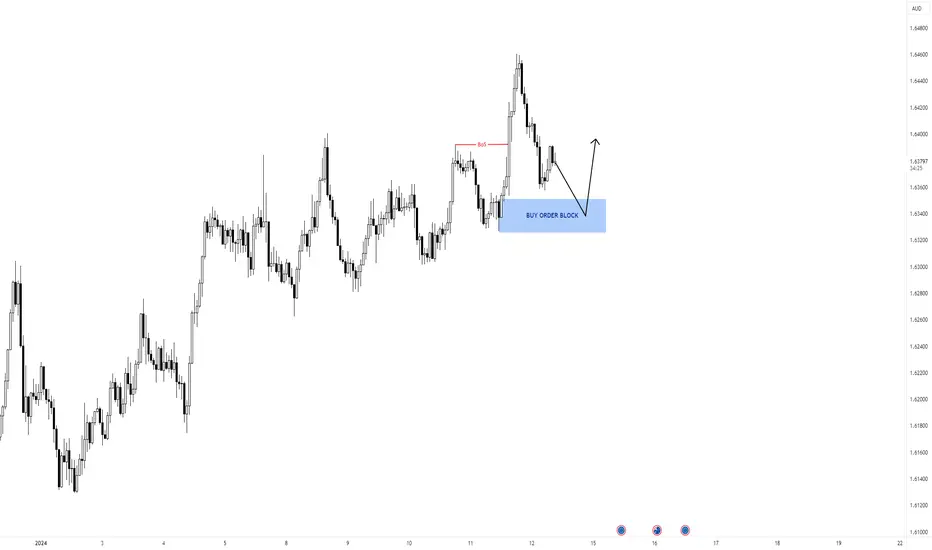
EURAUD BUYSAs you can see, the price is approaching the daily demand zone — our potential buy area. The green box marks the zone where inefficiency is filled, as well as the last candle before a strong upward move. We also have the 1.72000 level, a round number that can naturally attract price action due to institutional orders and interest.
The grey circles highlight the low and high of my daily trading range. What I like about the current price action is the impulsive move to the upside, followed by a steady and controlled pullback as the price approaches the buy zone.
This setup presents a strong trading opportunity — now we wait and see.

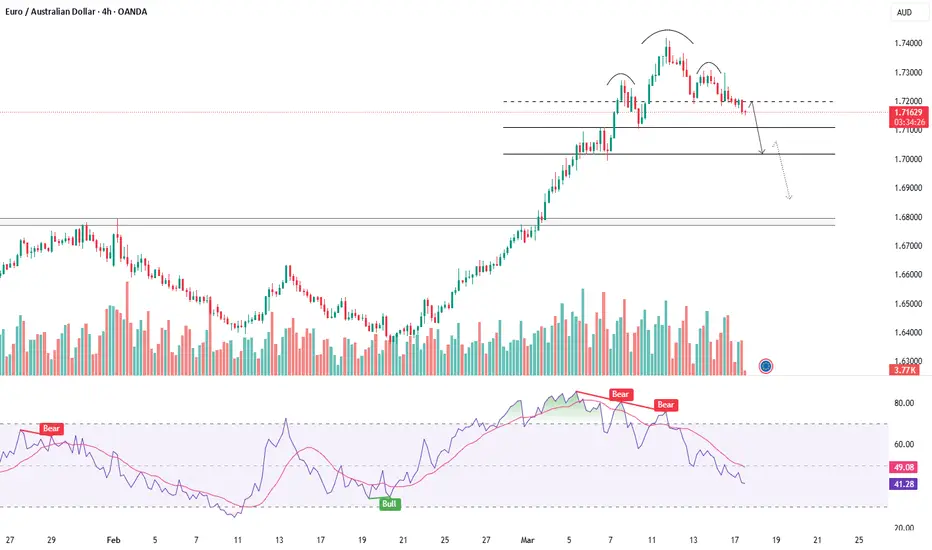
"EUR/AUD Bearish Channel with Key Support Ahead"📉 Market Structure Analysis (Bearish Bias)
Current Trend:
The pair is trading within a well-defined descending channel, indicating a bearish trend. Price action is forming lower highs and lower lows, adhering to the channel boundaries.
Moving Averages (EMA):
EMA 50 (Red) at 1.77491 is above the price, acting as dynamic resistance.
EMA 200 (Blue) at 1.73338 is close to current price, likely to act as a support area in the short term.
The bearish crossover between the 50 EMA and current price supports the continuation of downward momentum.
🔍 Key Zones:
Weak Resistance Zone:
Located around 1.7740 – 1.8000, previously a support area, now acting as resistance.
Price rejection from this zone multiple times indicates sellers' strength.
Support Zone:
Located around 1.6950 – 1.7100, where demand may return.
This zone coincides with the lower boundary of the descending channel, making it a likely reaction zone.
📊 Forecast / Expectation:
The chart projects a bear flag / corrective pullback before another leg downward toward the support zone.
If price breaks and sustains below the EMA 200, it will likely accelerate bearish pressure.
The descending channel suggests potential continuation to the downside unless price breaks out of the upper boundary with momentum.
✅ Trade Implications:
Bearish Setup:
Look for short opportunities on intraday pullbacks near the resistance or EMA 50.
Bullish Invalidations:
A breakout above the descending channel and sustained move above 1.7800 would invalidate the bearish outlook.
Conclusion:
This chart presents a technically clean bearish setup. The confluence of a descending channel, EMA rejection, and defined resistance/support zones suggests the EUR/AUD may continue lower, especially if it loses the 1.7300 level decisively.

EURAUD Short Setup – Bearish Breakdown & Retest of Key Structure📋 Pair: EURAUD
Timeframe: 4-Hour
Bias: Bearish
Strategy Type: Supply & Demand + Trendline Break + BOS (Break of Structure) + Retest Confirmation
🧠 Market Structure Analysis:
Price has formed a series of lower highs and lower lows, confirming a bearish trend on the 4H chart.
A clean descending trendline has been respected multiple times, adding confluence to the bearish pressure.
Recently, price broke below a strong horizontal support zone (~1.7580), which had acted as a demand area multiple times in the past.
After the breakdown, price pulled back to retest this previous support as resistance, perfectly tapping into a supply zone before rejecting.
🧱 Key Zones:
Supply (Resistance): 1.7580 – 1.7674
Entry Zone (Trigger): Inside rejection candle from supply
Target Demand (Support): 1.7100 – 1.7120 (clean untested demand + price imbalance)
🎯 Trade Plan:
Entry: 1.7570 (after confirmation of rejection from supply)
Stop Loss: 1.7680 (above the supply zone + trendline)
Take Profit 1: 1.7350 (minor structure)
Take Profit 2: 1.7120 (major untested demand zone)
Optional TP3: 1.7099 (full imbalance fill)
⚖️ Risk-to-Reward (R:R):
TP1: ~1:2
TP2: ~1:4
TP3: ~1:5+
✅ Confluences Supporting the Setup:
✅ Break and Retest of major 4H support (turned resistance).
✅ Bearish trendline acting as dynamic resistance.
✅ Liquidity sweep before rejection (stop hunt above minor highs).
✅ Bearish candle confirmation from retest zone.
✅ Target aligns with clean demand + imbalance, likely to attract buyers.
⚠️ Invalidation Criteria:
If price breaks and holds above 1.7680, structure is invalidated.
Watch out for fakeouts around FOMC or major AUD/Euro news.
💡 Pro Tip (Optional):
You can scale in on lower timeframes (15M–1H) after a CHoCH (change of character) within the retest zone for tighter entries and smaller stops.
Disclaimer: This analysis is for educational purposes only and not financial advice. Manage your risk wisely.

EURAUD EYES A REBOUND - CAN THE BULLS HOLD THE SUPPORT?Symbol - EURAUD
Amid a broader global bullish trend, the EURAUD pair is currently undergoing a corrective phase, approaching the support zone of the established trading range. Market participants are observing efforts by buyers to defend the 1.7750 level.
The pair remains within a broad consolidation range. Price action near the lower boundary has exhibited signs of a false breakout and subsequent liquidity absorption, which could potentially trigger a rebound toward the midpoint of the range or even a move toward the upper resistance levels.
Sustained consolidation above the 1.7750 mark, coupled with the emergence of a local reversal pattern, may serve as a catalyst for renewed upward momentum. While the overarching trend remains bullish, the current move reflects a local correction. Fundamentally, conditions remain uncertain. However, the US Dollar Index continues to correct after a recent sharp decline.
Key Resistance Levels: 1.7855, 1.7987
Key Support Levels: 1.7750, 1.7695
Should bullish momentum prevail and price remain above the critical 1.7750 support - marking the lower boundary of the range, there is potential for a rebound targeting liquidity pools situated above resistance levels.

EURAUD - IS THE DOWNTREND ABOUT TO KICK OFF?Symbol - EURAUD
The EURAUD pair is currently testing a key resistance level on the weekly chart. A false breakout has occurred following a liquidity sweep, with no apparent continuation of the bullish trend. Additionally, the chart is displaying a familiar pin-bar reversal pattern.
After the price exited the consolidation range, which was capped by the 1.6787 resistance level, a distribution pattern began to form, targeting liquidity located just above the weekly resistance at 1.7196. This target has now been reached, and the price is consolidating beneath the base of the reversal structure, signaling the potential for further downward movement. There is a likelihood of either liquidation or a downward impulse toward the 1.7100 - 1.7000 zone. The forex market has exhibited a relatively calm demeanor since the week's opening, allowing technical factors to dominate market behavior until fundamental influences come into play.
Key resistance levels: 1.7196, 1.7304
Key support levels: 1.7107, 1.7016
Interest lies in the areas just below the local lows; however, from a technical standpoint, the market is primarily focused on liquidity beyond the 1.6787 level. Given that there are no significant barriers beneath 1.7016, a break of this support would likely open up a clear path towards the next liquidity zone.
EURAUDFX:EURAUD
As you can see that EURAUD has created a Double top pattern and given a breakout in 15m Time frame so we can go for short side. Always go for pull back entries. So plan your trade accordingly...

EUR/AUD 4-Hour Chart AnalysisKey Observations:
1. Support Zone:
- The price is currently retesting a key support zone around 1.6540–1.6565, which previously acted as a demand zone.
2. Trendline Break:
- The uptrend has been invalidated with the break of the ascending trendline, suggesting a potential shift in momentum to neutral or bearish.
3. Key Levels:
- Resistance Above: Potential resistance can be seen near 1.6650–1.6700, in case of a bullish retracement.
- Support Below:
- 1.6359 (first support level).
- 1.6199 (major support).
- 1.6018 (long-term support zone).
4. Possible Price Movements:
- A bullish rebound from the current support zone or a bearish continuation if the price breaks below it.
---
Trading Scenarios:
1. Bullish Rebound:
- If the price holds above the 1.6540–1.6565 zone, it may attempt a recovery toward the previous highs.
- Entry: Above 1.6570
- Targets: 1.6650, 1.6700.
- Stop-Loss: Below 1.6530.
2. Bearish Breakdown:
- A decisive break below 1.6540 may open further downside toward the lower support levels.
- Entry: Below 1.6530.
- Targets: 1.6359, 1.6199, 1.6018.
- Stop-Loss: Above 1.6570.
---
- Wait for clear confirmation (e.g., a strong candle close) before entering a trade to avoid false breakouts.
- Use proper risk management with clearly defined stop-loss and take-profit levels.
---
**Disclaimer**:
This analysis is for informational purposes only and does not constitute financial advice. Trading involves substantial risk, and past performance is not indicative of future results. Always conduct your own research and consult a financial advisor before making investment decisions. Trade responsibly.

EUR-AUD | 4h | Swing Trading hello traders, i have prepared FX:EURAUD analysis for you. i have set my entry level, stop level and target level on the chart. all i ask from you is to support me with your likes. thank you to everyone who likes it.

EURAUD TRADE IDEA // i'm looking for bearish in this trade euraud continue going down in daily timeframe and we can see there is a bearish channel in 1h timeframe and 4h timeframe and previous daily candle is hammer so we need to wait for breakout in bearish channel then we can sell

DOUBLE TOP PATTERN SHOWING ON EURAUD IN DALY TIMEFRAME EURAUD SHOWING A GOOD UP MOVE WITH 1:5 RISK REWARD
DUE TO THESE REASON
A.DOUBLE TOP PATTERN SHOWING ON EURAUD
its following a rectangle pattern that stocked the market
which preventing the market to move any one direction now it trying to break the strong resistant lable
B. after the break of this rectangle it will boost the market potential for break
C. also its resisting from a strong neckline the neckline also got weeker ald the price is ready to break in the outer region
all of these reason are indicating the same thing its ready for breakout BREAKOUT trading are follws good risk reward
please dont use more than one percentage of your capitalfollow risk reward and tradeing rules
that will help you to to become a bettertrader
thank you

EURAUD daily analysis 15 aug 2024Trade Idea:
📍 Entry: 🎯 Target: ⛔ Stop Loss: (MARKED IN CHART)
💡 RISK REWARD 1 : 2 & 1:3
💰 Risk 1% of your trading capital.
⚠️ Markets can be unpredictable; research before trading.Disclaimer: This trade idea is based on Elliott Wave analysis and is for informational purposes only. Trading involves risks; seek professional advice before making any financial decisions.Informational onLY !!!!

euraud weekly analysis 15 aug 2024Trade Idea:
📍 Entry: 🎯 Target: ⛔ Stop Loss: (MARKED IN CHART)
💡 RISK REWARD good
💰 Risk 1% of your trading capital.
⚠️ Markets can be unpredictable; research before trading.Disclaimer: This trade idea is based on Elliott Wave analysis and is for informational purposes only. Trading involves risks; seek professional advice before making any financial decisions.Informational onLY !!!!

EURAUDThis is one of the clearest setups for the coming week. Price is in an uptrend. I anticipate a pullback into the demand/buy zone, followed by buyers entering the market. No further explanation needed, honestly.

EURAUD TARGET REACHEDIf you look at some previous posts, you will see EurAud was one of the trades I was in. And it paid off. Final target was reached on Wednesday just before the CPI news release on Nzd and overall this position made me +6% of profit. It was the right thing to close most of the position at high and then at marked area as if Nzd news would turn positive, the whole trend could reverse. All of 3 positions together had a potential hitting +9%, however, my risk is lower than 1% / trade usually. If you got into this with me, well done.
T

EURAUDThis is the trade from last week and my only profitable position as I do not enter every analysis I post because I do not want to over-trade. Very nice position overall, a bit slow but trade is valid until it is not.


EURAUD long on 4h, MSS with engulfing bar confirmation Confirmations:-
1] mss
2] engulfing bar
3] trend continuation
Target confirmation:- buyside liquidity area

EURAUDGreetings!
Welcome traders.
By choosing to "Follow", you can stay updated with the latest information promptly. Kindly consider clicking "Boost" as well.
Wishing you a pleasant day.

EURAUD DAY SELL PROJECTION 29.01.24 Reason Behind the Sell
1. Double the Time Bearish Engulfing In Day Candle
2. Obey the Parallel Downtrend Line
Overall Possible Outcomes
EURAUD SELL 1.6389
SL 1.6470
TP 1.6170

EURAUD Idea H1Here is my analysis for EURAUD on H1 using Order Block. The price could go bullish, you can put a pending order on the Order block or find an entry on LTF within OB Zone. Trade Safe!