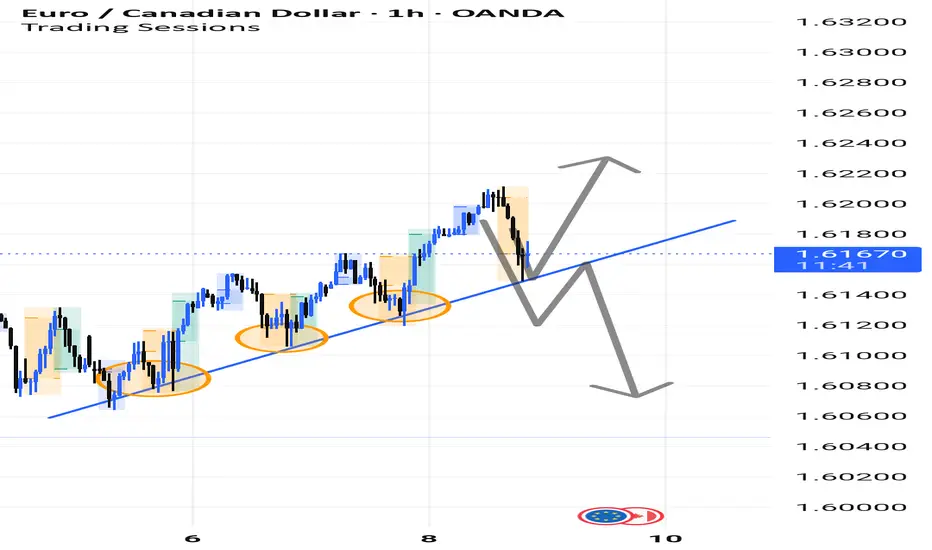
Market is following Trend line.As you can see EURCAD is following trend line if market break trend line we can sell and if give candelstick conformation in same direction we can take trade according to trend.
Plan your trade accordingly.
EURCAD
EURCAD - CONTINUATION TRADEThe pair is in a clear uptrend, consistently forming higher highs and higher lows. I’m waiting for a healthy pullback into the demand zone, where I’ll look for confirmation to enter long position. Setup remains solid as long as structure is maintained. If in any case price drop below the demand zone, that will indicate shift in a structure.
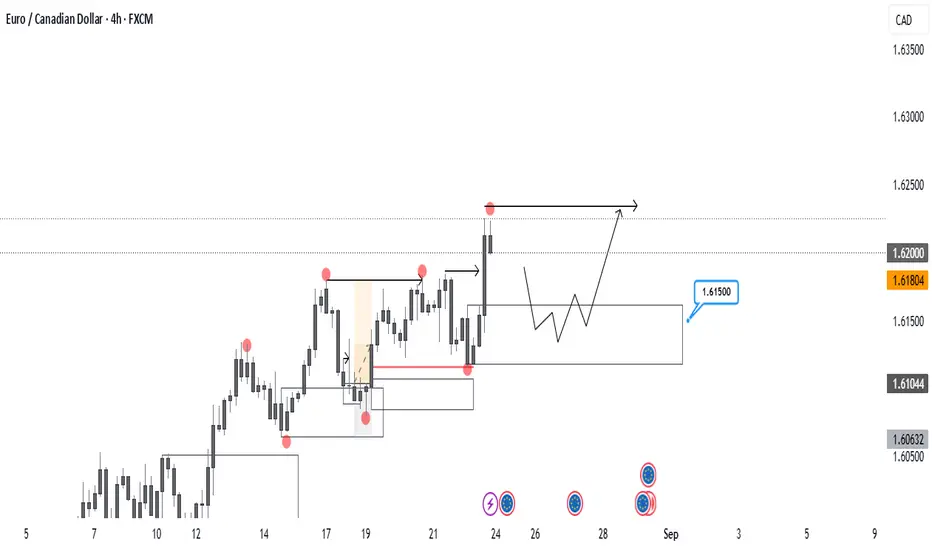
EURCAD - APPROACHES KEY LIQUIDITY ZONESymbol - EURCAD
EURCAD is currently undergoing a correction towards a key liquidity zone within the context of a broader and well established bullish trend. The question remains - will the bulls step in around the 1.6175 area?
EURCAD is retracing toward a strong support zone near 1.6175, contributing to short-term weakness in the pair. Despite this correction, the overall trend remains bullish, and a reaction from buyers in this region appears likely.
A false breakout above resistance has triggered the ongoing pullback. However, price action remains confined within the established trading range between 1.6400 & 1.6173. The market now appears to be gravitating toward support for a potential retest, and this zone could serve as a foundation for renewed upward movement.
Resistance levels: 1.6330, 1.6400
Support levels: 1.6175, 1.6030
A liquidity pool just below the 1.6200 - 1.6170 area may shift momentum in favor of buyers. Given that the broader structure remains bullish, this presents a potential advantage for long positions. A false breakdown of support, coupled with a lack of downside momentum, could act as a catalyst for renewed growth.

EURCAD BUYSPrice flipped the 4H structure on EURCAD, making a new higher high and shifting bullish. I’m watching for a retrace back down into the demand zone around 1.58500 that caused the flip.
Looking for buyers to come in here again and push the price higher. Will wait for some confirmation on the 15-minute chart before entering.

EUR/CAD Bearish Setup – Supply Zone Reversal Trade Plan"Trend:
⬆️ Uptrend (past) → 🔄 CHoCH (Change of Character) → ⬇️ Potential Downtrend
1. Pattern Formed:
📐 Rising Wedge → Bearish Reversal Pattern
➡️ Price broke structure at the bottom = CHoCH ⚠️
2. Supply Zone:
🟧 Supply Zone = 1.56580 - 1.56602
🔄 Price may pull back here before dropping
📍This is your ENTRY ZONE
3. Trade Setup:
🔵 Entry Point:
* 1.56580 (Inside Supply Zone)
❌ Stop Loss:
* 1.57176
* Just above swing high & supply zone 🛑
✅ Take Profit Target:
* 1.54370
* Strong previous support zone 💰
4. Indicators:
📉 EMA (47) = Acting as resistance
* Price is currently below EMA ➡️ Bearish signal
TRADE PLAN OVERVIEW:
* 🎯 Entry: 1.56580
* ⛔ Stop Loss: 1.57176
* 💸 Take Profit: 1.54370
* ⚖️ Risk/Reward Ratio: 1:3 (Great!)
Summary:
* Wait for rejection or bearish candle in supply zone
* Enter short
* Ride it down to the target
* Manage risk smartly ✅

EUR/CAD Bullish Momentum: Targeting 1.51+ !?📌 Key Observations:
1. Support Rejection ✅: The price has bounced off the support zone (highlighted in red), which was a critical level for a bullish continuation. This level is now acting as a launchpad for further upside.
2. Bullish Momentum 📈: The market structure suggests a strong uptrend, with recent bullish candles breaking through resistance.
3. Next Target 🎯: The green resistance zone at 1.51+ is the main target for buyers. The blue arrow indicates a potential move towards this level.
4. EMA 200 📉 (Red Line @ 1.48721): The price has successfully traded above the 200-day EMA, reinforcing bullish sentiment.
5. RSI (14) at 58.89 📊: The RSI is approaching the 60 level, showing bullish strength, but not yet overbought (above 70), meaning there’s still room for an upward move.
🔎 Potential Scenarios:
If the price breaks 1.51, we could see a further push towards new highs. 🚀
If the price rejects from 1.51, a retracement to 1.50 or lower might happen before another attempt upwards. 🔄
🎯 Conclusion: The market is currently bullish, with a high probability of hitting the next resistance zone. Watch for confirmation near 1.51—a breakout could mean further gains, while rejection could signal a pullback.

EURAUD TRADE IDEA // i'm looking for bearish in this trade euraud continue going down in daily timeframe and we can see there is a bearish channel in 1h timeframe and 4h timeframe and previous daily candle is hammer so we need to wait for breakout in bearish channel then we can sell

EURCAD 12.8 - XIt's a fresh new week ahead of us! Hello, traders. Let's start by analyzing EUR/CAD.
As you can see, the target for sells from the previous week was reached. So, here's what I'm focusing on now: Ideally, I'd like to see some signs of strength, which is what I’m watching for on smaller timeframes. Buys remain valid until the break of the low. If the price goes lower, the Point of Interest (POI) will be adjusted.
I will only post new analyses for some setups, as I’ve mainly updated ideas with comments on the existing ones.

EURCADPrice has recently taken out the high from April 2023, forming a new trading range and confirming the uptrend. However, after such strong bullish momentum, a pullback is anticipated. I will look for a counter-trend sell setup, expecting at least a 50% pullback to the first higher demand zone, with the ideal pullback being around 75%. From there, I will monitor the price action for potential buy opportunities and target the first High, just a simple price action...

EURCADHey, for an explanation and details of this trading idea, check my latest FX video analysis ( 22.7 - x ) Have a great week!
T

GOLD IN CORRECTIONNow we got 4h high which is using my method...
Already our 2 sell entry running profit
also we found 2 sell zone
1st sell limit 2254-2257
sl 2259 (need 1m or 5m confirmation then entry it else wait for 2nd zone)
tp 2252
tp 2249
tp 2244
buy zones are the tp4 and tp 5
In 4hrs we found 2 buy zone
1st buy zone 2201-2192 (we need 15M confirmation to take entry)
2nd buy zone 2167-2156(extreme buy zone no need to confirm)...which is in linked analysis
2nd sell limit 2261-2264
sl 2267
tp 2259
tp 2256
tp 2251
buy zones are the tp4 and tp5
In 4hrs we found 2 buy zone
1st buy zone 2201-2192 (we need 15M confirmation to take entry)
2nd buy zone 2167-2156(extreme buy zone no need to confirm)...which is in linked analysis
NOTES: EDUCATIONAL PURPOSE ONLY

GOLD IN BULLSH SORRY for late update.... Sunday i was too busy
Now we see xauusd hits the DAY 1st pull back zone(2259-2305)
In 4Hrs also gold hits 1st pull back zone(2263-2280.5)
once market touches our pull back market starts fall
In 15mins we got High confirmation using my method and also now we got choch (correction choch in 15mins only) confirmation
so entry will be
sell limit 2258-2262-2265
SL 2268(we already entry in 2263)
remember gold still in bullish only we got ONLY 15M confirmation
if you ok use mid lot else use low lot
Targets for intraday
TP1 +20 pips
TP2 +50pips
TP3 +100pips
TP4 1850
In 4hrs we found 2 buy zone
1st buy zone 2201-2192 (we need 15M confirmation to take entry)
2nd buy zone 2167-2156(extreme buy zone no need to confirm)
This two zones will be swing targets for given sell
once market cross 2nd buy zone gold will be red rose
trade carefully
NOTES: EDUCATIONAL PURPOSE ONLY

Eurcad Swing Position in downside with an amazing Reward to Risk
Price has formed a Monthly Source Supply and a Quarterly Destination Demand and now we have a downward confirmation in Weekly with a Supply fomed which also has a Deviation from the EMA which indicates a very strong imbalance in the Price Action.

EURCAD BUY PROJECTION 10.02.24Reason Behind EURCAD Bullish
1.Double Bullish Spinning
2.Obey Golden Ratio @ 0.618
🔹FX SIGNAL
EURCAD BUY 1.4500
SL 1.4440
TP 1.4640
TP 1.4700

EURCADGreetings!
Welcome traders.
By choosing to "Follow", you can stay updated with the latest information promptly. Kindly consider clicking "Boost" as well.
Wishing you a pleasant day.


Possible long in EUR/CADThe pair is bouncing from the support. This is a key pivot level which has been tested several times in the past. The momentum oscillators are also showing a slight positive divergence. Longs have a clear risk management below the support level and we can see a substantial rally from this level.

EURCADFX:EURCAD
As you can see that (For MONDAY 17-07-2023), EURCAD has created Double top pattern in 15Min Time frame at the important resistance level. If it breaks the drawn neckline, we can go for sell side and capture some pips. Always go for retest entry to avoid fake Breakouts. Plan your trade accordingly....

Long EUR/CADAfter the breakout from the rectangle on the hourly charts the pair is now testing the support. Stops will be below the range or in this case in the middle of the range. Instead of using the target here we can just use the moving average to ride the trend for as long as possible on the hourly time frame. One can also use the ichimoku for the same

EURCADFX:EURCAD
As you can see that, EURCAD has formed Flag and pole pattern, and it is going to give a 3 touch point horizontal breakout. If the candle closes properly without wick in 5 min or in 15 min we can plan for buy side. Take retest entries.. Plan your trade accordingly...

Price ActionEURAUD has been on a bearish trend for some time now, we are witnessing a retest on our resistance and I am expecting a strong bearish trend continuation. Wish you all a successful trading session. Lets Download Success.

EURCAD. The EURCAD pair has been on a strong uptrend since the beginning of the year, but has recently broken out of a rising wedge pattern. This suggests that the pair may be starting to move lower and could be a good opportunity for a short position. The pair is also currently retracing 78% of its previous move, suggesting that the uptrend could be coming to an end. With this in mind, traders may want to consider entering a short position on EURCAD.

