EURJPY SHOWING A GOOD DOWN MOVE WITH 1:8 RISK REWARDEURJPY SHOWING A GOOD DOWN MOVE WITH 1:8 RISK REWARD
DUE TO THESE REASON
A. its following a rectangle pattern that stocked the market
which preventing the market to move any one direction now it trying to break the strong resistant lable
B. after the break of this rectangle it will boost the market potential for break
C. also its resisting from a strong neckline the neckline also got weeker ald the price is ready to break in the outer region
all of these reason are indicating the same thing its ready for breakout BREAKOUT trading are follws good risk reward
please dont use more than one percentage of your capitalfollow risk reward and tradeing rules
that will help you to to become a bettertrader
thank you
Eurjpyanalysis

EURJPY - FALSE BREAKOUT HIGHLIGHTS RANGE-BOUND CONDITIONSSymbol - EURJPY
The EURJPY currency pair is currently testing the upper boundary of its established trading range, indicative of a potential distribution phase. However, this attempt has culminated in a false breakout, with the price subsequently consolidating within the horizontal channel.
Amid a weakening US dollar, the Japanese yen is exhibiting relative strength, exerting downward pressure on the EURJPY pair. Following a retest of the lower boundary of the range, the pair staged a false breakout above resistance, only to retreat back within the channel. This price action suggests a continuation of the distribution pattern, with resistance proving resilient.
Currently, a base appears to be forming near the 163.20 level, which serves as a key support and potential trigger level. A sustained breakdown below this threshold, coupled with consolidation beneath it, may reinforce bearish momentum and pave the way for further downside movement.
Key Resistance Levels: 163.40, 163.60
Key Support Levels: 163.20 (Sell trigger), 162.70
A decisive breach and stabilization below the 163.20 support level could act as a catalyst for an accelerated decline in the pair.

EUR/JPY Long Setup – Bullish Reversal from Key Support ZoneEntry Point: 162.227
Stop Loss: 161.629
Take Profit (Target): 166.778
Current Price: ~162.798
Risk/Reward Ratio:
Risk: ~60 pips
Reward: ~455 pips
Risk/Reward ≈ 1:7.6 (strong setup)
🔍 Technical Insights
Support Zone:
The purple rectangle around 162.227 to 162.000 is identified as a key demand zone or support area.
Price has tested this zone previously and appears to be bouncing off it.
Price Structure:
The pattern suggests a potential double-bottom or reversal structure forming.
A rounded recovery projection is drawn, implying bullish momentum is expected.
Moving Averages:
A red (shorter period) moving average is crossing below the price.
A blue (longer period) moving average near the support zone could act as dynamic support.
Target Area:
166.778 marks a clear resistance or prior high and is labeled as the “EA Target Point”.
This is a logical profit-taking zone based on past price action.
✅ Bullish Trade Bias Justification
Strong support reaction near entry.
Favorable risk/reward ratio.
Reversal pattern potential.
Confluence with moving average support.
⚠️ Considerations
Ensure confirmation from a bullish candle or reversal signal before entry.
Be mindful of macroeconomic events or EUR/JPY fundamentals that might impact volatility.

EURJPY - BREAKOUT ALERT - BULLS EYE HIGHER GROUNDSymbol - EURJPY
CMP - 164.15
The EURJPY currency pair is advancing, supported by a strengthening US dollar and encouraging developments regarding the de-escalation of US-China trade tensions. This upward momentum has brought the pair to test the upper boundary of its recent trading range.
Currently, the pair appears to be in the process of retesting a key resistance zone. A decisive breakout and sustained consolidation above the 164.19 - 164.50 range would reinforce the bullish outlook, particularly given the dollar's continued appreciation. The Japanese yen, in turn, is weakening in response to the improving geopolitical climate, further contributing to upward pressure on EURJPY.
A confirmed move above this critical resistance level would indicate the completion of the consolidation phase and could initiate a distribution phase toward higher price targets.
Key Resistance Levels: 164.19, 166.70
Key Support Levels: 163.15, 162.38
The price action has already entered the anticipated buying zone, suggesting a potential breach of resistance. Confirmation through consolidation above the 164.19 - 164.50 range would signal renewed bullish momentum, potentially paving the way for an advance toward the 166.70 level.

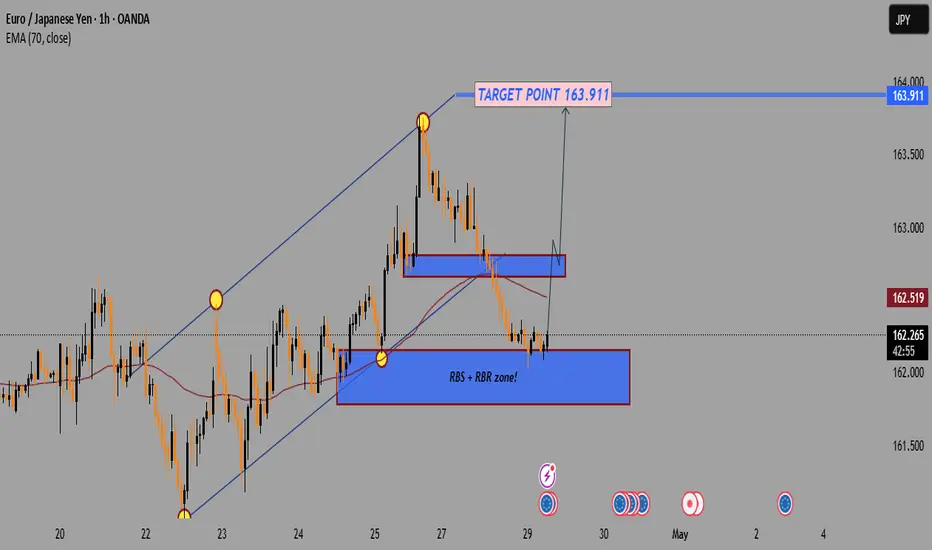
EUR/JPY 1H Chart Analysis –Bullish Rebound from Key Support Zone🔵 Trend & Structure:
⏫ Uptrend Channel (now broken)
The price was moving in a rising channel.
❌ Breakdown from the channel shows loss of bullish momentum.
🟦 Key Zones:
🔷 RBS + RBR Zone (Strong Support)
🔽 Price is currently sitting on this zone.
📍Potential bounce area → watching for bullish reaction.
🟥 Resistance Zone (Short-term hurdle)
🔺 Might be retested before moving higher.
📘 Target Point: 163.911
🎯 Bullish move expected if price confirms bounce.
📈 Potential target marked with a clear label.
📉 EMA 70 (Red Line):
➖ Acting as resistance near 162.518
⚠️ Price must close above this level for stronger bullish confirmation.
📌 Summary:
✅ Buy Zone: 162.000 – 162.200 (RBS + RBR)
🔁 Retest Zone: ~162.500
🎯 Target: 163.911
⚠️ Watch for Rejection below EMA or resistance zone.
EUR/JPY Short Setup – Bearish Reversal Targeting 161.134 with TiEMA 30 (red): Currently at 162.470
EMA 200 (blue): Currently at 162.071
Trade Setup:
Entry Point: Around 162.978
Stop Loss: Slightly above 163.016 (highlighted in purple zone)
Target (Take Profit): 161.134 (labeled as “EA TARGET POINT”)
Analysis:
Trend: The pair has been trending upwards recently, as shown by the price staying above the 200 EMA.
Current Price: 162.604, just below the proposed entry.
Risk/Reward:
Risk: ~3.8 pips (entry to stop loss)
Reward: ~184.4 pips (entry to target)
This implies a favora

EUR/JPY Bullish Reversal Setup – Entry, Stop Loss & Target StratEMA (30) - Red Line (160.596): Short-term trend.
EMA (200) - Blue Line (161.267): Long-term trend, currently above the 30 EMA indicating a bearish macro trend.
2. Entry Zone:
Marked in purple between 159.751 and 160.161, suggesting a buy (long) opportunity if price retests this demand/support zone.
3. Stop Loss:
Set just below the entry zone at 158.907, protecting against deeper bearish momentum.
4. Target Zone:
163.025 is the profit target, with a purple rectangle showing a resistance/supply zone around that level.
5. Price Action:
The price is currently consolidating near the ent

EURJPY - FALSE BREAKOUT SETS THE STAGE FOR A POTENTIAL DROPSymbol - EURJPY
CMP - 161.95
EURJPY is currently exhibiting a false breakdown of resistance, which signals the formation of a reversal pattern near the upper boundary of the descending price channel. Additionally, market pressure, influenced by the correction of the U.S. dollar, is contributing to this development.
On the daily chart, the overall structure appears bearish. Following the false breakout of the major resistance, a correction is underway, during which the price may test the imbalance zone or the previously broken resistance before continuing its decline after liquidity is captured. The broader trend remains neutral, and in this context, it is prudent to focus on local support levels as potential targets.
Resistance levels: Channel boundary, 162.30, 163.00
Support levels: 160.84, 158.90
A retest of the channel resistance or the range between 162.4 and 163.0 is possible. However, any movement of the price below the resistance of the descending channel, coupled with a consolidation in the selling zone, could trigger further downside movement.

EURJPY - CONSOLIDATING AT KEY SUPPORT WITH BULLISH POTENTIALSymbol - EURJPY
CMP - 156.50
EURJPY continues to consolidate near an important support zone. The support level marked on the chart has acted as a solid base for price action, offering stability to the currency pair and providing key support for the consolidation.
At the current market price, EURJPY presents a good opportunity for traders looking to enter long positions. The price is well-positioned for potential upward movement, making it an ideal entry point for those anticipating a bullish trend. Moreover, the ongoing downtrend in the US dollar is likely to provide additional support for the Euro, further reinforcing the bullish potential for the pair.
However, it is essential to keep an eye on price action near support zone. A breakdown below 154.80 area could signal increased selling pressure, and a sustained move below the 154.50 level would confirm a shift from a bullish to a bearish market structure. In such a scenario, a retest of the breakdown zone could provide a viable opportunity for short positions.
On the other hand, if EURJPY maintains its recovery, we could see a push toward the 158 and 160.85 levels, which represent significant resistance areas. A successful breakout above 161.00 levels would confirm trend reversal and potentially signal further upward momentum.
Key Resistance Levels: 158.00, 160.85
Key Support Levels: 156.00, 155.20

EURJPY - TRADING AT DEMAND ZONESymbol - EURJPY
EURJPY is currently trading within a important support zone. This level has acted as a solid base for price action, offering stability to the currency pair and providing key support for the ongoing trend.
At current market price (CMP 156.50), EURJPY presents a promising opportunity to initiate long positions. The current price level aligns well for potential upward movement, making it a favorable entry point for traders looking to take advantage of the prevailing trend.
However, it is crucial to monitor certain levels for any signs of trend reversal. A breakdown below the 155.25 area could trigger additional selling pressure, and a sustained move below 155.00 would confirm a shift from a bullish to a bearish market structure. In such a case, a retest of the breakdown zone could offer a good opportunity for short positions.
Conversely, if EURJPY continues to recover, we could see a push toward the 158.67 and 160.85 levels, which represent key resistance areas. A successful breakout above these levels would likely signal the continuation of the bullish trend, suggesting further upward momentum.
Key Resistance Levels: 158.70, 159.90, 160.85
Key Support Levels: 156.00, 155.25

EURJPY - 1 HOUR TMF- BULLISH TREND 350++ pips Hi all,
Smart money concept - bullish choch trend
Buy 158.500
Target 161.600++

EURJPY Longs Idea.1. This trade is based on pure price action, order flow and Candlestick analysis.
2. Same thing again and again, Rinse and repeat. HTF break structure and Unmitigated areas of S and D on LTF

EURJPY SHOWING A GOOD UP MOVE WITH 1:10 RISK REWARDEURJPY SHOWING A GOOD UP MOVE WITH 1:10 RISK REWARD
DUE TO THESE REASON
A. its following a rectangle pattern that stocked the market
which preventing the market to move any one direction now it trying to break the strong resistant lable
B. after the break of this rectangle it will boost the market potential for break
C. also its resisting from a strong neckline the neckline also got weeker ald the price is ready to break in the outer region
all of these reason are indicating the same thing its ready for breakout BREAKOUT trading are follws good risk reward
please dont use more than one percentage of your capitalfollow risk reward and tradeing rules
that will help you to to become a bettertrader
thank you

EURJPY SHOWING A GOOD UPWARDMOVE WITH 1:10 RISK REWARD EURJPY SHOWING A GOOD UPWARD MOVE WITH 1:10 RISK REWARD
DUE TO THESE REASON
A. its following a rectangle pattern that stocked the market
which preventing the market to move any one direction now it trying to break the strong resistant lable
B. after the break of this rectangle it will boost the market potential for break
C. also its resisting from a strong neckline the neckline also got weeker ald the price is ready to break in the outer region
all of these reason are indicating the same thing its ready for breakout BREAKOUT trading are follws good risk reward
please dont use more than one percentage of your capitalfollow risk reward and tradeing rules
that will help you to to become a bettertrader
thank you

EURJPYSHOING A GOOD UP MOVE WITH 1:10 RISK REWARDEURJPYSHOING A GOOD UP MOVE WITH 1:10 RISK REWARD
DUE TO THESE REASON
A. its following a rectangle pattern that stocked the market
which preventing the market to move any one direction
niw it trying to break the strong resistant lable
B. after the break of this rectangle it will bost the market potential for break
C. also its resisting from a strong neckline the neckline also got weeker ald the price is ready to break in the outer region
all of these reason are indicating the same thing its ready for breakout
BREAKOUT trading are follws good risk reward
please dont use more than one percentage of your capital
follow risk reward and tradeing rules
that will help you to to become a better trader
thank you
DUE TO THESE REASON
A. its following a rectangle pattern that stocked the market
which preventing the market to move any one direction
niw it trying to break the strong resistant lable
B. after the break of this rectangle it will bost the market potential for break
C. also its resisting from a strong neckline the neckline also got weeker ald the price is ready to break in the outer region
all of these reason are indicating the same thing its ready for breakout
BREAKOUT trading are follws good risk reward
please dont use more than one percentage of your capital
follow risk reward and tradeing rules
that will help you to to become a better trad

EURJPY SHOING A GOOD UP MOVE WITH 1:10 RISK REWARD EURJPYSHOING A GOOD UP MOVE WITH 1:10 RISK REWARD
DUE TO THESE REASON
A. its following a rectangle pattern that stocked the market
which preventing the market to move any one direction
niw it trying to break the strong resistant lable
B. after the break of this rectangle it will bost the market potential for break
C. also its resisting from a strong neckline the neckline also got weeker ald the price is ready to break in the outer region
all of these reason are indicating the same thing its ready for breakout
BREAKOUT trading are follws good risk reward
please dont use more than one percentage of your capital
follow risk reward and tradeing rules
that will help you to to become a better trader
thank you
DUE TO THESE REASON
A. its following a rectangle pattern that stocked the market
which preventing the market to move any one direction
niw it trying to break the strong resistant lable
B. after the break of this rectangle it will bost the market potential for break
C. also its resisting from a strong neckline the neckline also got weeker ald the price is ready to break in the outer region
all of these reason are indicating the same thing its ready for breakout
BREAKOUT trading are follws good risk reward
please dont use more than one percentage of your capital
follow risk reward and tradeing rules
that will help you to to become a better trader
thank you

EURJPY | 30th November trading setupHey Guys Nova This side,
As per the supply and demand zone EURJPY will go bit lower low until it reverse.
So made a trading setup for the same make sure to take less risk as much as possible.

EURJPYFX:EURJPY
As you can see that, EURJPY has crated a Inverted Head and Shoulder Pattern in 1Hr Time Frame and Retest also happening, Take entry at buy side if the high of the candle is breached. Plan your trade accordingly....

EUR/JPY SELLING OPPORTUNITYAs you can see EUR/JPY is and downtrend on 30 min tf . Its going back to its previous supply zone and we can take a short entry .


EURJPY ANALYSIS OVER H4 CHART.EURJPY Is currently taking a reverse backa and looking for short term buying opportunities in it as there is a strong support at 140.010.

EURJPY | Good Buy Opportunity. Hurry Up!When it comes to the technical analysis of EURJPY , you might get an impulse to the upside. Based on my technical analysis , there aren't many supports till the Target 1. So you may use this as a buy opportunity. If you are going in, better find a pullback. I have marked a good entry area on the chart; you may use it as an entry area. And also don't forget to place the stop just below the entry area.
What do you think is more likely to happen? Please share your thoughts in comment section. And also give a thumbs up if you find this idea helpful. Any feedback & suggestions would help in further improving the analysis.
If you find this technical analysis useful, please like & share our ideas with the community.
Good Luck!
Disclaimer!
This post does not provide financial advice. It is for educational purposes only! You can use the information from the post to make your own trading plan for the market. But you must do your own research and use it as the priority. Trading is risky, and it is not suitable for everyone. Only you can be responsible for your trading.
