EUR/JPY 1H Chart Analysis –Bullish Rebound from Key Support Zone🔵 Trend & Structure:
⏫ Uptrend Channel (now broken)
The price was moving in a rising channel.
❌ Breakdown from the channel shows loss of bullish momentum.
🟦 Key Zones:
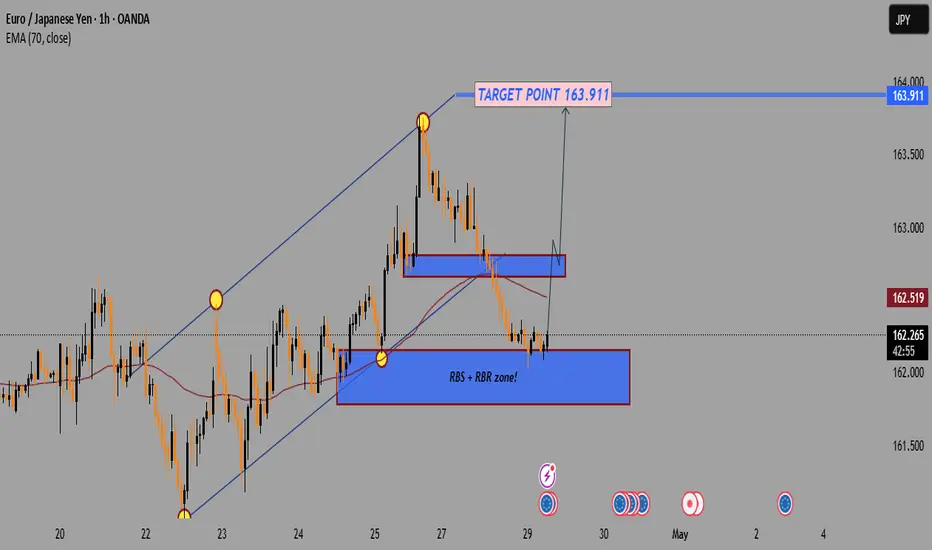
🔷 RBS + RBR Zone (Strong Support)
🔽 Price is currently sitting on this zone.
📍Potential bounce area → watching for bullish reaction.
🟥 Resistance Zone (Short-term hurdle)
🔺 Might be retested before moving higher.
📘 Target Point: 163.911
🎯 Bullish move expected if price confirms bounce.
📈 Potential target marked with a clear label.
📉 EMA 70 (Red Line):
➖ Acting as resistance near 162.518
⚠️ Price must close above this level for stronger bullish confirmation.
📌 Summary:
✅ Buy Zone: 162.000 – 162.200 (RBS + RBR)
🔁 Retest Zone: ~162.500
🎯 Target: 163.911
⚠️ Watch for Rejection below EMA or resistance zone.
Eurjpybuy
EUR/JPY Bullish Reversal Setup – Entry, Stop Loss & Target StratEMA (30) - Red Line (160.596): Short-term trend.
EMA (200) - Blue Line (161.267): Long-term trend, currently above the 30 EMA indicating a bearish macro trend.
2. Entry Zone:
Marked in purple between 159.751 and 160.161, suggesting a buy (long) opportunity if price retests this demand/support zone.
3. Stop Loss:
Set just below the entry zone at 158.907, protecting against deeper bearish momentum.
4. Target Zone:
163.025 is the profit target, with a purple rectangle showing a resistance/supply zone around that level.
5. Price Action:
The price is currently consolidating near the ent

EURJPY - 1 HOUR TMF- BULLISH TREND 350++ pips Hi all,
Smart money concept - bullish choch trend
Buy 158.500
Target 161.600++

EURJPYFX:EURJPY
As you can see that, EURJPY has crated a Inverted Head and Shoulder Pattern in 1Hr Time Frame and Retest also happening, Take entry at buy side if the high of the candle is breached. Plan your trade accordingly....


