EURNZD Potential Breakout or Reversal? | Technical Analysis EURNZD Potential Breakout or Reversal? | Technical Analysis 🚀🔄
The chart illustrates a key technical setup on the EURNZD pair with both bullish and bearish possibilities depending on price action near critical zones.
🔍 Technical Highlights:
Bearish Harmonic Pattern Completed 📉
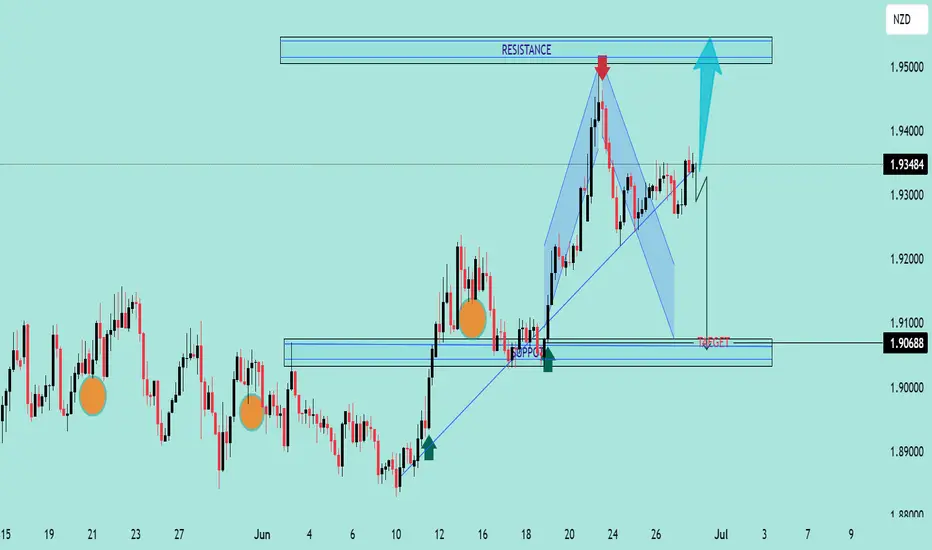
A harmonic structure has formed and completed near the resistance zone (~1.9500), triggering a bearish move towards the target at 1.90688.
Major Resistance Zone 🔺
Marked between 1.9450 - 1.9500, where previous price action showed strong rejection (highlighted by the red arrow). This remains the key zone to break for further upside.
Support & Breakout Zone 🟦
The price bounced off the support zone around 1.9068 - 1.9100, aligning with trendline support and a previous structure level. This zone also aligns with the target of the bearish harmonic move.
Trendline Retest & Bullish Continuation Possibility 🔼
The price broke above the bearish leg and is now consolidating. If price closes above 1.9350-1.9400, a potential breakout toward the 1.9500 resistance zone is expected (blue arrow).
🔄 Scenarios to Watch:
✅ Bullish Case:
Break and hold above 1.9400
Target: 1.9500 Resistance Zone
Confirmation: Strong bullish candles with volume above current range
❌ Bearish Case:
Rejection at current level (near 1.9350-1.9400)
Target: 1.9068, the harmonic completion target and support zone
Confirmation: Bearish engulfing/rejection candle with trendline break
📌 Conclusion:
EURNZD is at a crucial decision point. Watch closely for a breakout above or rejection from the current price range to determine whether the pair will retest highs or complete the bearish target move.
Eurnzdanalysis
EURNZD at Key Decision Zone | Breakout or Breakdown? 📊 Pair: EURNZD
🕒 Timeframe: Likely H1 or H4
📅 Date: May 18, 2025
🔍 Technical Analysis
🔁 Key Zones
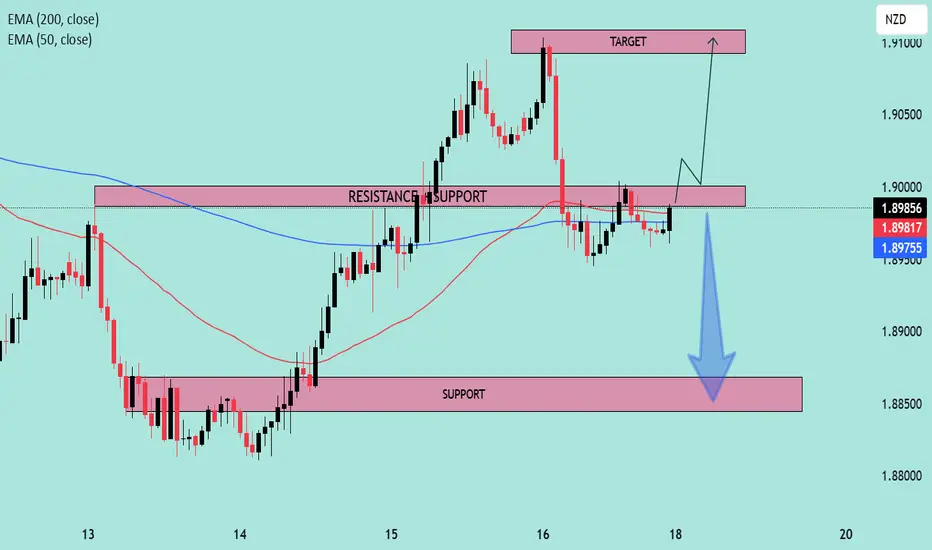
🔴 Resistance-Turned-Support (RTS):
1.8975 – 1.8990
This area was previously a resistance level that price broke above, and is now acting as a critical support zone (flip zone). Price is currently retesting this area.
🎯 Target Zone (Resistance):
1.9085 – 1.9110
This is the next projected bullish target if price successfully rebounds from current support.
🛑 Major Support Zone:
1.8840 – 1.8860
Strong buying interest was seen here previously, acting as a safety net in case of bearish rejection from the current level.
🔄 EMA Confluence
📘 EMA 200 (Blue): 1.8975
📕 EMA 50 (Red): 1.8981
Price is hovering around the EMAs, indicating a moment of decision. A decisive move above these EMAs could trigger bullish momentum. 📈
🔮 Scenario Outlook
🟢 Bullish Scenario (Preferred Setup)
✅ Confirmation above 1.8990
➡️ Retest and continuation could push price toward the 1.9100 target zone.
🔼 Momentum supported by prior breakout and higher lows.
📌 Entry Idea: Above 1.8995
🎯 Target: 1.9100
🛡️ Stop: Below 1.8950
🔴 Bearish Scenario
❌ If price fails to hold the 1.8970–1.8990 zone, a breakdown could follow.
⬇️ Likely move toward 1.8850 support zone.
🚨 Watch for bearish engulfing or rejection candles near resistance.
🧠 Summary
Price is at a key decision point.
✅ Bullish bias is slightly stronger due to market structure (higher highs & higher lows).
⚠️ But a clean break below support would shift focus to the downside.
📈 Strategy: Wait for confirmation ⚖️
Bullish: Break + retest of 1.8990
Bearish: Breakdown below 1.8950 and close under EMAs
EURNZD SHOWING HEAD AND SHOULDER PATTERN WITH 1:5 RISK REWARD EURNZD SHOWING A GOOD DOWN MOVE WITH 1:5 RISK REWARD
DUE TO THESE REASON
A. its following a rectangle pattern that stocked the market
which preventing the market to move any one direction now it trying to break the strong resistant lable
B. after the break of this rectangle it will boost the market potential for break
C. also its resisting from a strong neckline the neckline also got weeker ald the price is ready to break in the outer region
all of these reason are indicating the same thing its ready for breakout BREAKOUT trading are follws good risk reward
please dont use more than one percentage of your capitalfollow risk reward and tradeing rules
that will help you to to become a bettertrader
thank you

EURNZD SHOWING A GOOD FALL IN 1DAY CHATHere you can see that EURNZD BREAKED the stuck zone
Plus the the trendline also
Plus the strong support
If you are a long-term seller
You can grab it with a good amount without any risk stay tention free because it's a SURESHOOT
There are 3 confirmation
1. Stock zone
2. Trendline
3. Support
There are a huge possibility it will fall a lot
Just grab it
It's Rarely trade found in currency
Grab it
Follows for more

Reaching at 1.84600EURNZD is looking for long opportunity after forming descending channel and has clear formation for the movement to the upside.

EURNZD 4HThis pair has been trading in the range since past few days, also we can see the bearish impulsive move on the left which was caused in the zone of 1.80178. we can open a short position keeping the SL at 1.80653 and target 1.78516, achieving 1:2 RR

EURNZDEURNZD, looks good for sell. Analyze the chart and trade accordingly. Make a handsome profit. for details DM

EUR/NZD - Short ( Double Top )Pattern Spotted - Double Top
Entry - 1.60260
StopLoss - 1.60441
TakeProfit - 1.59351


EURNZD 4HR SUPPORT ZONE BROKENEURNZD 4HR ..Supoort zone broken which it was touched for three times..
Now the pair was retesting....Wait for Confirmation and then
GO SHORT.....
Take profit @ 1.67000

EURNZDUpside Trend (Downside Trend zone Breakout)
TG1 = 1.70305
TG2 = 1.70465
TG3 = 1.70682
TG4 = 1.70963
Stoploss = 1.69652

EURNZD Top-Down AnalysisHello Traders,
Here is the Top-Down Analysis of EURNZD (Monthly, Weekly, Daily for direction and 4H for entry) for
Week 44 - 26 Oct
M > Market is moving in a rising channel. Price tested monthly support, faced rejection and started upward move.
W > Price has faced rejection at support of channel and is
D > After rejection at weekly demand zone and creating double bottom price is moving in a rising channel. We saw an M formation and as expected price moved up to test its neck and complete the formation. Price faced rejection at channel support. We can expect price to continue with upward move till resistance of channel that can coincide with monthly resistance level.
As per COT EUR saw addition of few Long and more Short, reducing net positions further. EXY was weaker during the said week however it gained back its strength last week. Institutions, since last month, reducing their portfolio of Long and increasing Long positions, with total 32K Long positions closed and 13.5K short positions opened. NZD saw closure of both Long and Short positions further improving net positions, whereas ZXY was weak during the said week but it gained strength last week. ZXY has been gaining strength slowly since June 2020.
In short term we can expect price to rise up but a bearish reversal can be expected from monthly resistance level.
4H > Price has faced rejection at support of channel and is now testing 4H supply zone. We can see an inverted H & S pattern under formation and price should continue moving upwards.
Pair Correlation > EURNZD has positive correlation with GBPNZD and negative correlation with NZDCHF, NZDCAD and NZDUSD.
This was my Idea and I hope you find it useful. If you find the analysis of help please leave a LIKE and FOLLOW for receiving all updates during the week. In the comment section share your view or ask questions.
Thank You
AP17FX


EURNZD BUY ~ 1.64900, TAREGT- 1.67000, SL- 1.63700
Save your time on analyzing the market, Start to Learn, Trade Forex market in a technical ways with the help of Forex Experts team.
Don’t Trade Forex market all the time, trade Forex only at good opportunities available in the market.
