EURNZD Potential Breakout or Reversal? | Technical Analysis EURNZD Potential Breakout or Reversal? | Technical Analysis 🚀🔄
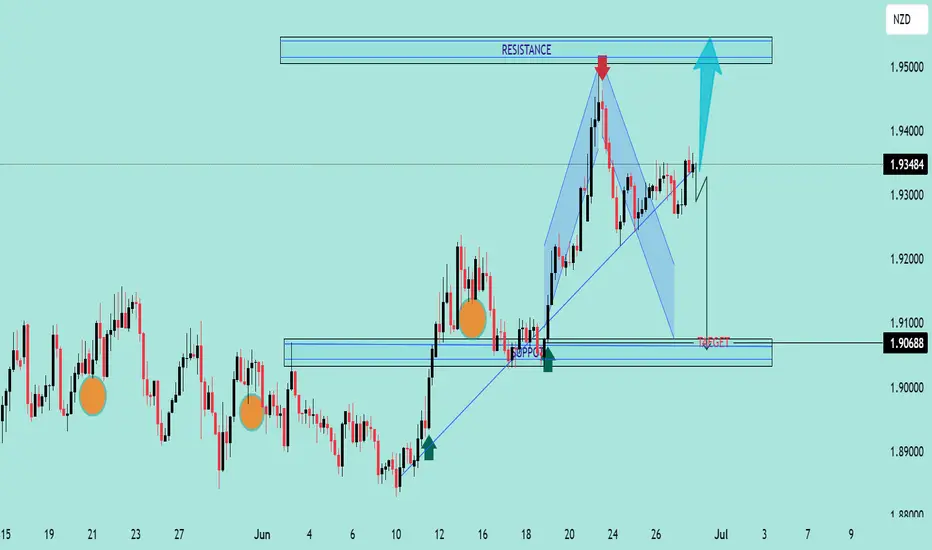
The chart illustrates a key technical setup on the EURNZD pair with both bullish and bearish possibilities depending on price action near critical zones.
🔍 Technical Highlights:
Bearish Harmonic Pattern Completed 📉
A harmonic structure has formed and completed near the resistance zone (~1.9500), triggering a bearish move towards the target at 1.90688.
Major Resistance Zone 🔺
Marked between 1.9450 - 1.9500, where previous price action showed strong rejection (highlighted by the red arrow). This remains the key zone to break for further upside.
Support & Breakout Zone 🟦
The price bounced off the support zone around 1.9068 - 1.9100, aligning with trendline support and a previous structure level. This zone also aligns with the target of the bearish harmonic move.
Trendline Retest & Bullish Continuation Possibility 🔼
The price broke above the bearish leg and is now consolidating. If price closes above 1.9350-1.9400, a potential breakout toward the 1.9500 resistance zone is expected (blue arrow).
🔄 Scenarios to Watch:
✅ Bullish Case:
Break and hold above 1.9400
Target: 1.9500 Resistance Zone
Confirmation: Strong bullish candles with volume above current range
❌ Bearish Case:
Rejection at current level (near 1.9350-1.9400)
Target: 1.9068, the harmonic completion target and support zone
Confirmation: Bearish engulfing/rejection candle with trendline break
📌 Conclusion:
EURNZD is at a crucial decision point. Watch closely for a breakout above or rejection from the current price range to determine whether the pair will retest highs or complete the bearish target move.
Eurnzdbuy
💡Don't miss the great buy opportunity in EURNZDTrading suggestion:
". There is a possibility of temporary retracement to the suggested support line (1.6201).
. if so, traders can set orders based on Price Action and expect to reach short-term targets."
Technical analysis:
. EURNZD is in a range bound, and the beginning of an uptrend is expected.
. The price is above the 21-Day WEMA, which acts as a dynamic support.
. The RSI is at 57.
Take Profits:
TP1= @ 1.6350
TP2= @ 1.6525
TP3= @ 1.6643
TP4= @ 1.6759
TP5= @ 1.6851
SL= Break below S2
❤️ If you find this helpful and want more FREE forecasts in TradingView
. . . . . Please show your support back,
. . . . . . . . Hit the 👍 LIKE button,
. . . . . . . . . . Drop some feedback below in the comment!
❤️ Your support is very much 🙏 appreciated! ❤️
💎 Want us to help you become a better Forex / Crypto trader ?
Now, It's your turn !
Be sure to leave a comment; let us know how you see this opportunity and forecast.
Trade well, ❤️
ForecastCity English Support Team ❤️


EURNZD BUY ~ 1.64900, TAREGT- 1.67000, SL- 1.63700
Save your time on analyzing the market, Start to Learn, Trade Forex market in a technical ways with the help of Forex Experts team.
Don’t Trade Forex market all the time, trade Forex only at good opportunities available in the market.
