EURCAD Technical Analysis – Bearish Reversal from Resistance 📉 EURCAD Technical Analysis – Bearish Reversal from Resistance Zone
(Timeframe: Intraday – as of July 24, 2025)
🔍 Market Context
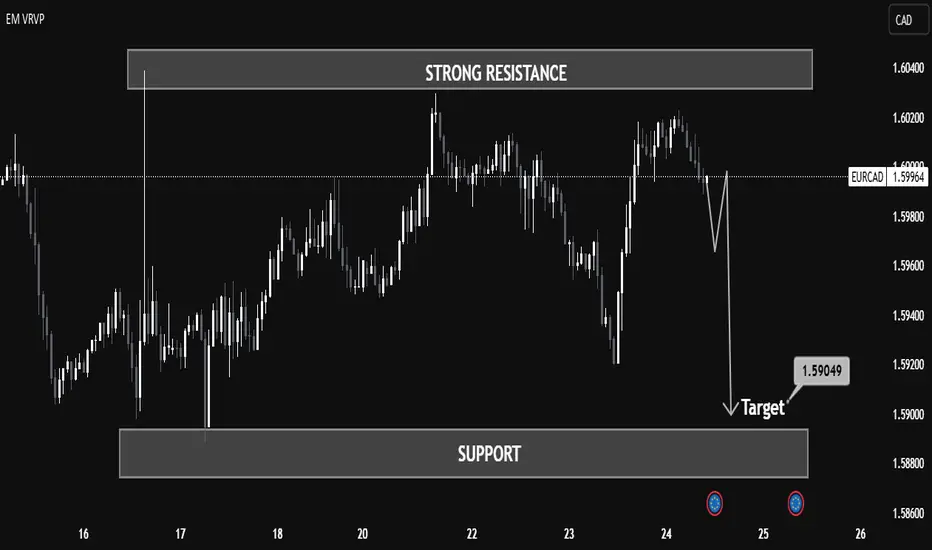
The EURCAD pair has recently tested a strong resistance zone around the 1.60200 – 1.60400 level, where it faced clear rejection, forming a sharp bearish move.
🔸 Key Technical Zones
Resistance Area: 1.60200 – 1.60400
A well-established zone that has previously rejected price. Price was unable to sustain above this level, confirming supply pressure.
Support Area: 1.58600 – 1.58800
This is a previously tested demand zone, which now acts as a key target and potential bounce area if the bearish move continues.
Target Level Marked: 1.59049
A mid-point level just above the support zone, possibly an early TP (Take Profit) area for short sellers.
🔄 Price Action
Price formed a lower high just below the resistance, indicating weakening bullish momentum.
The recent strong bearish candle confirms momentum shift to the downside.
A bearish continuation pattern appears likely, especially with the forecast path suggesting a pullback followed by a drop toward 1.59049.
📊 Volume Profile (VRVP)
Low volume acceptance between 1.59400 – 1.59000 supports the idea of fast price movement through this region — called a volume gap.
Strong volume concentration near support, indicating that buyers may become active near 1.58800 again.
🔧 Conclusion
The EURCAD pair has shown clear rejection from a major resistance zone, and the chart suggests a bearish continuation targeting the 1.59049 level and possibly lower into the support zone.
Traders may look for confirmation such as:
Pullback retest of 1.59800–1.59900
Bearish engulfing or continuation candle
Failure to break above recent highs
Risk management is crucial — invalidation would occur on a strong close above 1.60400.
📚 Educational Title Suggestion
"Resistance Rejection & Momentum Shift: EURCAD Bearish Setup Breakdown"
Eurocad
💡Don't miss the great buy opportunity in EURCAD
Trading suggestion:
". There is a possibility of temporary retracement to suggested support line (1.46934).
. if so, traders can set orders based on Price Action and expect to reach short-term targets."
Technical analysis:
. EURCAD is in a range bound and the beginning of uptrend is expected.
. The price is below the 21-Day WEMA which acts as a dynamic resistance.
. The RSI is at 59.
Take Profits:
TP1= @ 1.47855
TP2= @ 1.48397
TP3= @ 1.48955
TP4= @ 1.49463
TP5= @ 1.50572
SL= Break below S2
❤️ If you find this helpful and want more FREE forecasts in TradingView
. . . . . Please show your support back,
. . . . . . . . Hit the 👍 LIKE button,
. . . . . . . . . . Drop some feedback below in the comment!
❤️ Your Support is very much 🙏 appreciated!❤️
💎 Want us to help you become a better Forex trader?
Now, It's your turn!
Be sure to leave a comment let us know how you see this opportunity and forecast.
Trade well, ❤️
ForecastCity English Support Team ❤️

Don't miss the great sell opportunity in EURCADTrading suggestion:
. There is still a possibility of temporary retracement to suggested resistance line (1.4615). if so, traders can set orders based on Price Action and expect to reach short-term targets.
Technical analysis:
. EURCAD is in a range bound and the beginning of downtrend is expected.
. The price is below the 21-Day WEMA which acts as a dynamic resistance.
. The RSI is at 40.
Take Profits:
TP1= @ 1.4533
TP2= @ 1.4438
TP3= @ 1.4050
SL: Break Above R2

A trading opportunity to buy in EURCADMidterm forecast:
While the price is above the support 1.4750, beginning of uptrend is expected.
We make sure when the resistance at 1.5285 breaks.
If the support at 1.4750 is broken, the short-term forecast -beginning of uptrend- will be invalid.
Technical analysis:
While the RSI downtrend #1 is not broken, bearish wave in price would continue.
A peak is formed in daily chart at 1.5153 on 04/16/2019, so more losses to support(s) 1.4915, 1.4820 and minimum to Major Support (1.4750) is expected.
Price is below WEMA21, if price rises more, this line can act as dynamic resistance against more gains.
Relative strength index (RSI) is 45.
Trading suggestion:
There is a possibility of temporary retracement to suggested support zone (1.4820 to 1.4750). if so, traders can set orders based on Price Action and expect to reach short-term targets.
Beginning of entry zone (1.4820)
Ending of entry zone (1.4750)
Entry signal:
Signal to enter the market occurs when the price comes to " Buy zone " then forms one of the reversal patterns, whether " Bullish Engulfing ", " Hammer " or " Valley " in other words, NO entry signal when the price comes to the zone BUT after any of reversal patterns is formed in the zone. To learn more about " Entry signal " and the special version of our " Price Action " strategy FOLLOW our lessons :
Take Profits:
TP1= @ 1.4915
TP2= @ 1.5010
TP3= @1.5115
TP4= @ 1.5195
TP5= @ 1.5285
TP6= @ 1.5360
TP7=@ 1.5450
TP8= @ 1.5640
TP9= @ 1.6150
TP10= Free

A trading opportunity to buy in EURCADMidterm forecast:
While the price is above the support 1.4750, beginning of uptrend is expected.
We make sure when the resistance at 1.5360 breaks.
If the support at 1.4750 is broken, the short-term forecast -beginning of uptrend- will be invalid.
Technical analysis:
While the RSI downtrend #1 is not broken, bearish wave in price would continue.
A trough is formed in daily chart at 1.4905 on 04/02/2019, so more gains to resistance(s) 1.5115, 1.5195, 1.5285 and maximum to Major Resistance (1.5360) is expected.
Price is above WEMA21, if price drops more, this line can act as dynamic support against more losses.
Relative strength index (RSI) is 50.
Trading suggestion:
. There is a possibility of temporary retracement to suggested support zone (1.4820 to 1.4860). if so, traders can set orders based on Price Action and expect to reach short-term targets.
Beginning of entry zone (1.4820)
Ending of entry zone (1.4860)
Entry signal:
Signal to enter the market occurs when the price comes to " Buy zone " then forms one of the reversal patterns, whether " Bullish Engulfing ", " Hammer " or " Valley " in other words, NO entry signal when the price comes to the zone BUT after any of reversal patterns is formed in the zone. To learn more about " Entry signal " and the special version of our " Price Action " strategy FOLLOW our lessons :
Take Profit:
TP1= @ 1.4915
TP2= @ 1.5010
TP3= @1.5115
TP4= @ 1.5195
TP5= @ 1.5285
TP6= @ 1.5360
TP7=@ 1.5450
TP8= @ 1.5640
TP9= @ 1.6150
TP10= Free

A trading opportunity to Buy in EURCADMidterm forecast:
While the price is above the support 1.4750, beginning of uptrend is expected.
We make sure when the resistance at 1.5115 breaks.
If the support at 1.4750 is broken, the short-term forecast -beginning of uptrend- will be invalid.
Technical analysis:
The RSI bounced from the resistance #1 at 48 and it prevented price from more gains.
A peak is formed in daily chart at 1.5060 on 02/14/2019, so more losses to support(s) 1.4820 and minimum to Major Support (1.4750) is expected.
Price is below WEMA21, if price rises more, this line can act as dynamic resistance against more gains.
Relative strength index (RSI) is 41.
Trading suggestion:
There is possibility of temporary retracement to suggested Buy Zone (1.4820 to 1.4750). We wait during the retracement, until the price tests the zone, whether approaching, touching or entering the zone.
We would set buy orders based on Daily-Trading-Opportunities and expect to reach short-term targets.
Beginning of entry zone (1.4820)
Ending of entry zone (1.4750)
Entry signal:
Signal to enter the market occurs when the price comes to " Buy zone " then forms one of the reversal patterns, whether " Bullish Engulfing ", " Hammer " or " Valley " in other words, NO entry signal when the price comes to the zone BUT after any of reversal patterns is formed in the zone. To learn more about " Entry signal " and the special version of our " Price Action " strategy FOLLOW our lessons :
Take Profits:
TP1 = @1.4915
TP2 = @1.5010
TP3 = @1.5115
TP4 = @1.5285
TP5 = @1.5450
TP6 = @1.5640
TP7 = @1.6150
TP8 = Free
