EUR/USD Potential Rejection from ResistanceTechnical Overview:
The EUR/USD chart exhibits signs of a bearish reversal pattern forming near a key resistance zone (1.15800 - 1.16000), highlighted with repeated rejection wicks (🔴 red arrows). Price is currently trading at 1.15222, after failing to hold above the neckline of the rounded bottom pattern.
🔍 Key Observations:
🔺 Resistance Zone: Strong resistance has been confirmed multiple times (red arrows), indicating sellers are active at the top.
🟠 Double Top / Head & Shoulders Behavior: Price action shows topping formations (highlighted with orange circles), suggesting exhaustion of bullish momentum.
📉 Bearish Breakdown Possibility:
Price rejected near neckline and is showing bearish candle formations.
Breakdown from the current consolidation zone could push price toward the target zone at 1.14491, marked in purple.
This aligns with previous support structure, reinforcing a technical downside projection.
🔻 Support Zone: Around 1.13800 - 1.14000 is a strong area of demand and may act as the next bounce point if the bearish move continues.
📐 Chart Pattern Structure:
Rounded bottom formed earlier, but the failure to continue higher and breakout suggests a false breakout trap for buyers.
Downward sloping trendline broke, but now price is struggling to sustain above previous highs.
📌 Conclusion:
⚠️ Caution for bulls as price shows signs of weakness at resistance. A move below 1.15000 may initiate further downside toward 1.14491 and possibly lower. Short-term traders can watch for confirmation candles near this zone for entries.
📅 Short-Term Bias: Bearish
🎯 Target: 1.14491
⛔️ Invalidation: Strong breakout above 1.16000
EUR TRY

EUR/USD Potential Reversal from Resistance Zone –Bearish OutlookThe EUR/USD pair has been trading within a well-defined ascending channel for several weeks. Price recently tested a strong resistance zone near 1.15850 – 1.16000, which aligns with the upper boundary of the channel and a previously marked supply area.
Key observations:
The price action shows signs of rejection from the resistance zone with a potential double-top or fakeout pattern forming.
A projected bearish trajectory is marked, suggesting a possible break below the channel support.
Immediate bearish targets are set at key demand zones around 1.14500, 1.12500, and further down to 1.10500.
A large red arrow indicates the strong downside bias if the price confirms the breakdown.
Conclusion:
If EUR/USD fails to sustain above the 1.15850 resistance zone and breaks below the ascending channel, a strong bearish correction is anticipated. Traders should watch for confirmation of the breakdown before entering short positions.

EUR/USD to Tackle Fed Fear and Eye $1.08 on Easing Bank CrisisIt is a relatively busy day ahead for the EUR/USD. ZEW Economic Sentiment figures for Germany and the Eurozone will draw interest today. Following the collapse of Silicon Valley Bank and Signature Bank (SBNY), economic sentiment figures are likely to weaken.
Economists forecast the German Economic Sentiment Index to fall from 28.1 to 17.1 in March, with the Eurozone Economic Sentiment Index to slide from 29.7 to 16.0.
This morning, the EUR/USD was down 0.03% to $1.07144. A mixed start to the day saw the EUR/USD rise to an early high of $1.07260 before falling to a low of $1.07096.
The EUR/USD needs to avoid the $1.0693 pivot to target the First Major Resistance Level (R1) at $1.0755. A move through the Monday high of $1.07308 would signal a bullish session. However, the EUR/USD would need hawkish ECB chatter and better-than-expected ZEW Economic Sentiment numbers to support a breakout session.
In the case of an extended rally, the bulls will likely test the Second Major Resistance Level (R2) at $1.0793 and resistance at $1.08. The Third Major Resistance Level (R3) sits at $1.0892.
A fall through the pivot would bring the First Major Support Level (S1) at $1.0655 into play. However, barring a risk-off-fueled sell-off, the EUR/USD pair should avoid sub-$1.06 and the Second Major Support Level (S2) at $1.0593. The Third Major Support Level (S3) sits at $1.0494.
Looking at the EMAs and the 4-hourly chart, the EMAs send bullish signals. The EUR/USD sits above the 50-day EMA ($1.06562). The 50-day EMA pulled away from the 200-day EMA, with the 100-day EMA converging on the 200-day EMA, delivering bullish signals.
A hold above the 50-day EMA ($1.06562) would support a breakout from R1 ($1.0755) to give the bulls a run at R2 ($1.0793) and $1.08. However, a fall through the 50-day EMA ($1.06562) would bring S1 ($1.0655) and the 200-day ($1.06533) and 100-day ($1.06517) EMAs into play. A fall through the 50-day EMA would send a bearish signal.

EURUSD MAY GO DOWNThe euro lost almost 0.7% on Thursday as better-than-expected U.S. economic data pushed the U.S. dollar higher.
Possible effects for traders
The U.S. dollar strengthened after the unemployment claims report pointed out a strong U.S. jobs market. Other data showed growing labor costs, indicating the Fed has to raise interest rates further to tame inflation. 'This move higher that you're seeing in U.S. rates is not happening in isolation. Similar developments are happening in the rest of the world, in particular in Europe, mostly notably, where the inflation data keeps on surprising relatively strong,' said Alvise Marino, the macro trading strategist at Credit Suisse. In other words, even if the Fed's policy remains hawkish, the European Central Bank will not fall behind and will continue raising the base rate.
Thus, the fundamental picture for EURUSD remains rather mixed. Today's speeches from three Fed officials after 4:00 p.m. UTC may offer some clues. The key levels for the pair to watch are 1.07000 and 1.05300.

EURUSD Forecast 01/03/2023The EUR/USD needs to move through the $1.0597 pivot to target the First Major Resistance Level (R1) at $1.0621 and the Tuesday high of $1.06453. A return to $1.06 would signal a bullish session. However, the EUR/USD would need the stats and the ECB chatter to support a breakout session.
In the case of an extended rally, the bulls will likely test the Second Major Resistance Level (R2) at $1.0670 and resistance at $1.07. The Third Major Resistance Level (R3) sits at $1.0743.
Failure to move through the pivot would leave the First Major Support Level (S1) at $1.0548 into play. However, barring a data-fueled sell-off, the EUR/USD pair should avoid sub-$1.05. The Second Major Support Level (S2) at $1.0524 should limit the downside. The Third Major Support Level (S3) sits at $1.0451.
Looking at the EMAs and the 4-hourly chart, the EMAs send a bearish signal. The EUR/USD sits below the 50-day EMA ($1.06213). The 50-day EMA slipped back from the 200-day EMA, with the 100-day EMA pulling back from the 200-day EMA, delivering bearish signals.
A move through R1 ($1.0621) and the 50-day EMA ($1.06213) would give the bulls a run at the 100-day EMA ($1.06665) and R2 ($1.0670). A move through the 50-day EMA would send a bullish signal. However, failure to move through the 50-day EMA ($1.06213) would leave the Major Support Levels in play.

Effect Of GFK Consumer Sentiment Index On EURUSDEURUSD dropped by almost 0.06% as inflation fears increased due to Fed's latest statements.
Possible effects for traders
Today, Germany will release the second assessment of Q4 GDP and the GFK Consumer Sentiment Index. Another important event is the U.S. PCE report for January. Overall, the Fed seems ready to continue further rate hikes, supporting the U.S. dollar.
The EURUSD fell due to high demand for the U.S. dollar and returned to the levels of the year's beginning. The pair remained below 1.06000 within the Asian session, opening a potential for a downside correction to 1.05200. Still, today's economic reports may push EURUSD towards 1.07000.

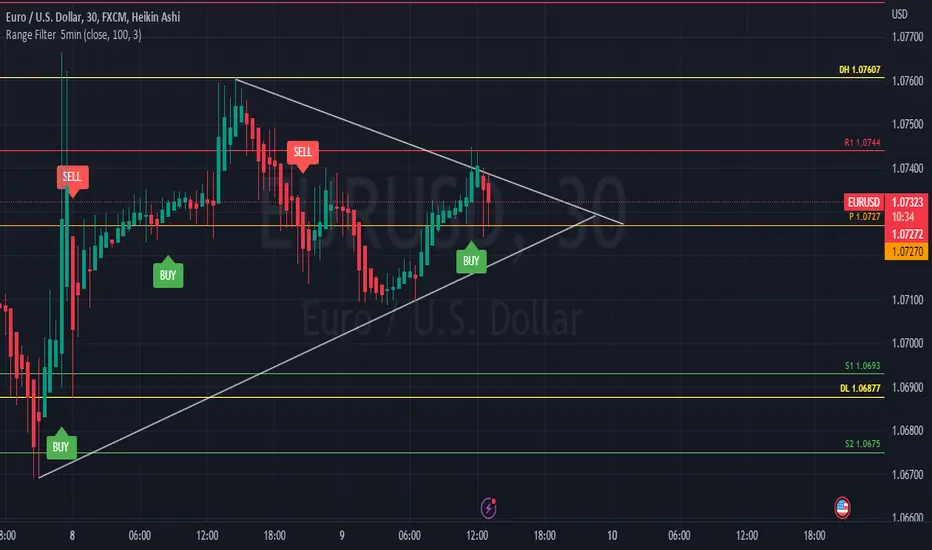
EURUSD Price Forecast 9th Feb 2023The instrument was almost rangebound yesterday and dint gave any solid trading opportunity The max solid signal it gave was for 15 to 30 pips with a tight SL. The following are some of the important levels which needs to be taken care of before opening any order for the day :-
8th Feb
DH - 1.07607
DL- 1.06877
9TH Feb.
PIVOT - 1.0727
R1 - 1.0744 , S1 - 1.0693
R2 - 1.0778, S2 - 1.0675
R3 - 1.0829, S3 - 1.0624
* If Pivot is broken on the upside then we can expect a target to 1.0744 and 1.07607
* A return to 1.0750 will send a bullish behavior
* If Pivot is broken in the downtrend then it will hit the 1.06930 level. On the other hand 1.0650 level should be avoided .
* If it reaches 1.0675 level then it means the sell off is limited.
Don't miss the great buy opportunity in EURTRYTrading suggestion:
. There is a possibility of temporary retracement to suggested support line (7.4706). if so, traders can set orders based on Price Action and expect to reach short-term targets.
Technical analysis:
. EURTRY is in a range bound and the beginning of uptrend is expected.
. The price is below the 21-Day WEMA which acts as a dynamic resistance.
. The RSI is at 71.
Take Profits:
TP1= @ 7.5998
TP2= @ 7.6507
TP3= @ 7.8517
SL= Break below S2
