EUR/USD 1-Hour Rising Channel – Support Zone & Potential Upside!Chart Breakdown & Technical Insights
Rising Channel Structure
The chart clearly shows EUR/USD trading within a rising channel, marked by higher highs (red arrows) and higher lows (green arrows) forming parallel support and resistance trendlines.
Key Support Zone & Bounce Potential
The price is currently sitting near the ascending trendline support, highlighted by the shaded gray box and emphasized with a circled area. Many analysts note that this lower boundary—around the 1.1690 level—serves as crucial support on a broader time frame
.
Short-Term Momentum Indicators
According to recent technical calls, EUR/USD maintains a short-term bullish bias in the rising channel. However, some momentum indicators, such as RSI, hint at weakening strength—particularly when higher price highs are not matched with higher RSI peaks, suggesting a bearish divergence
.
Potential Upside Trajectory
Should the lower channel support hold, the chart suggests a rebound toward mid-channel or potentially up to the upper boundary. Analysts highlight the 1.1720–1.1750 area as a near-term resistance, with the upper channel boundary closer to 1.1850
.
Alternative Scenario – Breakdown Risk
If EUR/USD breaks below the channel (below ~1.1690), the bullish structure may falter. That could expose the pair to deeper pullbacks, possibly testing lower support levels around 1.1650 or lower
.
** Summary Table**
Scenario Likely Outcome
Bounce off support Move up toward mid-channel (~1.172) or channel top (~1.185)
Breakdown below support Decline toward lower support zones (1.1650 and below)
Conclusion & Strategy Snapshot
The price is positioned at a critical support within a well-defined rising channel.
The bullish favored path: a rebound from the lower trendline toward resistance levels.
The bearish risk: a breakdown would shift momentum, possibly leading to deeper retracements.
Monitor for price action signals (e.g. bounce, candlestick patterns), RSI behavior, and behavior around these key levels.
Eurusd1hr

EUR/USD Bullish Continuation Analysis EUR/USD Bullish Continuation Analysis 🚀💶
📊 Chart Summary:
The EUR/USD pair is demonstrating a strong bullish structure with consistent higher highs and higher lows. Recent price action shows a breakout above the 1.16386 resistance level, now acting as support 🛡️. The market is currently retracing and might retest this new support zone before continuing its upward move toward the target.
🔍 Key Observations:
🔸 Bullish Structure:
Multiple bullish impulses have formed a clean staircase pattern (🔼⬆️), indicating sustained buying momentum.
🔸 Support Zone 🟦 (1.13200 - 1.14000):
This zone has been tested multiple times, confirming its strength and the base of this bullish rally.
🔸 Breakout & Retest 🟠:
Price broke above the 1.16386 resistance level, pulled back slightly (highlighted by the orange circle), and now looks ready for a potential continuation to the upside.
🔸 Target 🎯: 1.18010
A clear target has been set based on measured move or resistance projection. If the price respects the current structure, we may see a continuation toward this level.
✅ Trade Outlook:
Bias: Bullish 📈
Entry Zone: Around 1.16386 (upon bullish confirmation)
Target 🎯: 1.18010
Invalidation ❌: Break below 1.1600 with bearish momentum
🧠 Technical Tip:
Always wait for confirmation on the retest before entering. Wick rejections or bullish engulfing candles at the support zone can provide additional entry confidence. 🔍✅

EUR/USD Potential Rejection from ResistanceTechnical Overview:
The EUR/USD chart exhibits signs of a bearish reversal pattern forming near a key resistance zone (1.15800 - 1.16000), highlighted with repeated rejection wicks (🔴 red arrows). Price is currently trading at 1.15222, after failing to hold above the neckline of the rounded bottom pattern.
🔍 Key Observations:
🔺 Resistance Zone: Strong resistance has been confirmed multiple times (red arrows), indicating sellers are active at the top.
🟠 Double Top / Head & Shoulders Behavior: Price action shows topping formations (highlighted with orange circles), suggesting exhaustion of bullish momentum.
📉 Bearish Breakdown Possibility:
Price rejected near neckline and is showing bearish candle formations.
Breakdown from the current consolidation zone could push price toward the target zone at 1.14491, marked in purple.
This aligns with previous support structure, reinforcing a technical downside projection.
🔻 Support Zone: Around 1.13800 - 1.14000 is a strong area of demand and may act as the next bounce point if the bearish move continues.
📐 Chart Pattern Structure:
Rounded bottom formed earlier, but the failure to continue higher and breakout suggests a false breakout trap for buyers.
Downward sloping trendline broke, but now price is struggling to sustain above previous highs.
📌 Conclusion:
⚠️ Caution for bulls as price shows signs of weakness at resistance. A move below 1.15000 may initiate further downside toward 1.14491 and possibly lower. Short-term traders can watch for confirmation candles near this zone for entries.
📅 Short-Term Bias: Bearish
🎯 Target: 1.14491
⛔️ Invalidation: Strong breakout above 1.16000

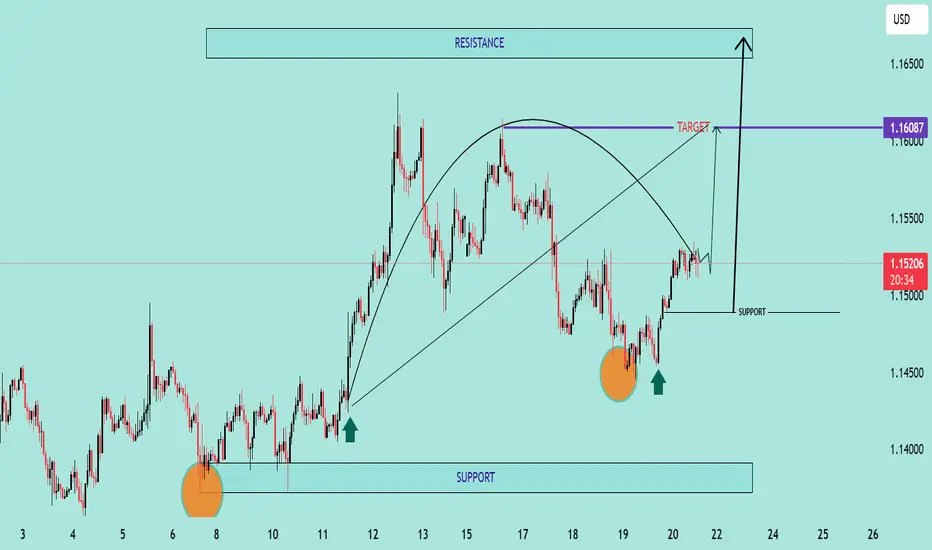
EUR/USD Bullish Reversal Breakout Pattern EUR/USD Bullish Reversal Breakout Pattern 🚀📈
📊 Technical Analysis Summary:
The chart illustrates a strong bullish reversal pattern forming on the EUR/USD pair:
🔹 Double Bottom Formation (🔶🔶):
Two clear bottom zones are marked with orange circles near the 1.14400–1.14500 area, indicating strong buying interest and support.
The second bottom confirms the double bottom pattern, often a precursor to an upward trend.
🔹 Support Zone (📉):
Firm support around 1.14450, as highlighted on the chart.
Price has respected this zone twice, bouncing back with bullish momentum each time.
🔹 Neckline Breakout (🔼):
Price is approaching the neckline zone at 1.16087, which acts as the bullish target.
A break and close above this neckline will confirm the reversal and open the way toward the resistance zone around 1.16500.
🔹 Projected Move (🎯):
If the neckline breaks, price is expected to surge towards 1.16500, aligning with the historical resistance.
This move completes the measured target projection from the double bottom structure.
🔹 Bullish Structure:
Higher lows and strong bullish candles are reinforcing the uptrend momentum.
Curved trajectory shows accumulation followed by a breakout phase.
📌 Key Levels to Watch:
Support: 1.14450 – 1.14500
Neckline/Target: 1.16087
Resistance: 1.16500
🛑 Invalidation:
A strong breakdown below support (1.14450) would invalidate this bullish setup.
✅ Conclusion:
EUR/USD is exhibiting a textbook bullish reversal setup with a potential breakout above 1.16087 likely to trigger further upside toward 1.16500. Ideal scenario for bullish entries on
EUR/USD Potential Reversal from Resistance Zone –Bearish OutlookThe EUR/USD pair has been trading within a well-defined ascending channel for several weeks. Price recently tested a strong resistance zone near 1.15850 – 1.16000, which aligns with the upper boundary of the channel and a previously marked supply area.
Key observations:
The price action shows signs of rejection from the resistance zone with a potential double-top or fakeout pattern forming.
A projected bearish trajectory is marked, suggesting a possible break below the channel support.
Immediate bearish targets are set at key demand zones around 1.14500, 1.12500, and further down to 1.10500.
A large red arrow indicates the strong downside bias if the price confirms the breakdown.
Conclusion:
If EUR/USD fails to sustain above the 1.15850 resistance zone and breaks below the ascending channel, a strong bearish correction is anticipated. Traders should watch for confirmation of the breakdown before entering short positions.

EUR/USD TRADE STEPUP :-Today Euro made it 4 months $1.04958 and also November 2023 euro made its low $ 1.04477 after multiple times tested this level.today euro made daily time frame on insider candle .if euro breaks yesterday high than much possibly euro can drive up side move to $1.06824 levels.
stay tuned with me for more updates:-

A big red candle > whats next on EurUsdwe were expecting to go long on order block of 1.0700 but price didnt retest the zone at first and whoever bought with direct limit order their stop loss was taken out but we had calculated risk of 20 pips
but if the conservative trade who waited for choc entry the entry did not triggred
.......................... thats the wrap from previous analysis ....................
currently the big bar candle will be tempting for further selling point
the reason for big red candle is because of sundden bounce on DXY index
euro had opposite reaction to the price chart
.............................................................................................
tenchnically wait for the price to make choc on 1h time frame
and from that bos we look for trade if the setup complete of higher low and higher high then
only we will look for buying side
1.06930 to 1.06300 will the area where price will hunt for liquidty pools
if the 4h candle closes below this level then only we will look for bearish side

Euro/Usd long setupcurrent bullish candles looks like pullback
we have open order block at the level of 1.07028 to 1.0981 (buy area)
resistance 1.07818 to 1.07715

Eur/Usd update (A conditional Buy)price hovering near the higher time frame demand area had given signal of choc previous condering it as bullish change we waited for new confirmation the latest low we saw was at 1.06859, so if the price goes below this area and makes a wick forcing price to close above 1.06859 then this is confirmation of liquidity sweep and we can enter long
fyi - this is just a insight im providing through similar scenario i have seen , also keep track on dxy if dxy starts making lower high and lower low in 1h time frame then other usd related pair will get benifits also EURO
this liquidity sweep is likely to happen in london session

eurusd both direction trade probability short trade probable at supply zone grey area and long trade probable at demand green area .

EURUSDCAPITALCOM:EURUSD
EURUSD has creating a Head and Shoulder if it breaks the Drawn neckline then we can plan for sell side and take retest entry. plan your trade accordingly...

Huge Falling Wedge & Double Bottom It's important to note that the behavior of the EURUSD pair can be influenced by a wide range of factors such as global economic conditions, political developments, supply and demand, and market sentiment. Therefore, it's important to do your own research, analyze the market conditions, and consult with a qualified financial advisor before making any investment decisions.
However, I can provide an explanation of the chart patterns you mentioned, which are the falling wedge pattern and the double bottom pattern.
The falling wedge pattern is a bullish chart pattern that occurs when the price of an asset is trading within a downward sloping channel but with a contracting range. This pattern is characterized by a series of lower highs and lower lows that form two converging trendlines that slope downward. The falling wedge pattern is formed when the price reaches a support level and starts to consolidate, with the lows getting higher and higher while the highs maintain their level, indicating that the sellers are losing momentum. Once the price breaks above the upper trendline of the wedge pattern, it can indicate a trend reversal, and traders may consider buying the asset.
The double bottom pattern is also a bullish chart pattern that occurs when the price of an asset forms two distinct lows at approximately the same price level, separated by a high. This pattern is formed when the price reaches a support level, bounces off it, and then falls back to the same level before bouncing again. The double bottom pattern indicates a potential trend reversal, and traders may consider buying the asset.
It's important to note that chart patterns are just one of the many tools used by traders to analyze the market, and they should not be relied on exclusively for investment decisions. Additionally, it's essential to use risk management techniques, such as setting stop-loss orders, to limit potential losses if the trade does not go as expected.
In summary, the falling wedge and double bottom patterns are bullish chart patterns that can occur in the EURUSD pair or any other asset, and they indicate a potential trend reversal. However, investors should conduct thorough research and analysis and consult with a financial advisor before making any investment decisions based on chart patterns. The FED news can also influence the price of the US dollar, but it's important to keep in mind that market conditions can change rapidly, and it's crucial to constantly monitor the price movements of the asset and adjust investment strategies accordingly.

EURUSD BuyFX:EURUSD
EURUSD is in good resistance level at 1.06140 if this level is broken and the price is sustained then we can plan for buy side.
It is formed Flag and pole.

EURUSDFX:EURUSD
EURUSD is formed a Flag and pole, now it is in consolidation. Breakout may happen either Up or Down side

EURUSD pullback on 1,2 & 4hrLately EURUSD made downward impulsive move and now is ready for pullback 📈
Things to consider:
1. Daily impulse and correction pattern spotted
2. Retracement started and target is 0.382 on Fibonacci
3. COT data shows that hedge funds have been longing EUR so it will rise for sometime now!
How to enter:
1. Study the chart as shown in my analysis
2. Enter when the 5 and 15 MA crossover (5 above 15)
3. Macd crossing signal line
4. Break of the downtrend line
5. Entry and target on the chart
ALL THE BEST!
