EUR/USD Buy Setup from Support Zone towards 1.1743 TargetEUR/USD 2H Chart Analysis
The chart shows EUR/USD trading within a rising channel, with the price currently retesting the support zone (1.1600–1.1620).
Trend & Structure: Price has been respecting channel support and resistance. Currently, it bounced off the lower boundary of the channel, signaling a potential bullish reversal.
Support & Resistance: Strong support at 1.1600 zone, resistance/target at 1.1743.
Moving Averages: EMA 70 (1.1655) and EMA 200 (1.1648) are near, acting as dynamic resistance. A bullish break above them confirms upside continuation.
Candlestick & Momentum: Long wicks near support indicate buyer interest, suggesting accumulation before reversal.
Risk Management: Stop loss should be placed just below 1.1580 (last swing low).
✅ BUY Setup: From 1.1600–1.1620 support zone, targeting 1.1743 with stop loss below 1.1580.
📊 Strategies Used: Trendline channel, EMA confirmation, support/resistance, candlestick patterns, and risk-reward setup.
Eurusdbuy

EUR/USD 1-Hour Rising Channel – Support Zone & Potential Upside!Chart Breakdown & Technical Insights
Rising Channel Structure
The chart clearly shows EUR/USD trading within a rising channel, marked by higher highs (red arrows) and higher lows (green arrows) forming parallel support and resistance trendlines.
Key Support Zone & Bounce Potential
The price is currently sitting near the ascending trendline support, highlighted by the shaded gray box and emphasized with a circled area. Many analysts note that this lower boundary—around the 1.1690 level—serves as crucial support on a broader time frame
.
Short-Term Momentum Indicators
According to recent technical calls, EUR/USD maintains a short-term bullish bias in the rising channel. However, some momentum indicators, such as RSI, hint at weakening strength—particularly when higher price highs are not matched with higher RSI peaks, suggesting a bearish divergence
.
Potential Upside Trajectory
Should the lower channel support hold, the chart suggests a rebound toward mid-channel or potentially up to the upper boundary. Analysts highlight the 1.1720–1.1750 area as a near-term resistance, with the upper channel boundary closer to 1.1850
.
Alternative Scenario – Breakdown Risk
If EUR/USD breaks below the channel (below ~1.1690), the bullish structure may falter. That could expose the pair to deeper pullbacks, possibly testing lower support levels around 1.1650 or lower
.
** Summary Table**
Scenario Likely Outcome
Bounce off support Move up toward mid-channel (~1.172) or channel top (~1.185)
Breakdown below support Decline toward lower support zones (1.1650 and below)
Conclusion & Strategy Snapshot
The price is positioned at a critical support within a well-defined rising channel.
The bullish favored path: a rebound from the lower trendline toward resistance levels.
The bearish risk: a breakdown would shift momentum, possibly leading to deeper retracements.
Monitor for price action signals (e.g. bounce, candlestick patterns), RSI behavior, and behavior around these key levels.

EUR/JPY Potential Bullish Continuation EUR/JPY Potential Bullish Continuation 📈🔍
📊 Technical Overview:
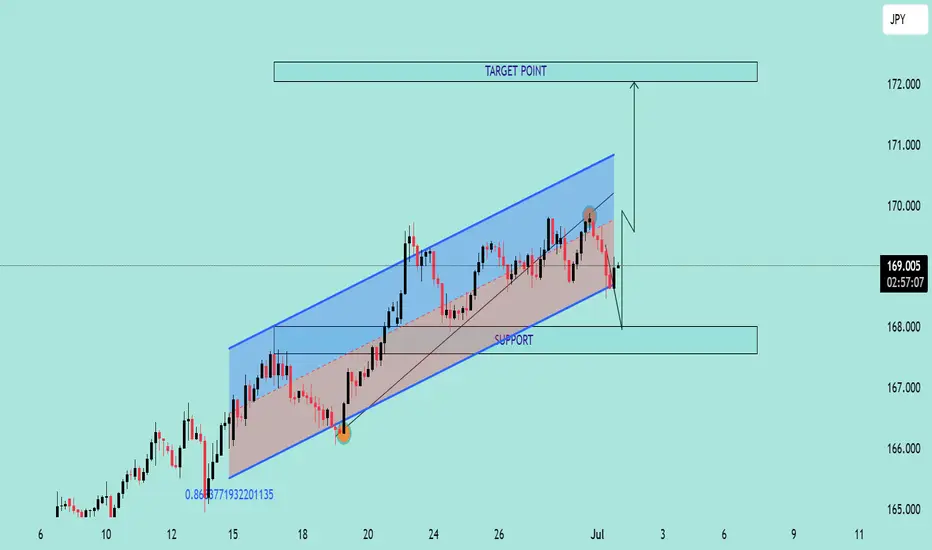
The EUR/JPY chart presents a bullish channel structure, indicating an overall upward trend. Price action respected the channel boundaries with multiple confirmations before the latest bearish correction.
🔹 Structure Highlights:
🔵 Ascending Channel: Price moved steadily within an upward-sloping channel.
🟠 Support Rebound: A strong bullish candle formed on June 20th after touching the lower boundary — a clear support confirmation.
🔴 Recent Rejection: On July 1st, price tested the upper channel resistance and faced rejection, forming a bearish engulfing candle.
🟫 Support Zone Marked: Around the 167.800 level, this zone has been tested multiple times, indicating a possible demand area.
🔁 Current Scenario:
The pair has broken down from the internal trendline (light brown line) and is heading toward the support zone. A bullish bounce from this area may lead to a rally toward the Target Point at ~172.000 🎯.
📌 Key Levels:
Support Zone: 167.600 – 168.000
Resistance Zone: 170.500 – 172.000
Current Price: 168.994
📈 Outlook:
If support holds and bullish momentum returns, there's potential for a move toward the target area at the top of the channel. However, a break below the support zone could invalidate the bullish scenario and suggest a deeper correction.
🧠 Conclusion:
Wait for bullish confirmation near support before considering long positions. A clean break and retest of the support zone could signal a continuation of the upward trend.
EUR/USD Bullish Continuation Analysis EUR/USD Bullish Continuation Analysis 🚀💶
📊 Chart Summary:
The EUR/USD pair is demonstrating a strong bullish structure with consistent higher highs and higher lows. Recent price action shows a breakout above the 1.16386 resistance level, now acting as support 🛡️. The market is currently retracing and might retest this new support zone before continuing its upward move toward the target.
🔍 Key Observations:
🔸 Bullish Structure:
Multiple bullish impulses have formed a clean staircase pattern (🔼⬆️), indicating sustained buying momentum.
🔸 Support Zone 🟦 (1.13200 - 1.14000):
This zone has been tested multiple times, confirming its strength and the base of this bullish rally.
🔸 Breakout & Retest 🟠:
Price broke above the 1.16386 resistance level, pulled back slightly (highlighted by the orange circle), and now looks ready for a potential continuation to the upside.
🔸 Target 🎯: 1.18010
A clear target has been set based on measured move or resistance projection. If the price respects the current structure, we may see a continuation toward this level.
✅ Trade Outlook:
Bias: Bullish 📈
Entry Zone: Around 1.16386 (upon bullish confirmation)
Target 🎯: 1.18010
Invalidation ❌: Break below 1.1600 with bearish momentum
🧠 Technical Tip:
Always wait for confirmation on the retest before entering. Wick rejections or bullish engulfing candles at the support zone can provide additional entry confidence. 🔍✅

EURUSD H1 – Potential Buy Opportunity
📈 **#EURUSD H1 – Potential Buy Opportunity**
We’re closely watching the **H1 order block zone between 1.1482 – 1.1495**.
👉 If price **taps into this zone** and shows a **bullish rejection**,
👉 And we get a **bullish H1 candle closing above 1.1530**,
✅ Then we may plan a **Buy Setup** with:
🎯 **Target**: 1.16185
🛡️ **Stoploss**: 1.1145
Let’s wait for proper confirmation before entering!

EUR/USD Bullish Reversal Breakout Pattern EUR/USD Bullish Reversal Breakout Pattern 🚀📈
📊 Technical Analysis Summary:
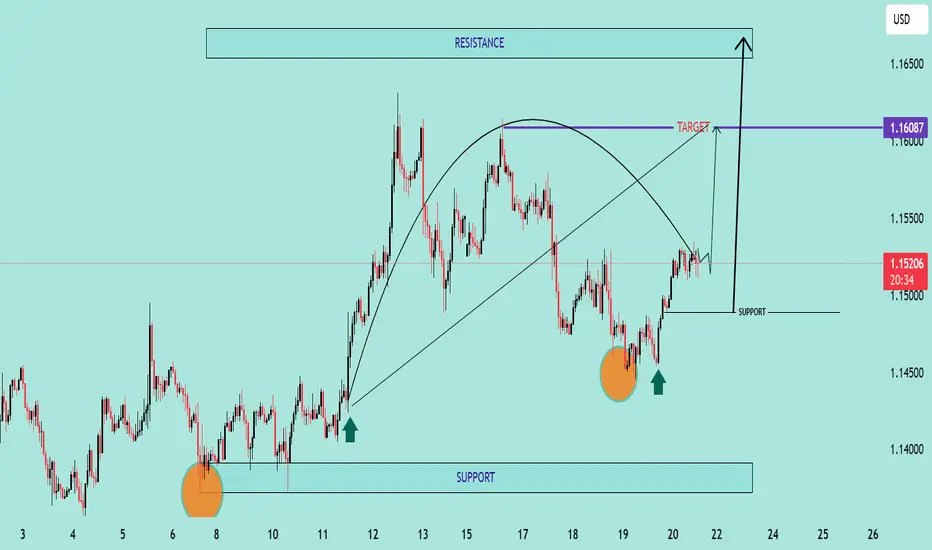
The chart illustrates a strong bullish reversal pattern forming on the EUR/USD pair:
🔹 Double Bottom Formation (🔶🔶):
Two clear bottom zones are marked with orange circles near the 1.14400–1.14500 area, indicating strong buying interest and support.
The second bottom confirms the double bottom pattern, often a precursor to an upward trend.
🔹 Support Zone (📉):
Firm support around 1.14450, as highlighted on the chart.
Price has respected this zone twice, bouncing back with bullish momentum each time.
🔹 Neckline Breakout (🔼):
Price is approaching the neckline zone at 1.16087, which acts as the bullish target.
A break and close above this neckline will confirm the reversal and open the way toward the resistance zone around 1.16500.
🔹 Projected Move (🎯):
If the neckline breaks, price is expected to surge towards 1.16500, aligning with the historical resistance.
This move completes the measured target projection from the double bottom structure.
🔹 Bullish Structure:
Higher lows and strong bullish candles are reinforcing the uptrend momentum.
Curved trajectory shows accumulation followed by a breakout phase.
📌 Key Levels to Watch:
Support: 1.14450 – 1.14500
Neckline/Target: 1.16087
Resistance: 1.16500
🛑 Invalidation:
A strong breakdown below support (1.14450) would invalidate this bullish setup.
✅ Conclusion:
EUR/USD is exhibiting a textbook bullish reversal setup with a potential breakout above 1.16087 likely to trigger further upside toward 1.16500. Ideal scenario for bullish entries on
EUR/USD Bearish Reversal in Channel EUR/USD Bearish Reversal in Channel 📉🔻
📊 Technical Analysis Overview:
The EUR/USD pair is showing clear bearish pressure after hitting a key resistance zone near 1.16500, which aligns with the upper boundary of the ascending channel 📐.
🔺 Resistance Area:
Price reacted strongly to the 1.16500–1.16000 resistance zone (marked with red arrows ⬇️).
Double rejection near this level confirms seller dominance.
📉 Bearish Structure:
Price is forming lower highs, suggesting weakening bullish momentum.
The current pattern implies a potential head and shoulders or rising wedge breakdown.
🎯 Target Levels:
Primary Target: 1.13560 🔽 (short-term key support marked in purple).
Extended Target: 1.12000–1.12500 zone 🧲 (major support area at the lower boundary of the channel).
📎 Support Zone:
Historical bounce region around 1.12000–1.12500 is a strong demand area.
🔍 Conclusion:
If price breaks below 1.13560, it opens the path for a deeper drop toward the broader support range. Traders should monitor for confirmation signals below that level 📉🚨.
⚠️ Recommendation:
Bearish bias remains valid unless price breaks back above 1.15500. Look for pullbacks for short entries. Tight risk management advised! 💼📉

EUR/USD Bullish Trade Setup – Demand Zone to 1.15000 TargetTrend Overview:
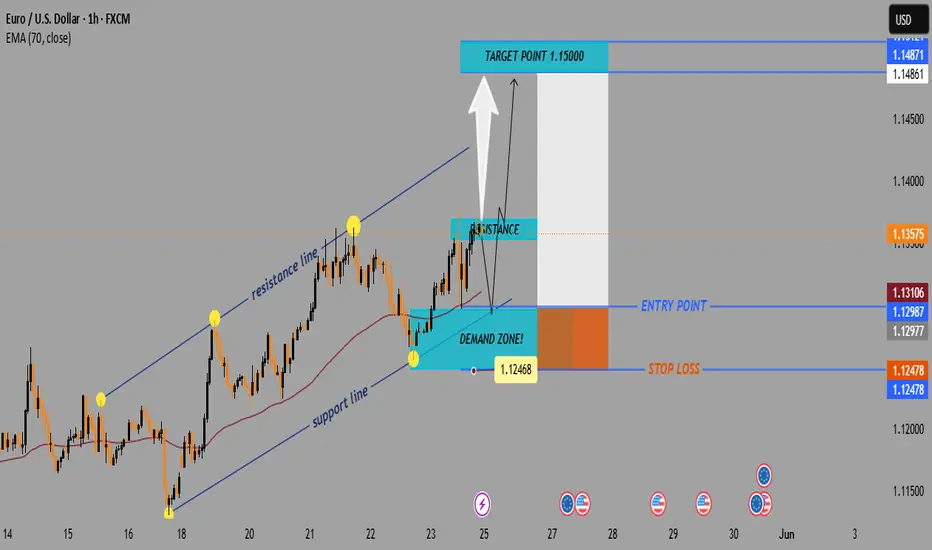
↗️ Uptrend Channel
Support Line (Bottom of channel): Holding the upward price movement.
Resistance Line (Top of channel): Price touches and retraces — a key watch level.
Key Zones:
🟦 Demand Zone (BUY Area)
🟢 1.12468 – 1.12987
Strong support.
Price may bounce from here if retested.
Buyers likely to activate here.
🟥 Resistance Zone
🔴 Around 1.13575
Price faces selling pressure.
If broken, could signal a bullish continuation.
Entry & Exit Strategy:
🎯 Target Point: 1.15000 (Marked in blue above)
🚀 Bullish Target
Above the resistance, indicating breakout potential.
📍 Entry Point: 1.12987 – 1.13106
Slightly above the demand zone.
🛑 Stop Loss: 1.12478
Just below the demand zone for risk control.
EMA (70) Line:
📈 Currently at 1.13106
Price is trading above the EMA = bullish signal.
Scenario Summary:
Bullish Setup
✅ Wait for a pullback into the demand zone
✅ Enter near the blue entry area
✅ Target the 1.15000 zone
✅ Risk managed by stop-loss just below demand zone
EURUSD Chart Analysis : An Elliott Wave Approach Hello friends, welcome to RK Charts!
Today, we'll analyse the EURUSD chart using Elliot Waves. This study is based on Elliot Wave theory and structure, which enables multiple possibilities. Please note that the possibilities outlined here are not definitive predictions, but rather potential scenarios.
The provided information is for educational purposes only and should not be considered trading advice. There is a risk of being completely wrong, and users are warned not to trade or invest solely based on this study.
We are not responsible for any profits or losses incurred. Individuals should consult a financial advisor before making any trading or investment decisions.
Now, let's dive into the analysis. According to Elliot Wave principles, we're currently in a corrective pattern, which consists of ((A)), ((B)) and ((C)) patterns. We've completed ((A)) and ((B)) and are now unfolding ((C)).
Within ((C)) we expect five sub-divisions, labeled as intermediate waves (blue bracketed): blue (1), (2), (3), (4) & (5). Almost four of these sub-divisions are completed, and we've just begun the (5).
We've set an invalidation point at 1.1065, which is the recent low. If this low is not breached, we'll likely continue unfolding the (5) wave of ((C)), which should break above the high of wave (3).
However, if the low is breached, it's possible that wave (4) is undergoing a double correction.
Both scenarios are possible, and we'll continue to monitor the market's unfold.
Scenario 1
Scenario 2
This study is a deep dive into Elliot Wave counts, aligned with the rules and principles of Elliot Wave theory, as well as higher time frame and higher degree analysis.
I hope this analysis based on Elliot Wave theory has helped you understand the chart better and learn something new. Please keep in mind that this is for educational purposes only.
I am not Sebi registered analyst.
My studies are for educational purpose only.
Please Consult your financial advisor before trading or investing.
I am not responsible for any kinds of your profits and your losses.
Most investors treat trading as a hobby because they have a full-time job doing something else.
However, If you treat trading like a business, it will pay you like a business.
If you treat like a hobby, hobbies don't pay, they cost you...!
Hope this post is helpful to community
Thanks
RK💕
Disclaimer and Risk Warning.
The analysis and discussion provided on in.tradingview.com/u/RK_Charts/ is intended for educational purposes only and should not be relied upon for trading decisions. RK_Charts is not an investment adviser and the information provided here should not be taken as professional investment advice. Before buying or selling any investments, securities, or precious metals, it is recommended that you conduct your own due diligence. RK_Charts does not share in your profits and will not take responsibility for any losses you may incur. So Please Consult your financial advisor before trading or investing.

EUR/USD) Big Support level Analysis Read The ChaptianSMC Trading point update
Technical analysis of EUR/USD on the 1-hour timeframe. The idea centers around a potential reversal from a major support zone, aiming for higher resistance targets. Here's a detailed breakdown:
---
1. Big Support Level
A strong horizontal support zone is highlighted around 1.1275–1.1290.
Price is currently reacting off this level, suggesting a potential bullish reversal.
2. EMA 200 as Resistance
The 200-period EMA (~1.1346) is above current price, possibly acting as a dynamic resistance.
A break and hold above it could confirm bullish momentum.
3. Resistance Levels & Target Points
The first target is the 1.14367 resistance level, a clear supply zone.
The second target point is around 1.15622, aligned with a previous major high and strong resistance zone.
4. RSI Indicator
RSI is at 44.02, indicating neutral to slightly oversold conditions—this supports a potential bullish move, especially from support.
5. Forecast Path
The chart projects a likely pullback and breakout pattern:
Rebound from the support zone.
Break through EMA 200 and minor resistance.
Rally toward first and second targets.
Mr SMC Trading point
---
Summary of the Idea:
This is a trend-reversal-to-continuation setup, with EUR/USD expected to rise from a key support area toward 1.14367, and potentially 1.15622, provided price holds above the support and breaks the EMA 200.
Pales support boost 🚀 analysis follow)

EUR/USD Bullish Trade Setup – Targeting 1.18089 with Strong RiskEntry Point: 1.13860
Stop Loss Zone: 1.13642 to 1.12578
Resistance Point: 1.14320
Target (TP) Point: 1.18089
🔍 Observations
Support Zone: Marked in purple near the entry and stop-loss area, suggesting a strong demand zone.
Resistance Zone: Around 1.14320, indicating a potential breakout level.
Trend: Short-term uptrend after a consolidation range.
Risk/Reward Ratio: Quite favorable, targeting a move of approximately 470+ pips (4.20% gain) from entry to target.
📊 Technical Indicators
Moving Averages:
Red (likely 20 EMA): Price recently crossed above, showing bullish momentum.
Blue (likely 50 or 200 EMA): Serving as dynamic support.
Price Action: Formation suggests a potential breakout from resistance toward the 1.18 target.
🧠 Conclusion
This is a long (buy) setup expecting a bullish breakout:
Buy entry above the support zone.
Stop-loss placed below major support (1.12578).
Target set significantly higher, aligning with prior structure or resistance at 1.18089

"EUR/USD Bullish Setup: Demand Zone Bounce with 205+ Pip Target Current Price:
1.13894 ⚪️ (hovering just above EMA)
Zones & Key Levels:
🔵 Demand Zone (Strong Buy Area)
▪️ 1.13059 – 1.13580
Price bounced here!
➡️ Buyers stepping in!
⚫ Support (Old Resistance, New Support)
▪️ Just above 1.13580
➡️ Important to hold this level for bulls
🟠 Stop Loss
▪️ 1.13059
⚠️ Break below = trade invalid
🎯 Target Point
▪️ 1.15646
🚀 Big upside potential! (~205 pips gain)
Indicators:
📈 EMA (9) = 1.13580
▪️ Price is above it → Bullish sign
Setup Summary:
📍 Entry: Around 1.1389
⛔ Stop Loss: Below 1.13059
🎯 Target: 1.15646
⚖️ Risk-Reward Ratio:
1:2.5+ — Great setup!
Bullish Bias
If price keeps climbing from the demand zone
⬆️ Expect continuation toward 1.15646
But if it breaks down...
⬇️ Watch out below 1.13059

"EUR/USD Bullish Breakout & Retest Setup – Targeting 1.10955Instrument: EUR/USD
Timeframe: 30-Minute
Indicators Used:
EMA 30 (Red): 1.09821
EMA 200 (Blue): 1.09698
Key Levels Identified:
Entry Point: 1.09695
Stop Loss: Around 1.09067
Resistance Zone: ~1.09911
Target Zone: ~1.10918 to 1.10955
Projected Gain: ~147.3 pips (1.35%)
Price Action Analysis:
Bullish Breakout:
The price broke out from a consolidation zone (marked in purple).
A bullish trend is forming as price moves above the 200 EMA.
EMAs Alignment:
The 30 EMA is currently above the 200 EMA, indicating a potential bullish trend continuation.
However, price is slightly below the 30 EMA now, suggesting some short-term pullback or resistance.
Retest at Entry Zone:
Price retested the entry zone at 1.09695 after the breakout and is now hovering near it.
This retest is healthy for confirming support before another move up.
Trade Setup Insight:
Entry Strategy: A long (buy) entry at or around 1.09695.
Stop Loss Placement: Below the previous support zone near 1.09067 to manage risk.
Target Strategy: Aiming for the resistance zone around 1.10918–1.10955 for profit booking.
Conclusion:
This looks like a bullish continuation setup with a favorable risk-reward ratio. The confluence of:
EMA support,
Price structure (breakout & retest),
and defined resistance/target zone

GOLD TRADING POINT UPDATE >READ THE CHPTAIAN Buddy'S dear friend 👋.
SMC Trading Signals Update 🗾🗺️ Euro USD Traders SMC-Trading Point update you on New technical analysis setup for Euro USD) Euro USD still going to bullish trend 🚀 analysis update 1.09483 rejected point below 👇 trend following support level again back up trand 1.09129 - 1.08959 support level buying zone ☺️ 🥂
Target 🎯 point 1.09865 good luck 💯💯🤞
Key Resistance level 1.09476 + 1.09865
Key Support level 1.09129 - 1.08959
Mr SMC Trading point
Pales support boost analysis follow)

EUR/USD Bullish Breakout – Trade Setup & AnalysisTrendline Breakout
🔹 Price has broken above a descending trendline, signaling a bullish move.
📊 Trade Setup:
🟢 Entry Point: 1.08621
🟡 TP1: 1.08895
🔵 Target: 1.09612
🔴 Stop Loss: 1.08270
📈 Market Outlook:
✅ Bullish bias as long as price stays above 1.08621.
🚀 If momentum holds, the next key resistance is 1.09190, followed by the final target at 1.09612.
⚠️ Risk Managed: Stop-loss at 1.08270 to limit downside risk.
🔎 What to Watch:
🟠 If price retests 1.08621 and holds, it may be a good buy confirmation.
🔺 Breaking 1.09190 could trigger more upside momentum.

EURUSD ORDER BLOCK | LONG TRADEHi Trader
Eurusd taken previous 1hr and 4hr liqduity so Buying expected
according to SMC. (Forex Mentorship available)
5 min CHoCH is best to take Long trade
Note - Only for education purpose

EUR/USD TRADE STEPUP :-Today Euro made it 4 months $1.04958 and also November 2023 euro made its low $ 1.04477 after multiple times tested this level.today euro made daily time frame on insider candle .if euro breaks yesterday high than much possibly euro can drive up side move to $1.06824 levels.
stay tuned with me for more updates:-

Euro Dollar looking Bullish!Recently we saw US dollar getting weak and falling, which made the fundamentals favorable for the dollar crosses like GBP, AUD, EUR , NZD etc. This is an idea to get long on the Euro if the price pulls back a bit to the demand zone and riding the uptrend, which will give a good RR of 1:3.
Note- This is my own trading idea and not a financial advice, trading is highly risky.

EURUSD LONG FOR TUESDAY 🥦🥦🥦🥦Today upside bias
Maybe Target is 1.0777.( technical reason)
Trade based on your style.
There is no issues going around the world right now so
Risk on mode is ON.( Fundamental reason).
Don't scold me if it's wrong😂.
Learn to analysis and trade by yourself is better.

EURUSD LONG!!!!!!! 🥦🥦🥦Today I am looking to take long position for short term trade,
I am telling you the bias only
Just trade by your rules and setup accordingly.
Learn to do analysis by yourself.

EURUSD 1D Bullish scenarioWe have seen a large sell off in Euro from past few weeks as the USD was strong, now the price has come to 1.07300 area which looks a good buying opportunity if not for long term then too for short term it may take a correction and reach to 1.08550 zone.
IMPORTANT - This is not a financial advice as the markets are risky, kindly do your own research before placing trades.

EurUsd falling wedge breakout on 4hrEurUsd falling wedge breakout on 4hr
can look for 1:1 risk reward ration above 1.06168
dc : only for educational and learning purpose

Eur-Usd buying levelscurrently price is not in good place to make long trades
we have one medium time frame resistance and two bearish order block coming in way
let the price pullback to the level of 1.0575 & 1.05180 for long initating and
can have the target of 1.07800
with good risk to rewards
