EURUSD Weekly Outlook (SMC + HTF Resistance Confluence)📊 Market Structure Overview
EURUSD is currently trading into a major weekly supply / resistance zone while respecting a long-term descending trendline connecting multiple swing highs. Price has approached this area several times historically and reacted with strong bearish momentum — making it a high-probability reaction zone on the HTF.
🔎 Key Technical Observations
Price is testing a multi-year descending trendline → strong dynamic resistance.
Presence of SMC concepts on chart: BOS / CHoCH and visible FVG zones below current price.
Current rally looks like a liquidity grab into premium pricing within weekly structure.
Equal / relative highs marked — potential buy-side liquidity before reversal.
HTF structure overall remains bearish / corrective, not a confirmed bullish trend reversal.
📍 Trading Plan (Idea — Not Financial Advice)
➡️ Primary Bias: Bearish from weekly resistance.
➡️ Entry Concept:
Wait for lower-timeframe confirmation such as:
Bearish engulfing candle
Pin bar rejection
Market structure shift / CHoCH
➡️ Targets:
First reaction → mid FVG / internal demand
Major target → HTF demand zone around parity region (~1.00 area)
Extended bearish scenario → deeper weekly demand near lower red zone
⚠️ Risk Factors / Invalidation
Strong weekly close above trendline and resistance zone.
Bullish continuation with sustained higher highs + higher lows on HTF.
Macro catalysts (ECB/Fed policy shifts) could accelerate volatility.
🧠 Final Thoughts
This setup aligns with a classic premium sell model — price rallies into HTF supply + trendline confluence before targeting imbalances below. Patience is key: confirmation matters more than prediction.
Eurusddaily

EURUSD – Bearish Channel Continuation on H1EURUSD – Bearish Channel Continuation on H1
Market Overview
EURUSD continues to move steadily within a descending channel, confirming a bearish market structure. Recent recovery attempts have been capped at supply zones, while liquidity remains concentrated at lower price levels. As long as the pair trades inside this channel, the preferred strategy is to look for selling opportunities.
Technical Context
The bearish channel remains intact, with strong seller defence in the 1.1720–1.1790 zone.
Key resistance levels: 1.1753 and 1.1820. Only a clear break above 1.1820 would weaken the bearish scenario.
Downside liquidity targets sit around 1.1630, with extended potential toward 1.1575 if selling pressure accelerates.
Trading Scenarios
🔻 Priority – Sell Setups (with the channel trend)
Sell Setup 1
Entry: 1.1720 – 1.1730
Stop Loss: 1.1750
Take Profit: 1.1695 – 1.1670 – 1.1652 – 1.1630
Sell Setup 2
Entry: 1.1780 – 1.1790
Stop Loss: 1.1810
Take Profit: 1.1755 – 1.1730 – 1.1700 – 1.1675
🔹 Alternative – Buy Setup (countertrend, lower probability)
Buy Setup
Entry: 1.1630 – 1.1620
Stop Loss: 1.1600
Take Profit: 1.1660 – 1.1680 – 1.1700
Note: This setup is only valid if price tests the demand zone around 1.1620–1.1630, which could trigger a short-term corrective bounce.
Risk Management & Outlook
Primary Bias: Stay bearish while price action remains within the channel.
Invalidation: A confirmed H1/H4 close above 1.1820 invalidates the bearish view.
Target: A decisive breakdown below 1.1630 could pave the way towards 1.1575.
✅ Conclusion:
EURUSD remains in a clear downtrend. The main strategy is to sell rallies into resistance zones, targeting lower liquidity areas. Long positions can be considered only at strong demand levels, and should be treated as short-term corrective trades rather than a trend reversal.

EUR/USD 1-Hour Rising Channel – Support Zone & Potential Upside!Chart Breakdown & Technical Insights
Rising Channel Structure
The chart clearly shows EUR/USD trading within a rising channel, marked by higher highs (red arrows) and higher lows (green arrows) forming parallel support and resistance trendlines.
Key Support Zone & Bounce Potential
The price is currently sitting near the ascending trendline support, highlighted by the shaded gray box and emphasized with a circled area. Many analysts note that this lower boundary—around the 1.1690 level—serves as crucial support on a broader time frame
.
Short-Term Momentum Indicators
According to recent technical calls, EUR/USD maintains a short-term bullish bias in the rising channel. However, some momentum indicators, such as RSI, hint at weakening strength—particularly when higher price highs are not matched with higher RSI peaks, suggesting a bearish divergence
.
Potential Upside Trajectory
Should the lower channel support hold, the chart suggests a rebound toward mid-channel or potentially up to the upper boundary. Analysts highlight the 1.1720–1.1750 area as a near-term resistance, with the upper channel boundary closer to 1.1850
.
Alternative Scenario – Breakdown Risk
If EUR/USD breaks below the channel (below ~1.1690), the bullish structure may falter. That could expose the pair to deeper pullbacks, possibly testing lower support levels around 1.1650 or lower
.
** Summary Table**
Scenario Likely Outcome
Bounce off support Move up toward mid-channel (~1.172) or channel top (~1.185)
Breakdown below support Decline toward lower support zones (1.1650 and below)
Conclusion & Strategy Snapshot
The price is positioned at a critical support within a well-defined rising channel.
The bullish favored path: a rebound from the lower trendline toward resistance levels.
The bearish risk: a breakdown would shift momentum, possibly leading to deeper retracements.
Monitor for price action signals (e.g. bounce, candlestick patterns), RSI behavior, and behavior around these key levels.

EUR/JPY Potential Bullish Continuation EUR/JPY Potential Bullish Continuation 📈🔍
📊 Technical Overview:
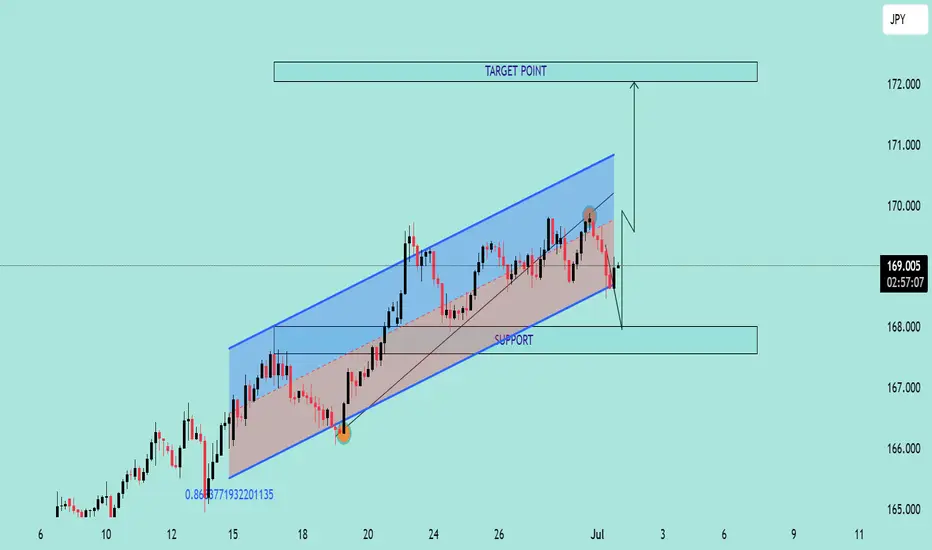
The EUR/JPY chart presents a bullish channel structure, indicating an overall upward trend. Price action respected the channel boundaries with multiple confirmations before the latest bearish correction.
🔹 Structure Highlights:
🔵 Ascending Channel: Price moved steadily within an upward-sloping channel.
🟠 Support Rebound: A strong bullish candle formed on June 20th after touching the lower boundary — a clear support confirmation.
🔴 Recent Rejection: On July 1st, price tested the upper channel resistance and faced rejection, forming a bearish engulfing candle.
🟫 Support Zone Marked: Around the 167.800 level, this zone has been tested multiple times, indicating a possible demand area.
🔁 Current Scenario:
The pair has broken down from the internal trendline (light brown line) and is heading toward the support zone. A bullish bounce from this area may lead to a rally toward the Target Point at ~172.000 🎯.
📌 Key Levels:
Support Zone: 167.600 – 168.000
Resistance Zone: 170.500 – 172.000
Current Price: 168.994
📈 Outlook:
If support holds and bullish momentum returns, there's potential for a move toward the target area at the top of the channel. However, a break below the support zone could invalidate the bullish scenario and suggest a deeper correction.
🧠 Conclusion:
Wait for bullish confirmation near support before considering long positions. A clean break and retest of the support zone could signal a continuation of the upward trend.
EUR/USD Bullish Continuation Analysis EUR/USD Bullish Continuation Analysis 🚀💶
📊 Chart Summary:
The EUR/USD pair is demonstrating a strong bullish structure with consistent higher highs and higher lows. Recent price action shows a breakout above the 1.16386 resistance level, now acting as support 🛡️. The market is currently retracing and might retest this new support zone before continuing its upward move toward the target.
🔍 Key Observations:
🔸 Bullish Structure:
Multiple bullish impulses have formed a clean staircase pattern (🔼⬆️), indicating sustained buying momentum.
🔸 Support Zone 🟦 (1.13200 - 1.14000):
This zone has been tested multiple times, confirming its strength and the base of this bullish rally.
🔸 Breakout & Retest 🟠:
Price broke above the 1.16386 resistance level, pulled back slightly (highlighted by the orange circle), and now looks ready for a potential continuation to the upside.
🔸 Target 🎯: 1.18010
A clear target has been set based on measured move or resistance projection. If the price respects the current structure, we may see a continuation toward this level.
✅ Trade Outlook:
Bias: Bullish 📈
Entry Zone: Around 1.16386 (upon bullish confirmation)
Target 🎯: 1.18010
Invalidation ❌: Break below 1.1600 with bearish momentum
🧠 Technical Tip:
Always wait for confirmation on the retest before entering. Wick rejections or bullish engulfing candles at the support zone can provide additional entry confidence. 🔍✅

EUR/USD Potential Rejection from ResistanceTechnical Overview:
The EUR/USD chart exhibits signs of a bearish reversal pattern forming near a key resistance zone (1.15800 - 1.16000), highlighted with repeated rejection wicks (🔴 red arrows). Price is currently trading at 1.15222, after failing to hold above the neckline of the rounded bottom pattern.
🔍 Key Observations:
🔺 Resistance Zone: Strong resistance has been confirmed multiple times (red arrows), indicating sellers are active at the top.
🟠 Double Top / Head & Shoulders Behavior: Price action shows topping formations (highlighted with orange circles), suggesting exhaustion of bullish momentum.
📉 Bearish Breakdown Possibility:
Price rejected near neckline and is showing bearish candle formations.
Breakdown from the current consolidation zone could push price toward the target zone at 1.14491, marked in purple.
This aligns with previous support structure, reinforcing a technical downside projection.
🔻 Support Zone: Around 1.13800 - 1.14000 is a strong area of demand and may act as the next bounce point if the bearish move continues.
📐 Chart Pattern Structure:
Rounded bottom formed earlier, but the failure to continue higher and breakout suggests a false breakout trap for buyers.
Downward sloping trendline broke, but now price is struggling to sustain above previous highs.
📌 Conclusion:
⚠️ Caution for bulls as price shows signs of weakness at resistance. A move below 1.15000 may initiate further downside toward 1.14491 and possibly lower. Short-term traders can watch for confirmation candles near this zone for entries.
📅 Short-Term Bias: Bearish
🎯 Target: 1.14491
⛔️ Invalidation: Strong breakout above 1.16000

EUR/USD Bullish Reversal Breakout Pattern EUR/USD Bullish Reversal Breakout Pattern 🚀📈
📊 Technical Analysis Summary:
The chart illustrates a strong bullish reversal pattern forming on the EUR/USD pair:
🔹 Double Bottom Formation (🔶🔶):
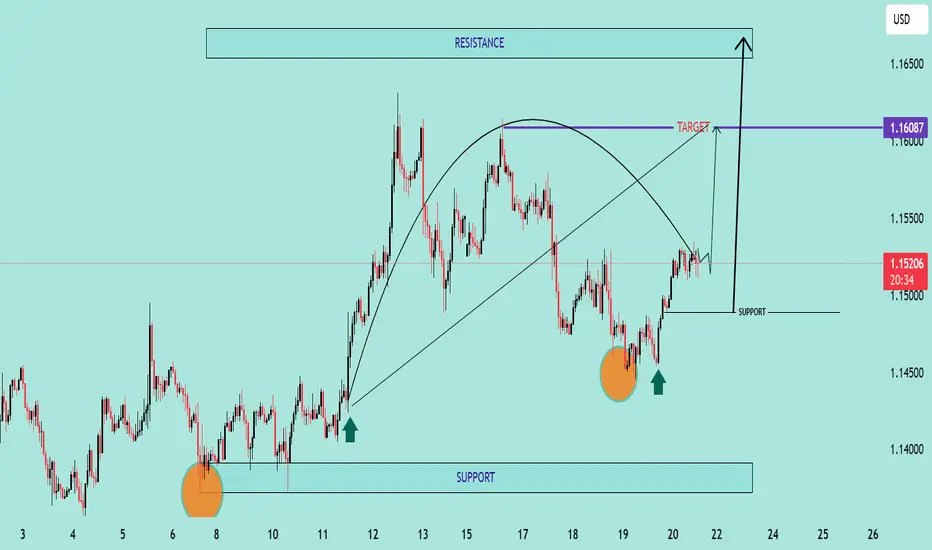
Two clear bottom zones are marked with orange circles near the 1.14400–1.14500 area, indicating strong buying interest and support.
The second bottom confirms the double bottom pattern, often a precursor to an upward trend.
🔹 Support Zone (📉):
Firm support around 1.14450, as highlighted on the chart.
Price has respected this zone twice, bouncing back with bullish momentum each time.
🔹 Neckline Breakout (🔼):
Price is approaching the neckline zone at 1.16087, which acts as the bullish target.
A break and close above this neckline will confirm the reversal and open the way toward the resistance zone around 1.16500.
🔹 Projected Move (🎯):
If the neckline breaks, price is expected to surge towards 1.16500, aligning with the historical resistance.
This move completes the measured target projection from the double bottom structure.
🔹 Bullish Structure:
Higher lows and strong bullish candles are reinforcing the uptrend momentum.
Curved trajectory shows accumulation followed by a breakout phase.
📌 Key Levels to Watch:
Support: 1.14450 – 1.14500
Neckline/Target: 1.16087
Resistance: 1.16500
🛑 Invalidation:
A strong breakdown below support (1.14450) would invalidate this bullish setup.
✅ Conclusion:
EUR/USD is exhibiting a textbook bullish reversal setup with a potential breakout above 1.16087 likely to trigger further upside toward 1.16500. Ideal scenario for bullish entries on
EUR/USD Potential Reversal from Resistance Zone –Bearish OutlookThe EUR/USD pair has been trading within a well-defined ascending channel for several weeks. Price recently tested a strong resistance zone near 1.15850 – 1.16000, which aligns with the upper boundary of the channel and a previously marked supply area.
Key observations:
The price action shows signs of rejection from the resistance zone with a potential double-top or fakeout pattern forming.
A projected bearish trajectory is marked, suggesting a possible break below the channel support.
Immediate bearish targets are set at key demand zones around 1.14500, 1.12500, and further down to 1.10500.
A large red arrow indicates the strong downside bias if the price confirms the breakdown.
Conclusion:
If EUR/USD fails to sustain above the 1.15850 resistance zone and breaks below the ascending channel, a strong bearish correction is anticipated. Traders should watch for confirmation of the breakdown before entering short positions.

EUR/USD Bearish Reversal in Channel EUR/USD Bearish Reversal in Channel 📉🔻
📊 Technical Analysis Overview:
The EUR/USD pair is showing clear bearish pressure after hitting a key resistance zone near 1.16500, which aligns with the upper boundary of the ascending channel 📐.
🔺 Resistance Area:
Price reacted strongly to the 1.16500–1.16000 resistance zone (marked with red arrows ⬇️).
Double rejection near this level confirms seller dominance.
📉 Bearish Structure:
Price is forming lower highs, suggesting weakening bullish momentum.
The current pattern implies a potential head and shoulders or rising wedge breakdown.
🎯 Target Levels:
Primary Target: 1.13560 🔽 (short-term key support marked in purple).
Extended Target: 1.12000–1.12500 zone 🧲 (major support area at the lower boundary of the channel).
📎 Support Zone:
Historical bounce region around 1.12000–1.12500 is a strong demand area.
🔍 Conclusion:
If price breaks below 1.13560, it opens the path for a deeper drop toward the broader support range. Traders should monitor for confirmation signals below that level 📉🚨.
⚠️ Recommendation:
Bearish bias remains valid unless price breaks back above 1.15500. Look for pullbacks for short entries. Tight risk management advised! 💼📉

EUR/JPY Long Setup – Bullish Reversal from Key Support ZoneEntry Point: 162.227
Stop Loss: 161.629
Take Profit (Target): 166.778
Current Price: ~162.798
Risk/Reward Ratio:
Risk: ~60 pips
Reward: ~455 pips
Risk/Reward ≈ 1:7.6 (strong setup)
🔍 Technical Insights
Support Zone:
The purple rectangle around 162.227 to 162.000 is identified as a key demand zone or support area.
Price has tested this zone previously and appears to be bouncing off it.
Price Structure:
The pattern suggests a potential double-bottom or reversal structure forming.
A rounded recovery projection is drawn, implying bullish momentum is expected.
Moving Averages:
A red (shorter period) moving average is crossing below the price.
A blue (longer period) moving average near the support zone could act as dynamic support.
Target Area:
166.778 marks a clear resistance or prior high and is labeled as the “EA Target Point”.
This is a logical profit-taking zone based on past price action.
✅ Bullish Trade Bias Justification
Strong support reaction near entry.
Favorable risk/reward ratio.
Reversal pattern potential.
Confluence with moving average support.
⚠️ Considerations
Ensure confirmation from a bullish candle or reversal signal before entry.
Be mindful of macroeconomic events or EUR/JPY fundamentals that might impact volatility.

"EUR/USD Bullish Breakout & Retest Setup – Targeting 1.10955Instrument: EUR/USD
Timeframe: 30-Minute
Indicators Used:
EMA 30 (Red): 1.09821
EMA 200 (Blue): 1.09698
Key Levels Identified:
Entry Point: 1.09695
Stop Loss: Around 1.09067
Resistance Zone: ~1.09911
Target Zone: ~1.10918 to 1.10955
Projected Gain: ~147.3 pips (1.35%)
Price Action Analysis:
Bullish Breakout:
The price broke out from a consolidation zone (marked in purple).
A bullish trend is forming as price moves above the 200 EMA.
EMAs Alignment:
The 30 EMA is currently above the 200 EMA, indicating a potential bullish trend continuation.
However, price is slightly below the 30 EMA now, suggesting some short-term pullback or resistance.
Retest at Entry Zone:
Price retested the entry zone at 1.09695 after the breakout and is now hovering near it.
This retest is healthy for confirming support before another move up.
Trade Setup Insight:
Entry Strategy: A long (buy) entry at or around 1.09695.
Stop Loss Placement: Below the previous support zone near 1.09067 to manage risk.
Target Strategy: Aiming for the resistance zone around 1.10918–1.10955 for profit booking.
Conclusion:
This looks like a bullish continuation setup with a favorable risk-reward ratio. The confluence of:
EMA support,
Price structure (breakout & retest),
and defined resistance/target zone

EUR/USD Short Setup – Entry at Resistance, Targeting 1.08942"Entry Point: ~1.10456
Resistance Point: ~1.10151
Stop Loss: ~1.10833
Target Point: ~1.08942
Risk/Reward:
Risk: ~37.7 pips
Reward: ~111.4 pips
Approx. R:R = 1:3
Indicators Used:
EMA 30 (red): ~1.09966
EMA 200 (blue): ~1.09607
Price is currently above both EMAs → Generally bullish in the short term, but you seem to be anticipating a reversal from resistance.
Setup Type:
This appears to be a sell setup based on price reaching a key resistance area with rejection signs, possibly a fake-out above resistance before a move down to the target.
⚠️ What to Watch For:
Confirmation Candle: If you're not in the trade yet, look for strong bearish confirmation below resistance to validate the short.
Stop-Loss Placement: It’s placed above the last high in the purple zone – a good defensive move.
EMA Alignment: Since price is above both EMAs, you’re trading against the trend – more aggressive, so extra confirmation is crucial.

EUR/USD Short Trade Setup – Key Resistance Rejection & Bearish TEntry Zone:
The entry for the short trade is around 1.08405 - 1.08412.
The price is expected to rise into this area before reversing downward.
Stop Loss:
Positioned at 1.08760 - 1.08770, above the resistance zone marked in purple.
This ensures the trade is invalidated if price moves too high.
Take Profit Levels (TP):
TP1: 1.07987
TP2: 1.07620
TP3: 1.07107
Final Target: 1.06604
Indicators Used:
200 EMA (Blue Line): At 1.08405, acting as resistance.
30 EMA (Red Line): At 1.08086, showing short-term trend direction.
Overall Trade Idea:
Price is expected to reject the 1.08412 resistance zone and move downward.
If the price respects the resistance, a strong bearish move toward the 1.06604 target is anticipated.
Potential Trade Plan:
Sell at: ~1.08405
Stop Loss: ~1.08760
Take Profit: Staggered at TP1, TP2, TP3, or full exit at 1.06604.

EUR/USD TRADE STEPUP :-Today Euro made it 4 months $1.04958 and also November 2023 euro made its low $ 1.04477 after multiple times tested this level.today euro made daily time frame on insider candle .if euro breaks yesterday high than much possibly euro can drive up side move to $1.06824 levels.
stay tuned with me for more updates:-

EURUSD SHORT - 1H TIMEFRAMEFOREXCOM:EURUSD - 1H
Hello traders , here is the full multi time frame analysis for this pair, let me know in the comment section below if you have any questions, the entry will be taken only if all rules of the strategies will be satisfied. wait for more Smart Money to develop before taking any position . I suggest you keep this pair on your watchlist and see if the rules of your strategy are satisfied...
Keep trading
Hustle hard
Markets can be Unpredictable, research before trading.
Disclaimer: This trade idea is based on Smart money concept and is for informational purposes only. Trading involves risks; seek professional advice before making any financial decisions. Informational only!!!!

Euro Dollar looking Bullish!Recently we saw US dollar getting weak and falling, which made the fundamentals favorable for the dollar crosses like GBP, AUD, EUR , NZD etc. This is an idea to get long on the Euro if the price pulls back a bit to the demand zone and riding the uptrend, which will give a good RR of 1:3.
Note- This is my own trading idea and not a financial advice, trading is highly risky.

$EUR 4hr ChartMonthly Timeframe → April Month Low is Target.
Weekly Timeframe → Weekly FVG to be Draw.
4H Timeframe → Trendline Liquidity is Target

EURUSD on May 20, 2024 has the price drop started?Hello everyone, DEEKOP is ready to bring the most accurate signals and assessments to everyone.
Financial freedom is true freedom.
Based on the Elliot wave principle, we analyze the H1 chart
- We see that the small 5-wave structure has completed on the H1 frame, after which the price entered the corrective wave abc.
- Looking at the corrective wave structure, we see that wave a has completed and the price is currently in the target area of ending wave b to start wave c.
- This is a very good price range to be able to execute a sell order at this price range
- Using the method of measuring the end target of wave c, we have 2 target price zones for the end of wave c: zone 1.0822 and zone 1.0787
Trading plan
We look for a Sell point at the price range of 1.0884 with the expectation of profit at the expected price range at the end of wave c. We have 2 areas: the price range of 1.0822 and the price range of 1.0787
Note: Sufficient TP, SL to be safe and win the market‼ ️Change data plan will be updated later.
Deekop's analysis is only a personal opinion with a desire to share its views with the community. I'm not always right. But my analysis always reflects my meticulous evaluation of what is best for an investment.

EURUSD may began Short move EURUSD may began Short move
EURUSD on 4H Order Block
on good bearish spike possible

EURUSD LONG!!!!!!! 🥦🥦🥦Today I am looking to take long position for short term trade,
I am telling you the bias only
Just trade by your rules and setup accordingly.
Learn to do analysis by yourself.

EurUsd falling wedge breakout on 4hrEurUsd falling wedge breakout on 4hr
can look for 1:1 risk reward ration above 1.06168
dc : only for educational and learning purpose

Global Markets Face DownturnGlobal markets are experiencing a decline, with early indications suggesting that Wall Street may open lower. The Dow futures are down 129.00 points, the S&P 500 futures are declining by 19.50 points, and the Nasdaq 100 futures are sliding by 82.75 points as of 8:00 am ET.
On Monday, the major US stock indexes mostly finished higher, with the Nasdaq gaining 0.7 percent, the S&P 500 inching up slightly, and the Dow slipping by 0.2 percent.
Today, the Labor Department will release the Job Openings and Labor Turnover Survey (JOLTS) report for August, which could be a significant event. The consensus is for 8.75 million job openings, slightly lower than July's figure.
Asian stocks also fell sharply today, with Hong Kong's Hang Seng index tumbling by 2.69 percent. Chinese markets remained closed for the holidays, and Japanese shares also declined.
Australian markets dropped after the Reserve Bank of Australia kept interest rates steady but highlighted the possibility of further policy tightening to control inflation.
European shares are also trading negatively, with France's CAC 40, Germany's DAX, England's FTSE 100, and the Swiss Market Index all declining. The Euro Stoxx 50, which represents leading companies in the Eurozone, is also down.
Additionally, there will be a 52-week Treasury bill auction held later today.

Euro/Usd long setupcurrent bullish candles looks like pullback
we have open order block at the level of 1.07028 to 1.0981 (buy area)
resistance 1.07818 to 1.07715
