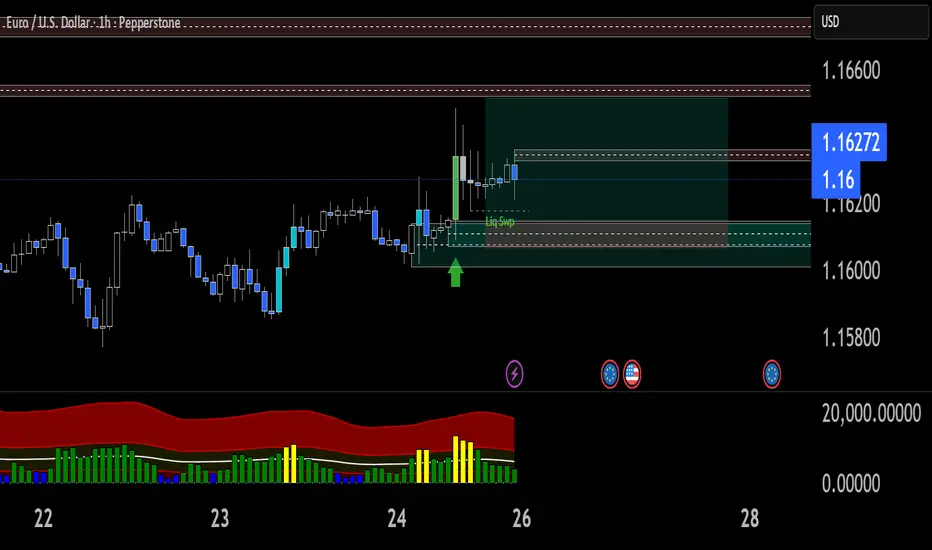
EUR/USD Bullish Setup – Liquidity Sweep & Break of StructureI’m sharing a long trade setup on EUR/USD based on a liquidity sweep and bullish market structure shift.
Price swept liquidity below the recent swing low and immediately showed strong bullish reaction, indicating absorption of sell-side liquidity. Following the sweep, price broke above short-term structure and retested the demand zone, confirming bullish intent.
I entered long at the retest of the demand area, with my stop-loss placed just below the liquidity sweep low to protect against invalidation. The take-profit target aligns with the next major supply zone / equal highs.
Trade Details:
Entry: 1.16147
Stop-Loss: 1.16066 (below liquidity sweep area)
Take-Profit: 1.16515 (major resistance/target zone)
Risk-to-Reward Ratio: 1:4.5+
Why this trade?
Liquidity sweep below previous lows (manipulation phase)
Break of structure to the upside confirming bullish momentum
Retest of demand zone with bullish candle confirmation
Volume spike supporting buyers entering the market
If price holds above the retest zone, I expect continuation to the upside toward the marked target area.
Eurusdsignal
EUR USD 15 ANALYSIS AND TARGETAS market have taken all buyside liquiduty it is goignt for sell side....i have marked the todays target .....for more updates follow me

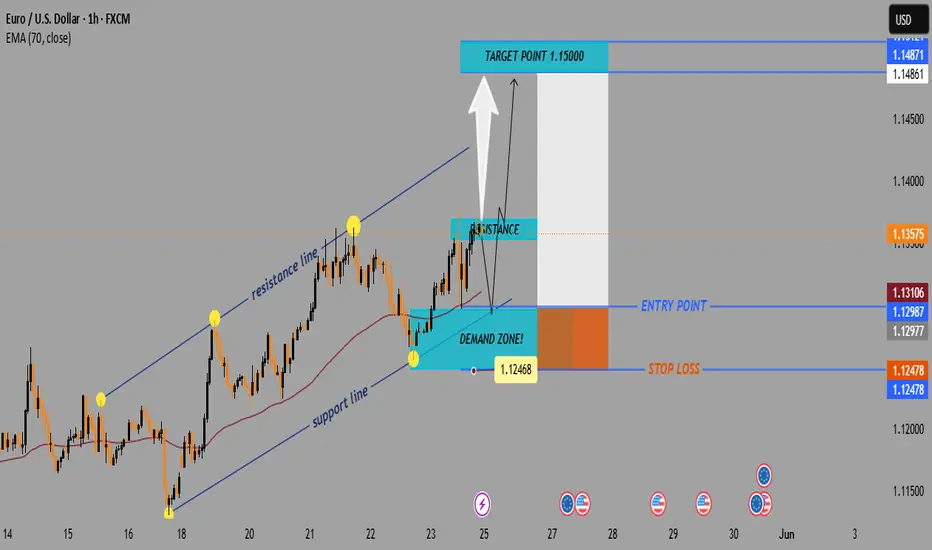
EUR/USD Bullish Trade Setup – Demand Zone to 1.15000 TargetTrend Overview:
↗️ Uptrend Channel
Support Line (Bottom of channel): Holding the upward price movement.
Resistance Line (Top of channel): Price touches and retraces — a key watch level.
Key Zones:
🟦 Demand Zone (BUY Area)
🟢 1.12468 – 1.12987
Strong support.
Price may bounce from here if retested.
Buyers likely to activate here.
🟥 Resistance Zone
🔴 Around 1.13575
Price faces selling pressure.
If broken, could signal a bullish continuation.
Entry & Exit Strategy:
🎯 Target Point: 1.15000 (Marked in blue above)
🚀 Bullish Target
Above the resistance, indicating breakout potential.
📍 Entry Point: 1.12987 – 1.13106
Slightly above the demand zone.
🛑 Stop Loss: 1.12478
Just below the demand zone for risk control.
EMA (70) Line:
📈 Currently at 1.13106
Price is trading above the EMA = bullish signal.
Scenario Summary:
Bullish Setup
✅ Wait for a pullback into the demand zone
✅ Enter near the blue entry area
✅ Target the 1.15000 zone
✅ Risk managed by stop-loss just below demand zone
EUR/USD Buy Setup1. Entry Point:
Marked at: 1.12243
This is the suggested price level to enter a long (buy) trade.
2. Stop Loss:
Set at: 1.11542
Placed below a support zone, it limits the downside risk if the trade moves against the position.
3. Target Points:
EA Target Point One: 1.13891
EA Target Point (Final): 1.15929
These levels are profit-taking zones, with the first being a conservative target and the second being a more extended move.
4. Technical Indicators:
Moving Averages:
A red shorter-term moving average (possibly 20 EMA)
A blue longer-term moving average (possibly 200 EMA)
Price is currently below both, indicating bearish momentum, though the long setup is anticipating a reversal.
5. Support/Resistance Zones:
Purple Zones: Highlighted as key demand and supply areas.
The lower purple zone supports the entry and stop-loss area.
The upper purple zones mark resistance areas aligning with the target levels.
6. Current Price:
Around 1.12459, slightly above the entry zone.
Conclusion:
This setup is a bullish trade idea with a clearly defined:
Entry (1.12243),
Stop-loss (1.11542), and
Two take-profit levels (1.13891 and 1.15929).

EUR/USD Bullish Trade Setup – Targeting 1.18089 with Strong RiskEntry Point: 1.13860
Stop Loss Zone: 1.13642 to 1.12578
Resistance Point: 1.14320
Target (TP) Point: 1.18089
🔍 Observations
Support Zone: Marked in purple near the entry and stop-loss area, suggesting a strong demand zone.
Resistance Zone: Around 1.14320, indicating a potential breakout level.
Trend: Short-term uptrend after a consolidation range.
Risk/Reward Ratio: Quite favorable, targeting a move of approximately 470+ pips (4.20% gain) from entry to target.
📊 Technical Indicators
Moving Averages:
Red (likely 20 EMA): Price recently crossed above, showing bullish momentum.
Blue (likely 50 or 200 EMA): Serving as dynamic support.
Price Action: Formation suggests a potential breakout from resistance toward the 1.18 target.
🧠 Conclusion
This is a long (buy) setup expecting a bullish breakout:
Buy entry above the support zone.
Stop-loss placed below major support (1.12578).
Target set significantly higher, aligning with prior structure or resistance at 1.18089

EUR/USD Long Opportunity – Entry at Support ZoneEntry Zone (Buy Area): Between 1.12729 and 1.13101
Stop Loss: 1.12100
Target (TP1): 1.16950
Risk-Reward Ratio (R:R):
Risk: 1.13101 - 1.12100 = 101 pips
Reward: 1.16950 - 1.13101 = ~385 pips
R:R ≈ 1:3.8 — excellent risk-to-reward
📈 Technical Observations
Bullish Momentum: Strong bullish candles leading into the setup suggest buyers are currently in control.
Support Zone (Entry Area):
The purple zone has acted as a previous resistance, now turned support.
Price may retest this zone before moving higher (as indicated by the blue path on the chart).
Moving Averages:
Red (likely 50 EMA) and blue (possibly 200 EMA) are showing a bullish crossover.
Price is above both MAs, reinforcing a bullish trend.
Projected Move:
The setup anticipates a pullback before a continuation to the upside toward 1.16950.
🧠 Trade Idea Summary
This is a buy-the-dip strategy within a bullish trend.
Entering on the pullback allows for:
Tighter stop loss
Better entry price
Higher R:R ratio
⚠️ Risk Considerations
A break below 1.12100 would invalidate the setup.
Monitor for bearish reversal patterns or news around the EUR/USD that might shift sentiment.

"EUR/USD Bullish Breakout & Retest Setup – Targeting 1.10955Instrument: EUR/USD
Timeframe: 30-Minute
Indicators Used:
EMA 30 (Red): 1.09821
EMA 200 (Blue): 1.09698
Key Levels Identified:
Entry Point: 1.09695
Stop Loss: Around 1.09067
Resistance Zone: ~1.09911
Target Zone: ~1.10918 to 1.10955
Projected Gain: ~147.3 pips (1.35%)
Price Action Analysis:
Bullish Breakout:
The price broke out from a consolidation zone (marked in purple).
A bullish trend is forming as price moves above the 200 EMA.
EMAs Alignment:
The 30 EMA is currently above the 200 EMA, indicating a potential bullish trend continuation.
However, price is slightly below the 30 EMA now, suggesting some short-term pullback or resistance.
Retest at Entry Zone:
Price retested the entry zone at 1.09695 after the breakout and is now hovering near it.
This retest is healthy for confirming support before another move up.
Trade Setup Insight:
Entry Strategy: A long (buy) entry at or around 1.09695.
Stop Loss Placement: Below the previous support zone near 1.09067 to manage risk.
Target Strategy: Aiming for the resistance zone around 1.10918–1.10955 for profit booking.
Conclusion:
This looks like a bullish continuation setup with a favorable risk-reward ratio. The confluence of:
EMA support,
Price structure (breakout & retest),
and defined resistance/target zone

EUR/USD Short Setup – Entry at Resistance, Targeting 1.08942"Entry Point: ~1.10456
Resistance Point: ~1.10151
Stop Loss: ~1.10833
Target Point: ~1.08942
Risk/Reward:
Risk: ~37.7 pips
Reward: ~111.4 pips
Approx. R:R = 1:3
Indicators Used:
EMA 30 (red): ~1.09966
EMA 200 (blue): ~1.09607
Price is currently above both EMAs → Generally bullish in the short term, but you seem to be anticipating a reversal from resistance.
Setup Type:
This appears to be a sell setup based on price reaching a key resistance area with rejection signs, possibly a fake-out above resistance before a move down to the target.
⚠️ What to Watch For:
Confirmation Candle: If you're not in the trade yet, look for strong bearish confirmation below resistance to validate the short.
Stop-Loss Placement: It’s placed above the last high in the purple zone – a good defensive move.
EMA Alignment: Since price is above both EMAs, you’re trading against the trend – more aggressive, so extra confirmation is crucial.

EUR/USD Short Trade Setup – Key Resistance Rejection & Bearish TEntry Zone:
The entry for the short trade is around 1.08405 - 1.08412.
The price is expected to rise into this area before reversing downward.
Stop Loss:
Positioned at 1.08760 - 1.08770, above the resistance zone marked in purple.
This ensures the trade is invalidated if price moves too high.
Take Profit Levels (TP):
TP1: 1.07987
TP2: 1.07620
TP3: 1.07107
Final Target: 1.06604
Indicators Used:
200 EMA (Blue Line): At 1.08405, acting as resistance.
30 EMA (Red Line): At 1.08086, showing short-term trend direction.
Overall Trade Idea:
Price is expected to reject the 1.08412 resistance zone and move downward.
If the price respects the resistance, a strong bearish move toward the 1.06604 target is anticipated.
Potential Trade Plan:
Sell at: ~1.08405
Stop Loss: ~1.08760
Take Profit: Staggered at TP1, TP2, TP3, or full exit at 1.06604.

EURUSDCAPITALCOM:EURUSD
As you can see that, EURUSD has created a strong support in 1Hr Time frame. if it gives breakout then we can plan for sell side and always take retest entry. This set-up is for monday (04-09-23),Plan your trade accordingly.....

eurusdCAPITALCOM:EURUSD
As you can see that EURUSD has created a trendline pattern and forming lower low formation.This is for monday (14-08-23) Take retest entry. plan your trade accordingly...

EURUSD CHART 15MIN ANALYISIS 19 JUNEsell after taken out inducement or previous day high and eurusd is now converted into bearish trend so avoid buy setup untill any low sweep

EURUSD CHART LONG TERM ANALYISIS 4 JUNEon daily time frame market is bullish but there is no order block for going market higher high so wait until market sweep the low and create single order block then go to buy for long term.

EURUSD CHART 15MIN ANALYISIS 31 MAYour analysis is accurate and now after taken inducement market fall down and create break of structure now wait for inducement and order block for perfect setup for sell

EURUSD CHART 15MIN ANALYISIS 31 MAYmarket is in bearish trend wait for take inducement than tap on order block or sweep major high then take sell trade

EURUSDCAPITALCOM:EURUSD
EURUSD has creating a Head and Shoulder if it breaks the Drawn neckline then we can plan for sell side and take retest entry. plan your trade accordingly...

EURUSDCAPITALCOM:EURUSD
( For Monday ) As you can see that EURUSD has created Double top in 4 HR time frame and rejection happened at the resistance level, it is good sign that it will come down. Take pull back entries and plan your trade accordingly....

short on eur/usdthis trade is very risky
do short in this trade only small part of your capital
support and resistance marked
se my previous trades
dyor

bullish signal on eur/usdsee in this chart
market is in up trend in 1 day chart and consolating in 15 min or less
so support and resistance is marker
take a long position
dyor

eurusd making new high eurusd has broken its resistance last week which was respecting for the last 6 months now we are expecting a little pullback then move up here horizontal support will play a important role so we have to focus how this support will be valid

EURUSD Down Trend.!#EURUSD Looking for Sell trade setup as I mentioned in the Chart.!
Keep Supporting LIKE, COMMENT And FOLLOW.!
Thank You.!

EURUSD Down Trend.!#EURUSD Looking for Sell trade setup as I mentioned in the Chart.!
Keep Supporting LIKE, COMMENT And FOLLOW.!
Thank You.!

EURUSD Down Trend.!#EURUSD Looking for Sell trade setup as I mentioned in the Chart.!
Keep Supporting LIKE, COMMENT And FOLLOW.!
Thank You.!
