EURUSD - BEARS BACK IN CONTROL?Symbol - EURUSD
EURUSD continues to extend its downward trajectory, maintaining a locally bearish market structure. A decisive breakdown of the nearest support level could accelerate the sell-off, paving the way for fresh lows.
The US dollar remains firm, while the pair shifts its medium-term direction following a breakout from consolidation. The overall structure remains weak, and the decline may extend toward the 1.1400 region.
The primary focus remains on the ongoing consolidation forming within the broader downtrend. Sustained trading below 1.1588 and a daily close beneath 1.1557 would reinforce bearish sentiment, potentially triggering a move toward the liquidity zone at 1.1460 – 1.1400
Resistance levels: 1.1588, 1.1630
Support levels: 1.1557, 1.1461
On the daily timeframe, the market has confirmed a reversal in trend, with a local bearish distribution phase developing. The area of liquidity that may attract price activity lies below 1.1400, suggesting that a medium-term decline remains probable if the price closes beneath 1.1557
Eurusdtradeidea

EUR/USD Bearish Trade Idea - Detailed Analysis** IF you like my observation, please boost and follow for more content."
Timeframe: 1 Hour
Entry Price: 1.16177
Stop Loss (SL): 1.16521
Take Profit (TP): 1.15763
Market Overview:
Trend Context: The EUR/USD pair is currently in a clear downtrend as indicated by the price action making lower highs and lower lows.
Chart Setup: The chart shows a descending triangle pattern, which typically signals a continuation of the bearish trend, as the price struggles to break through the resistance at the upper boundary while consistently making lower lows.
Trade Rationale:
Descending Triangle Pattern:
The formation of a descending triangle indicates a strong bearish bias, where the sellers have been consistently defending the resistance level.
The price is making lower highs and has found support at the 1.16177 level, a key point where the downtrend has previously gained momentum.
A breakdown from this triangle often leads to a continuation of the downward movement, reinforcing the bearish outlook.
Entry Setup:
The entry point at 1.16177 is set below the support level, confirming that the price is likely to break through and continue downward.
A close below this level would provide confirmation for the short position, as the breakdown indicates further downward potential.
Stop Loss Placement:
The Stop Loss (SL) is set at 1.16521, just above the last significant swing high and the trendline of the triangle. This allows for some room in case of a false breakout while minimizing risk if the price reverses above this level.
Take Profit Target:
The Take Profit (TP) is set at 1.15763, where the previous support has been observed. This level represents a logical exit point, based on the measured move of the triangle pattern and the market's reaction at this support area.
Risk-to-Reward Ratio (RRR):
This setup offers a favorable risk-to-reward ratio, with a stop loss of approximately 45 pips and a take profit target of approximately 114 pips. This results in an RRR of about 1:2.5, which aligns with a solid risk management strategy for a favorable trade.
Technical Indicators:
Exponential Moving Averages (EMA):
The chart indicates the use of EMAs, which are still in a bearish alignment. The price is below both the 9-period and 20-period EMAs, suggesting that the overall trend is downward.
The EMA setup confirms the bearish momentum, reinforcing the rationale for the short position.

EURUSD - FALSE BREAKOUT MAY TRIGGER CORRECTIONSymbol - EURUSD
CMP - 1.1431
EURUSD is appreciating amid a weakening US dollar. However, the pair is facing significant resistance and exhibiting signs of a false breakout, which may precede a corrective movement.
EURUSD is currently testing a key resistance zone within a distribution phase and displaying characteristics of a potential false breakout. While the broader market structure remains bullish - evidenced by the pair breaching local resistance and establishing new highs. The failure to sustain upward momentum and the price consolidating below the 1.1418 level may act as a catalyst for a correction. Concurrently, the US dollar is approaching a support level and may initiate a rebound, exerting downward pressure on EURUSD.
Resistance levels: 1.1440, 1.1424, 1.1418
Support levels: 1.1384, 1.1343
Should the currency pair fail to establish a firm position above 1.1424 during the ongoing resistance retest, the likelihood of a downward consolidation increases, potentially presenting an opportunity for short positioning. The anticipated correction could extend toward the identified support zones before the broader uptrend resumes.
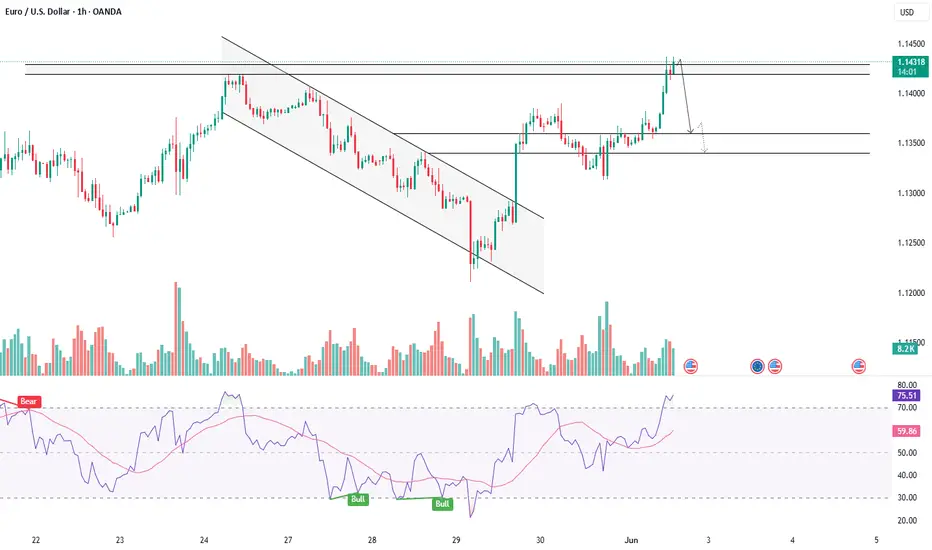
EUR/USD4H Bearish Trade Setup Supply Zone Rejection with 3:1 RRR🔷 Trend Overview
📈 Price was in a rising channel (trend line + support line).
❌ Channel broken on downside → potential trend reversal.
🟧 🔼 Supply Zone (Sell Area)
📍 Zone: 1.13707 – 1.14432
🟠 Price faced rejection here.
💡 Institutional selling likely in this zone.
🔥 This is the ideal short-entry area.
🟦 🔽 Entry Point
🎯 Entry: Around 1.13694
🧩 Sits just below supply zone = safer trigger.
✅ Wait for a bearish confirmation candle before entering.
🟨 Support Level
📉 Support Zone: ~1.13100 – 1.13400
📊 Recently broken with a strong bearish candle.
🧱 Used to act as a floor, now may act as resistance.
🟩 🎯 Target Point
✅ Take Profit: 1.10970
📎 Matches previous structure support.
💰 Lock in profits before the psychological level at 1.1100.
🟥 ⛔ Stop Loss
❌ Stop: 1.14419
📏 Placed above the supply zone for protection.
🛡️ Shields from false breakouts or spikes.
⚖️ Risk-to-Reward Ratio (RRR)
💡 Approx. 3:1 ✅
📉 Risk: ~70 pips
📈 Reward: ~270 pips
🔥 High-probability setup
📌 EMA (Exponential Moving Average – 70)
📍 EMA 70 at 1.13102
🔻 Price is below the EMA → favors bearish momentum
🧠 Pro Tips:
🔍 Watch for bearish engulfing or rejection candles at the entry zone.
🗓️ Be aware of major news events (ECB, Fed).
🧮 Adjust lot size for risk management (based on SL size).
✅ Summary:
🧩 Element 📊 Value
Trade Type 🔻 Short (Sell)
Entry Point 📌 1.13694
Stop Loss ⛔ 1.14419
Take Profit 🎯 1.10970
RRR ⚖️ ~3:1
Sentiment 📉 Bearish

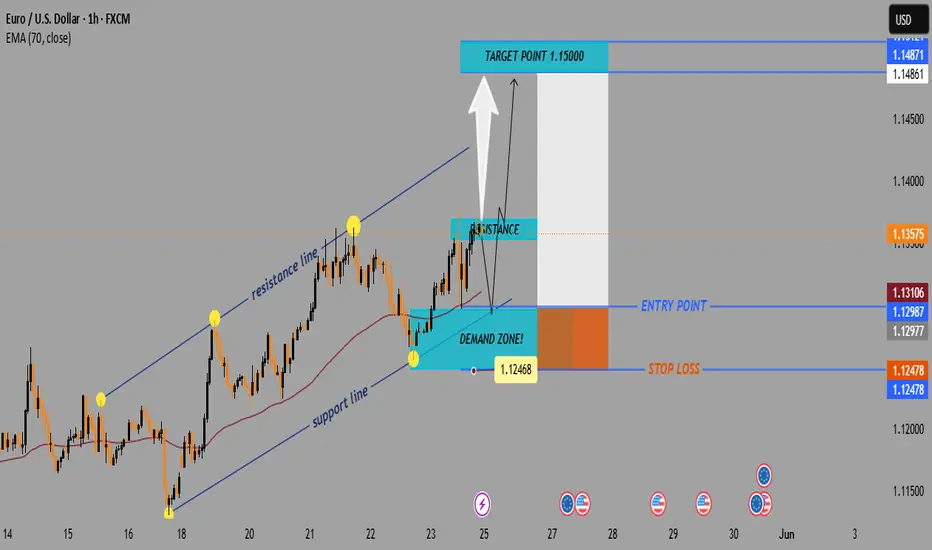
EUR/USD Bullish Trade Setup – Demand Zone to 1.15000 TargetTrend Overview:
↗️ Uptrend Channel
Support Line (Bottom of channel): Holding the upward price movement.
Resistance Line (Top of channel): Price touches and retraces — a key watch level.
Key Zones:
🟦 Demand Zone (BUY Area)
🟢 1.12468 – 1.12987
Strong support.
Price may bounce from here if retested.
Buyers likely to activate here.
🟥 Resistance Zone
🔴 Around 1.13575
Price faces selling pressure.
If broken, could signal a bullish continuation.
Entry & Exit Strategy:
🎯 Target Point: 1.15000 (Marked in blue above)
🚀 Bullish Target
Above the resistance, indicating breakout potential.
📍 Entry Point: 1.12987 – 1.13106
Slightly above the demand zone.
🛑 Stop Loss: 1.12478
Just below the demand zone for risk control.
EMA (70) Line:
📈 Currently at 1.13106
Price is trading above the EMA = bullish signal.
Scenario Summary:
Bullish Setup
✅ Wait for a pullback into the demand zone
✅ Enter near the blue entry area
✅ Target the 1.15000 zone
✅ Risk managed by stop-loss just below demand zone
EUR/USD Bearish Setup: Supply Zone Rejection Toward1.0900 Target(Swing Trade Setup)
📉 Trendline + CHoCH Confirmation
🔻 Downtrend marked by a falling blue trendline.
🔄 CHoCH (Change of Character) shows a bearish market structure shift, confirmed by a lower low.
🟦 Supply Zone (Sell Zone)
💥 Strong seller reaction previously occurred between:
1.12956 – 1.13896
🔹 Wait for price to retrace into this zone.
🎯 Ideal for short entries.
🎯 Entry & Stop-Loss
🔵 Entry Point: Around 1.12956 – 1.13005
(below supply zone and EMA)
🛑 Stop Loss: 1.13896 – 1.13929
(above the last high + supply zone)
🟦 EMA 70 (Purple Line)
📈 Currently at 1.13051
Acts as dynamic resistance — strengthening the short setup.
🏁 Target Zone
🎯 Main Target: 1.09000
Marked as TARGET POINT 1.0900
🟦 Support Levels Inside Target Zone:
1.09229
1.09150
1.08814
✅ Summary of Trade Idea
📍 Short Position
⬆️ Entry: ~1.13000
🛑 Stop Loss: ~1.13900
⬇️ Take Profit: ~1.09000
⚖️ Risk-to-Reward: ~1:3+ potential

EUR/USD Buy Setup1. Entry Point:
Marked at: 1.12243
This is the suggested price level to enter a long (buy) trade.
2. Stop Loss:
Set at: 1.11542
Placed below a support zone, it limits the downside risk if the trade moves against the position.
3. Target Points:
EA Target Point One: 1.13891
EA Target Point (Final): 1.15929
These levels are profit-taking zones, with the first being a conservative target and the second being a more extended move.
4. Technical Indicators:
Moving Averages:
A red shorter-term moving average (possibly 20 EMA)
A blue longer-term moving average (possibly 200 EMA)
Price is currently below both, indicating bearish momentum, though the long setup is anticipating a reversal.
5. Support/Resistance Zones:
Purple Zones: Highlighted as key demand and supply areas.
The lower purple zone supports the entry and stop-loss area.
The upper purple zones mark resistance areas aligning with the target levels.
6. Current Price:
Around 1.12459, slightly above the entry zone.
Conclusion:
This setup is a bullish trade idea with a clearly defined:
Entry (1.12243),
Stop-loss (1.11542), and
Two take-profit levels (1.13891 and 1.15929).

EUR/USD Bullish Reversal Setup – Demand Zone to Target 1.15646🔍 Current Price: 1.13414
📉 EMA (70): 1.13334
Price is slightly above the EMA → Bullish hint ✅
Key Zones & Levels
🟦 Demand Zone:
📍 1.12441 ➡️ 1.12985
Strong buying interest here!
Price bounced from this zone → 📈 Possible reversal
🔵 Entry Point: 1.12985
🛑 Stop Loss: 1.12441
🎯 Target: 1.15646
Trendline Watch
📉 Descending trendline is being tested/broken
🟠 If price holds above the trendline + EMA → CONFIRMATION for long entry ✅
Trade Setup
Buy Entry: 1.12985
TP: 1.15646 🎯
SL: 1.12441 🔻
Risk–Reward Ratio: ~ 1:4.8 ⭐️⭐️⭐️⭐️⭐️
Visual Flow:
🔵 Demand Zone
⬆️
Break EMA & Trendline
⬆️
🎯 Target Zone (1.15646)
Summary:
Looks like a sweet bullish setup from the demand zone!
If price stays above EMA and trendline → Go Long ✅

EUR/USD 1H Trade Setup: Bullish Breakout in PlayCurrent Setup:
Price: 1.15083
EMA (7): 1.15164 (acting as dynamic support)
Trend: Bullish momentum forming.
Entry Zone
RBR Zone (Rally-Base-Rally)
🔵 Entry Point: 1.14958
🟦 Demand zone indicates bullish interest
📍 This is where buyers previously stepped in
Stop Loss Zone
🔻 Stop Loss: 1.14420
❗ Placed below the base of the RBR zone
🛡️ Protects against false breakouts.
Resistance Zone
🔴 Resistance: Around 1.15500
⚠️ Sellers may push back here
⏳ Waiting for a breakout confirmation.
Target Zone
🎯 Target Point: 1.17000
🚀 Bullish breakout goal
✅ Previous resistance level & profit zone.
Visual Trade Plan Summary:
🔽 Entry: 1.14958
❌ Stop Loss: 1.14420
✅ Take Profit: 1.17000
Quick Dotted Recap:
* Entry at demand zone 🔵
* Tight stop loss for risk control 🔻
* Bullish bias with upside potential 🚀
* Wait for candle close above resistance 🔴 before entering aggressively

EURUSD - PRE BREAKOUT CONSOLIDATION - ASCENDING TRIANGLESymbol - EURUSD
CMP - 1.0485
The EURUSD pair continues to display bullish signals, suggesting the potential for sustained upward movement. However, significant resistance lies ahead, and the market is currently undergoing a pre-breakout consolidation phase. The U.S. dollar is experiencing a corrective phase, influenced by economic data, domestic political developments, and indications from both President Trump and Federal Reserve Chairman Jerome Powell regarding the possibility of an imminent interest rate cut.
The euro is benefiting from the weakening dollar, though the duration of this trend remains uncertain, particularly in the context of the ongoing trade tensions between the U.S. and Europe.
From a technical perspective, the current chart suggests a bullish outlook. An ascending triangle is forming within the prevailing uptrend, generally indicative of market optimism. Key focus is placed on the pattern’s base, with resistance located at the 1.0530 level.
Support levels: 1.0450, 1.0400
Resistance levels: 1.0530
Should the dollar continue its downward trajectory, the pair is poised for potential growth. A retest of the trend support level, possibly marked by a false breakout, could occur before a decisive breakout. A successful breakout and sustained consolidation above the 1.0530 resistance level may trigger further upward movement.

EURUSD - EXPECTING UPSIDE AFTER BREAKOUT OF RESISTANCESymbol - EURUSD
CMP 1.0360
EURUSD is attempting to capitalize on the recent correction in the U.S. dollar. The price is currently undergoing a retest of consolidation resistance, aiming for a potential breakout and further upward movement. Following an initial attempt to breach the downtrend resistance, the price entered a consolidation phase, establishing a range between 1.0530 and 1.0210. Within this setup, a local consolidation channel has formed, with the price testing the resistance at 1.0380 The market is still in the process of confirming a trend reversal and seeking to strengthen in the context of the dollar's correction.
The fundamental landscape remains complex, influenced by the Trump's ongoing tariff dispute and the broader economic crisis.
Resistance Levels: 1.0380, 1.0530
Support Levels: 1.0330, 1.0210
A breakout above the 1.0380 resistance level, followed by price consolidation above this area, could signal further growth, driven by the distribution of the accumulated potential.

EURUSD - PRICE ACTION CONFIRMS TREND REVERSALSymbol - EURUSD
The EURUSD currency pair has broken its previous trend, emerging from a consolidation phase and reaching new highs, which signals a definitive shift in market direction. The primary focus now shifts to the resistance zones, where significant market struggles are expected. The ongoing correction of the US dollar, largely driven by political and geopolitical factors, presents opportunities within the forex market. The EURUSD has been strengthening for the past month, suggesting promising prospects, particularly if the dollar's correction continues. This week, attention is on the Federal Reserve's rate decision and the inflation meeting, which could provide further support for the current market movement.
From a technical perspective, the key support level to watch is at 1.0445. If the bulls are able to maintain this support, the price may move towards the 1.0600 - 1.0700 range in the short to medium term.
Resistance levels: 1.0530, 1.0610
Support level: 1.0445
The price has already tested the 1.0445 level. A potential false breakdown could occur, aimed at capturing liquidity, after which the pair is likely to resume its upward momentum, driven by renewed interest from buyers in the euro.

EURUSD - TREND CHANGED ?EURUSD is poised for a potential bullish rally, having broken the extended downtrend and entering a phase of consolidation, which could provide an opportunity for further upward momentum. Although the broader global trend remains bearish, it is premature to discuss a trend reversal, as the price is still facing significant resistance at 1.0440. However, a consolidation base is forming in this area, and if the US dollar continues its corrective movement, EURUSD may have the potential to confirm a trend shift. Should the bulls manage to surpass 1.0448 and establish a firm position above this level, a move towards 1.0610 and potentially higher could be in the cards.
Resistance levels: 1.0450, 1.0610
Support levels: 1.0330, 1.0225
From a technical standpoint, attention is on the immediate level of 1.0450. A breakout and sustained trading above this zone could present an ideal entry point for long positions.

EURUSD SHOWING A GOOD UP MOVE WITH 1:8 RISK REWARD EURUSD SHOWING A GOOD UP MOVE WITH 1:8 RISK REWARD
DUE TO THESE REASON
A. its following a rectangle pattern that stocked the market
which preventing the market to move any one direction now it trying to break the strong resistant lable
B. after the break of this rectangle it will boost the market potential for break
C. also its resisting from a strong neckline the neckline also got weeker ald the price is ready to break in the outer region
all of these reason are indicating the same thing its ready for breakout BREAKOUT trading are follws good risk reward
please dont use more than one percentage of your capitalfollow risk reward and tradeing rules
that will help you to to become a bettertrader
thank you

EURUSD SHOWING A GOOD DOWN MOVE WITH 1:7 RISK REWARDEURUSD SHOWING A GOOD
UP MOVE WITH 1:7 RISK REWARD
DUE TO THESE REASON
A. its following a rectangle pattern that stocked the market
which preventing the market to move any one direction now it trying to break the strong resistant lable
B. after the break of this rectangle it will boost the market potential for break
C. also its resisting from a strong neckline the neckline also got weeker ald the price is ready to break in the outer region
all of these reason are indicating the same thing its ready for breakout BREAKOUT trading are follws good risk reward
please dont use more than one percentage of your capitalfollow risk reward and tradeing rules
that will help you to to become a bettertrader
thank you

EURUSD - TRADE SETUP ON LONG SIDESymbol - EURUSD
EURUSD is currently trading at 1.0854
I'm seeing a trading opportunity on buy side.
Buying EURUSD pair at CMP 1.0854
I will be adding more if 1.0825 comes & will hold with SL 1.0790
Targets I'm expecting are 1.0932 - 1.0980
Disclaimer - Do not consider this as a buy/sell recommendation. I'm sharing my analysis & my trading position. You can track it for educational purposes. Thanks!

EURUSD R:R 1:5CHoCH in LTF
Targeting low.
Hidden Supply.
Please do your own research before entering the trade

Euro Dollar looking Bullish!Recently we saw US dollar getting weak and falling, which made the fundamentals favorable for the dollar crosses like GBP, AUD, EUR , NZD etc. This is an idea to get long on the Euro if the price pulls back a bit to the demand zone and riding the uptrend, which will give a good RR of 1:3.
Note- This is my own trading idea and not a financial advice, trading is highly risky.

EURUSD SHOWING A GOOD DOWN MOVE WITH 1:5 RISK REWARD PERFECT ONEEURUSD SHOWING A GOOD DOWN MOVE WITH 1:5 RISK REWARD
DUE TO THESE REASON
A. its following a rectangle pattern that stocked the market
which preventing the market to move any one direction now it trying to break the strong resistant lable
B. after the break of this rectangle it will boost the market potential for break
C. also its resisting from a strong neckline the neckline also got weeker ald the price is ready to break in the outer region
all of these reason are indicating the same thing its ready for breakout BREAKOUT trading are follws good risk reward
please dont use more than one percentage of your capitalfollow risk reward and tradeing rules
that will help you to to become a bettertrader
thank you

EURUSD 4H ProjectionEURUSD 4H Timeframe Projection.
Daily and Weekly trends are Bullish.
DISCLAIMER: All labeling and wave counts are done by me manually and I will keep changing according to the LIVE MARKET PRICE ACTION. So don't be bias, hope on my trade plans...try to learn, and make your strategy... Following is not that easy...

EURUSD ORDER BLOCK | LONG TRADEHi Trader
Eurusd taken previous 1hr and 4hr liqduity so Buying expected
according to SMC.
5 min CHoCH is best to take Long trade
1:7 Trade
Note - Only for education purpose
GIVE LIKE IF YOU LIKE MY ANALYSIS..

EURUSD SETUP TRADE WIH 1:5 RISK REWARDEURUSD SETUP TRADE WIH 1:5 RISK REWARD
A good selling setup detected on EURUSD
It's showing a BEAR MOVE due to these reason
1. It's following THE 60 M trendline here
2. It's ready to break the neckline
3. In day chat it's showing the heavy BEARISH pressure
Just grab out will your own risk
With a small amount
Stay connected
Stay happy
Bande mataram
EURUSD SETUP TRADE WIH 1:5 RISK REWARD
A good selling setup detected on EURUSD
It's showing a BEAR MOVE due to these reason
1. It's following THE 60 M trendline here
2. It's ready to break the neckline
3. In day chat it's showing the heavy BEARISH pressure
Just grab out will your own risk
With a small amount
Stay connected
Stay happy
Bande mataram

EURUSD 1H Timeframe ProjectionEURUSD 1H Timeframe Projection
DXY - Data Global forecasts say it will decline. Yes, it may, but the dollar is still rising today.
DISCLAIMER: All labeling and wave counts are done by me manually and I will keep changing according to the LIVE MARKET PRICE ACTION. So don't be bias, hope on my trade plans...try to learn, and make your strategy... Following is not that easy...
