UPDATE on previous EURUSD BULLISH IDEA!The price has claimed the highs which was a major level I marked and presented at :- 1.19206.
The TRADE IDEA is COMPLETE!
Congratulations to whoever took this.
Eurusdtrend

EURUSD – 15M | Liquidity Sweep → Demand Reaction →Mean ReversionPrice delivered a clean sell-side liquidity sweep into a higher-timeframe demand zone.
Displacement down exhausted, followed by acceptance and stabilization inside value.
Current structure suggests:
Sell-side taken ✔️
Price reacting from HTF demand ✔️
Expectation: mean reversion toward premium / EQ highs
Plan:
Longs favored only after confirmation on LTF
Ideal entry: sweep + reclaim of intraday lows
Targets aligned toward prior supply / liquidity resting above
Invalidation: clean breakdown and acceptance below demand
Bias stays bullish as long as demand holds.

EURUSD – Clean HTF Discount Zone Re-test With Bullish ContinuatiPrice has returned into a deep HTF discount zone, and the reaction from this area aligns well with my overarching bullish narrative. The marked zones represent the regions where I want to see LTF confirmational behavior before considering any long entries.
The structure remains intact as long as price holds above the lower boundary of the zone. A decisive close below that level will invalidate the bullish bias completely and shift the entire directional expectation.
Bullish Path:
• Price taps into the discount zone
• LTF confirms accumulation / BOS
• Price pushes toward the mid-structure continuation level
• Final objective lies near the upper liquidity pool (DOL), assuming underlying conditions remain unchanged
Key Levels Noted on the Chart:
• Entry Interest: All highlighted zones (LTF confirmation required)
• Mid-structure Expectation: Level where I want price to show EDD for continuation
• Final DOL Target: Only if macro conditions remain aligned
• Bias Invalidation: A clean close below the lower major zone
⚠️ ENTRY CONDITION (IMPORTANT):
I will execute the trade only if the LTF mirrors the structural behavior I’m expecting from the HTF.
No LTF confirmation = No trade.

EUR/USD Trend Analysis: Will Bulls Take Control?EUR/USD Trend Analysis: Will Bulls Take Control?
EURUSD continues to trade inside a broad descending structure that has been active for several weeks, with repeated breaks of structure marking the gradual weakening of bearish momentum. The pair has shown consistent attempts to reclaim internal structure, revealing that sellers are losing dominance at each successive swing.
The recent price action highlights a slowdown in the bearish cycle, with the pair forming a compressed consolidation near the lower boundary of the channel. This type of price behavior typically represents absorption, where liquidity is collected before a potential directional shift. Multiple bullish breaks within the current leg signal that the market is preparing for a transition phase.
The chart illustrates a clear reaction to the most recent liquidity sweep, followed by a controlled reset in order flow. Buyers have stepped in aggressively in previous cycles after similar setups, suggesting that the market is once again positioning itself for a recovery attempt toward higher inefficiencies.
Volume distribution from the left side of the chart shows earlier institutional engagement, and the current region aligns with historical accumulation behaviors seen in prior EURUSD reversals. If the pair maintains strength within this consolidation pocket, the next move could be a bullish repricing wave targeting unmitigated zones above.
Overall, EURUSD is showing signs of shift and structural recovery, with the current pattern favoring a bullish reaction in the coming sessions.

EURUSD - BEARS BACK IN CONTROL?Symbol - EURUSD
EURUSD continues to extend its downward trajectory, maintaining a locally bearish market structure. A decisive breakdown of the nearest support level could accelerate the sell-off, paving the way for fresh lows.
The US dollar remains firm, while the pair shifts its medium-term direction following a breakout from consolidation. The overall structure remains weak, and the decline may extend toward the 1.1400 region.
The primary focus remains on the ongoing consolidation forming within the broader downtrend. Sustained trading below 1.1588 and a daily close beneath 1.1557 would reinforce bearish sentiment, potentially triggering a move toward the liquidity zone at 1.1460 – 1.1400
Resistance levels: 1.1588, 1.1630
Support levels: 1.1557, 1.1461
On the daily timeframe, the market has confirmed a reversal in trend, with a local bearish distribution phase developing. The area of liquidity that may attract price activity lies below 1.1400, suggesting that a medium-term decline remains probable if the price closes beneath 1.1557

EUR/USD Bearish Rejection at Resistance Zone – Target 1.15392📉 EUR/USD 1H Chart Analysis
Trend: The chart is showing a clear bearish trend inside a descending channel (support & rejection lines). Price continues to respect this downward structure.
Resistance Zone: A strong supply/resistance area is marked at 1.16148 – 1.16307 (highlighted in pink). Sellers are likely to defend this zone.
Indicators:
Price is trading below the 70 EMA and 200 EMA, confirming bearish momentum.
EMA crossover suggests continued downward pressure.
Price Action: Recently, a small pullback (yellow highlight) is visible after touching the lower boundary of the channel, indicating a short-term retracement before another bearish push.
Strategy:
📍 Entry: Look for short entries near the resistance zone (1.16148 – 1.16307).
⛔ Stop Loss: Above 1.16456 (previous high / EMA resistance).
🎯 Target: First target 1.15392, aligning with the projected channel support and marked demand area.
✅ Summary:
EUR/USD remains bearish as long as price stays below the EMAs and inside the descending channel. Expect rejection from the resistance zone and continuation to the downside toward 1.15392.

EUR/USD 4H Analysis – Bearish Outlook with Key Levels📉 EUR/USD 4H Analysis – Bearish Outlook with Key Levels 📊
🔍 Overview:
The EUR/USD pair on the 4-hour chart is showing signs of a potential bearish reversal after testing a strong resistance zone near 1.16000. Price action has rejected this area twice (🔴), confirming it as a significant supply zone. The chart now suggests a descending move toward the strong support zone around 1.12000.
🔑 Key Levels:
🟡 Resistance Zone: 1.15700 – 1.16000
Multiple rejections indicate strong selling pressure.
🟦 Mini Support: Around 1.14550
A minor level where price could react short-term, but not a major barrier.
🔻 Mid-Level Target: 1.13653
Potential bounce zone before continuation downward.
🟥 Strong Support Zone: 1.11500 – 1.12200
Previously held as a launch point for a major rally in May; likely to be tested again.
📈 Scenario Outlook:
Bearish Path Expected:
Price is forming a series of lower highs and appears to be losing bullish momentum.
Target Path (Blue Arrows):
A potential drop toward the 1.13653 level is expected, followed by a deeper drop toward the strong support.
Rebound Possibility:
If the strong support holds, we could see a strong bullish bounce 🔄, potentially creating a longer-term buying opportunity.
💡 Conclusion:
EUR/USD is currently in a correction phase. Traders should watch for a confirmed break below 1.14550 for bearish continuation 📉. A drop to the 1.12000 zone may offer a high-probability reversal setup 📊📍.
🔔 Trading Tip:
Use caution around mini support; aggressive sellers may enter on any weak bounce. Wait for confirmation before entering positions. 🧠📉

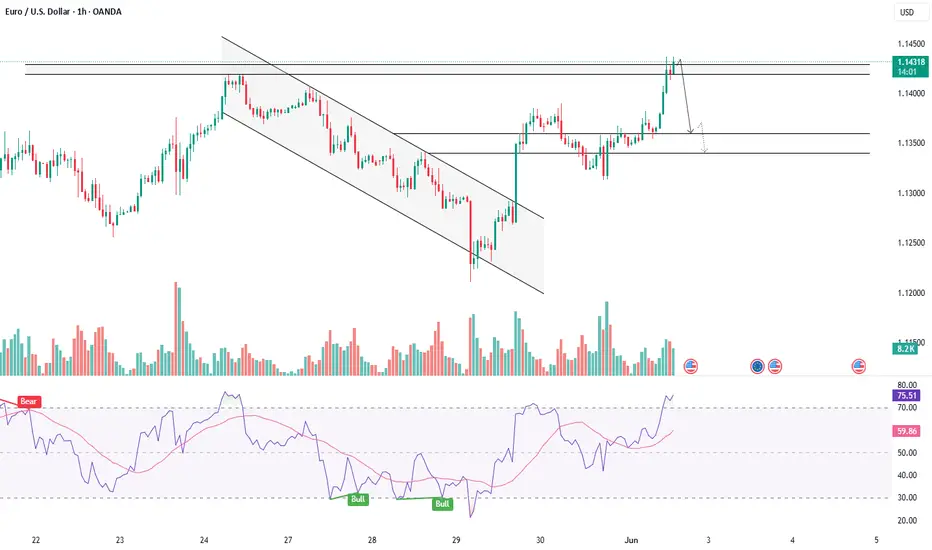
EURUSD - FALSE BREAKOUT MAY TRIGGER CORRECTIONSymbol - EURUSD
CMP - 1.1431
EURUSD is appreciating amid a weakening US dollar. However, the pair is facing significant resistance and exhibiting signs of a false breakout, which may precede a corrective movement.
EURUSD is currently testing a key resistance zone within a distribution phase and displaying characteristics of a potential false breakout. While the broader market structure remains bullish - evidenced by the pair breaching local resistance and establishing new highs. The failure to sustain upward momentum and the price consolidating below the 1.1418 level may act as a catalyst for a correction. Concurrently, the US dollar is approaching a support level and may initiate a rebound, exerting downward pressure on EURUSD.
Resistance levels: 1.1440, 1.1424, 1.1418
Support levels: 1.1384, 1.1343
Should the currency pair fail to establish a firm position above 1.1424 during the ongoing resistance retest, the likelihood of a downward consolidation increases, potentially presenting an opportunity for short positioning. The anticipated correction could extend toward the identified support zones before the broader uptrend resumes.
EUR/USD 4H Chart Analysis – May 29, 2025🔍 Market Structure Overview
Current Price: 1.12753
Key Zone: Price is hovering at a critical resistance-turned-support area.
🧱 Key Levels
Resistance Zone: 1.15639 (🔝 Main Target)
Support Zone: 1.10736 (🔻 Main Target)
Intermediate Zones:
Target One (Bullish): 1.14139 📈
Target One (Bearish): 1.11687 📉
🔄 Scenario Outlook
📈 Bullish Scenario:
If price holds above the 1.1275 zone, we could see a climb towards:
1.14139 (minor target)
1.15639 (major resistance & final target)
🚀 Breakout above could indicate continuation of higher highs.
📉 Bearish Scenario:
Failure to hold above 1.1275 could push price lower:
First support at 1.11687
Final drop towards 1.10736 support zone
🪓 Breakdown could confirm lower low structure.
🧠 Conclusion
This is a decision point zone. Wait for confirmation before jumping in. A strong bullish or bearish candle at this level will dictate the next move. Risk management is key here! 🎯

EUR/USD Long Trade Setup – Buy Zone at 1.12757 with Targets at 11. Entry Point:
1.12757 is marked as the proposed buy entry zone, situated at the bottom of a consolidation range.
The price is currently just above this level, suggesting a potential reversal setup is forming.
2. Stop Loss:
Placed at 1.12413, which is below the support zone. This protects the position if the price breaks down further.
3. Target Points:
EA Target Point One: 1.14207 – this is the first take-profit target, aligned with a previous resistance zone.
EA Target Point: 1.1582 – this is the extended target, aligned with a stronger resistance area from a prior high.
4. Risk-to-Reward Consideration:
Risk: From 1.12757 to 1.12413 (approx. 34 pips).
Reward 1: Up to 1.14207 (approx. 145 pips).
Reward 2: Up to 1.1582 (approx. 306 pips).
This gives an excellent risk-to-reward ratio (>4:1 to the first target, >9:1 to the second target).
5. Market Context:
Price is trading below both the 50-period (blue) and 20-period (red) moving averages, indicating bearish short-term momentum.
However, this strategy anticipates a bounce off support, possibly a reversal or correction to the upside.

"EUR/USD Bullish Setup: Demand Zone Bounce with 205+ Pip Target Current Price:
1.13894 ⚪️ (hovering just above EMA)
Zones & Key Levels:
🔵 Demand Zone (Strong Buy Area)
▪️ 1.13059 – 1.13580
Price bounced here!
➡️ Buyers stepping in!
⚫ Support (Old Resistance, New Support)
▪️ Just above 1.13580
➡️ Important to hold this level for bulls
🟠 Stop Loss
▪️ 1.13059
⚠️ Break below = trade invalid
🎯 Target Point
▪️ 1.15646
🚀 Big upside potential! (~205 pips gain)
Indicators:
📈 EMA (9) = 1.13580
▪️ Price is above it → Bullish sign
Setup Summary:
📍 Entry: Around 1.1389
⛔ Stop Loss: Below 1.13059
🎯 Target: 1.15646
⚖️ Risk-Reward Ratio:
1:2.5+ — Great setup!
Bullish Bias
If price keeps climbing from the demand zone
⬆️ Expect continuation toward 1.15646
But if it breaks down...
⬇️ Watch out below 1.13059

EUR/USD 1H Trade Setup: Bullish Breakout in PlayCurrent Setup:
Price: 1.15083
EMA (7): 1.15164 (acting as dynamic support)
Trend: Bullish momentum forming.
Entry Zone
RBR Zone (Rally-Base-Rally)
🔵 Entry Point: 1.14958
🟦 Demand zone indicates bullish interest
📍 This is where buyers previously stepped in
Stop Loss Zone
🔻 Stop Loss: 1.14420
❗ Placed below the base of the RBR zone
🛡️ Protects against false breakouts.
Resistance Zone
🔴 Resistance: Around 1.15500
⚠️ Sellers may push back here
⏳ Waiting for a breakout confirmation.
Target Zone
🎯 Target Point: 1.17000
🚀 Bullish breakout goal
✅ Previous resistance level & profit zone.
Visual Trade Plan Summary:
🔽 Entry: 1.14958
❌ Stop Loss: 1.14420
✅ Take Profit: 1.17000
Quick Dotted Recap:
* Entry at demand zone 🔵
* Tight stop loss for risk control 🔻
* Bullish bias with upside potential 🚀
* Wait for candle close above resistance 🔴 before entering aggressively

EUR/USD Bullish Breakout – Trade Setup & AnalysisTrendline Breakout
🔹 Price has broken above a descending trendline, signaling a bullish move.
📊 Trade Setup:
🟢 Entry Point: 1.08621
🟡 TP1: 1.08895
🔵 Target: 1.09612
🔴 Stop Loss: 1.08270
📈 Market Outlook:
✅ Bullish bias as long as price stays above 1.08621.
🚀 If momentum holds, the next key resistance is 1.09190, followed by the final target at 1.09612.
⚠️ Risk Managed: Stop-loss at 1.08270 to limit downside risk.
🔎 What to Watch:
🟠 If price retests 1.08621 and holds, it may be a good buy confirmation.
🔺 Breaking 1.09190 could trigger more upside momentum.

Monstrous Volatility following Tariffs and NFP ForecastsHello Traders, It's that time of the month! :D Not what you are thinking.. But It's NFP Week! What an eventful week it's been already for the Euro. 450 Pips and we still have 3 more trading sessions to complete. I looked back two years and still did not find a week of matched volatility. A Major upside push has seen EurUsd tear it's way back from the depths of near Par (1.04) to well back inside the Monthly range between 1.104 and 1.056.
Trump Tarriff speeches, and fueled further by weak U.S. ADP data on Wednesday has given the Euro a monstrous exscuse to gain more value than it's seen in Years aginagst the dollar. Prepare for a wild end of the week with Jobs data forecasted to improve slighlty across the past data point.
What prices do we like moving into NFP day?
-Bullish targets are a tap into 1.08740, Weekly Resistaance Level
-Bearish targets could be 1.074
Otherwise we have some 1hr and 4hr Zones in the middle which could provide good risk/reward trade ideas.
Please leave a Rocket if you enjoyed and Follow for more Analysis.

EURUSD - PRE BREAKOUT CONSOLIDATION - ASCENDING TRIANGLESymbol - EURUSD
CMP - 1.0485
The EURUSD pair continues to display bullish signals, suggesting the potential for sustained upward movement. However, significant resistance lies ahead, and the market is currently undergoing a pre-breakout consolidation phase. The U.S. dollar is experiencing a corrective phase, influenced by economic data, domestic political developments, and indications from both President Trump and Federal Reserve Chairman Jerome Powell regarding the possibility of an imminent interest rate cut.
The euro is benefiting from the weakening dollar, though the duration of this trend remains uncertain, particularly in the context of the ongoing trade tensions between the U.S. and Europe.
From a technical perspective, the current chart suggests a bullish outlook. An ascending triangle is forming within the prevailing uptrend, generally indicative of market optimism. Key focus is placed on the pattern’s base, with resistance located at the 1.0530 level.
Support levels: 1.0450, 1.0400
Resistance levels: 1.0530
Should the dollar continue its downward trajectory, the pair is poised for potential growth. A retest of the trend support level, possibly marked by a false breakout, could occur before a decisive breakout. A successful breakout and sustained consolidation above the 1.0530 resistance level may trigger further upward movement.

EURUSD - EXPECTING UPSIDE AFTER BREAKOUT OF RESISTANCESymbol - EURUSD
CMP 1.0360
EURUSD is attempting to capitalize on the recent correction in the U.S. dollar. The price is currently undergoing a retest of consolidation resistance, aiming for a potential breakout and further upward movement. Following an initial attempt to breach the downtrend resistance, the price entered a consolidation phase, establishing a range between 1.0530 and 1.0210. Within this setup, a local consolidation channel has formed, with the price testing the resistance at 1.0380 The market is still in the process of confirming a trend reversal and seeking to strengthen in the context of the dollar's correction.
The fundamental landscape remains complex, influenced by the Trump's ongoing tariff dispute and the broader economic crisis.
Resistance Levels: 1.0380, 1.0530
Support Levels: 1.0330, 1.0210
A breakout above the 1.0380 resistance level, followed by price consolidation above this area, could signal further growth, driven by the distribution of the accumulated potential.

EURUSD - PRICE ACTION CONFIRMS TREND REVERSALSymbol - EURUSD
The EURUSD currency pair has broken its previous trend, emerging from a consolidation phase and reaching new highs, which signals a definitive shift in market direction. The primary focus now shifts to the resistance zones, where significant market struggles are expected. The ongoing correction of the US dollar, largely driven by political and geopolitical factors, presents opportunities within the forex market. The EURUSD has been strengthening for the past month, suggesting promising prospects, particularly if the dollar's correction continues. This week, attention is on the Federal Reserve's rate decision and the inflation meeting, which could provide further support for the current market movement.
From a technical perspective, the key support level to watch is at 1.0445. If the bulls are able to maintain this support, the price may move towards the 1.0600 - 1.0700 range in the short to medium term.
Resistance levels: 1.0530, 1.0610
Support level: 1.0445
The price has already tested the 1.0445 level. A potential false breakdown could occur, aimed at capturing liquidity, after which the pair is likely to resume its upward momentum, driven by renewed interest from buyers in the euro.

EURUSD - SWING TRADE IDEA ON LONG SIDESymbol - EURUSD
EURUSD is currently trading at 1.0645
I'm seeing a trading opportunity on buy side.
Buying EURUSD pair at CMP 1.0645
I will be adding more if 1.0600 comes & will hold with SL 1.0570
Targets I'm expecting are 1.0750 - 1.0800 - 1.0860 & above
Disclaimer - Do not consider this as a buy/sell recommendation. I'm sharing my analysis & my trading position. You can track it for educational purposes. Thanks!

EURUSD possible breakout previous swing high
I am looking for swing trade in intraday follow by breakout

EURUSD SHOWING A GOOD DOWN MOVE WITH 1:7 RISK REWARDEURUSD SHOWING A GOOD
UP MOVE WITH 1:7 RISK REWARD
DUE TO THESE REASON
A. its following a rectangle pattern that stocked the market
which preventing the market to move any one direction now it trying to break the strong resistant lable
B. after the break of this rectangle it will boost the market potential for break
C. also its resisting from a strong neckline the neckline also got weeker ald the price is ready to break in the outer region
all of these reason are indicating the same thing its ready for breakout BREAKOUT trading are follws good risk reward
please dont use more than one percentage of your capitalfollow risk reward and tradeing rules
that will help you to to become a bettertrader
thank you

EURUSD - TRADE SETUP ON LONG SIDESymbol - EURUSD
EURUSD is currently trading at 1.0854
I'm seeing a trading opportunity on buy side.
Buying EURUSD pair at CMP 1.0854
I will be adding more if 1.0825 comes & will hold with SL 1.0790
Targets I'm expecting are 1.0932 - 1.0980
Disclaimer - Do not consider this as a buy/sell recommendation. I'm sharing my analysis & my trading position. You can track it for educational purposes. Thanks!

EURUSD - POSITIONAL TRADE FOR HUGE PROFITSymbol - EURUSD
EURUSD is currently trading at 1.11900
My short setup has formed in EURUSD & I'm seeing a trading opportunity on sell side.
Shorting EURUSD pair at CMP 1.11900
I will be adding more position if 1.12300 comes & will hold with SL 1.12850
Targets I'm expecting are 1.10200 - 1.09150 - 1.07700
Disclaimer - Do not consider this as a buy/sell recommendation. I'm sharing my analysis & my trading position. You can track it for educational purposes. Thanks!

EURUSD R:R 1:5CHoCH in LTF
Targeting low.
Hidden Supply.
Please do your own research before entering the trade
