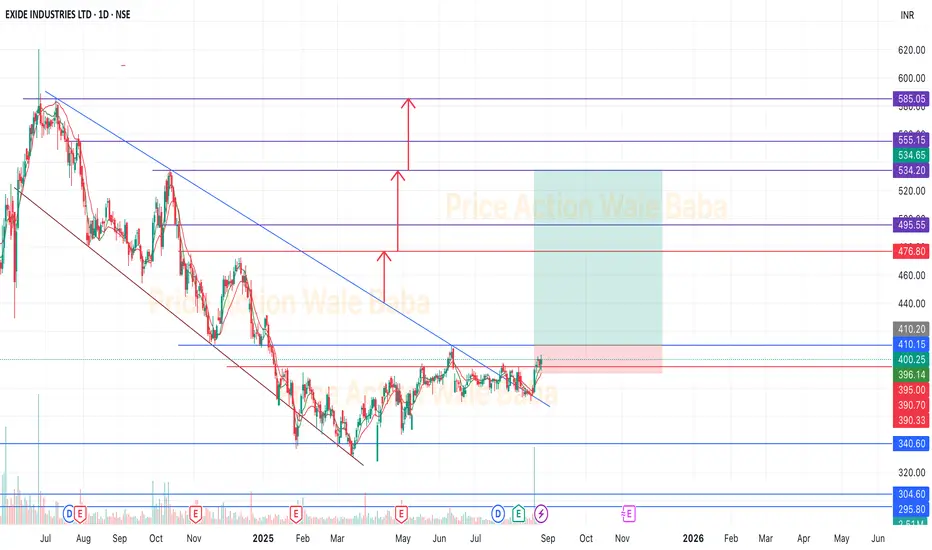
ExideExide is near breakout.
Looks good to buy on dip. In short term, it can give the good returns.
Company under power sector and making batteries for two and four wheeler. So, diwali sales can grow and give good result.
Exideindustries
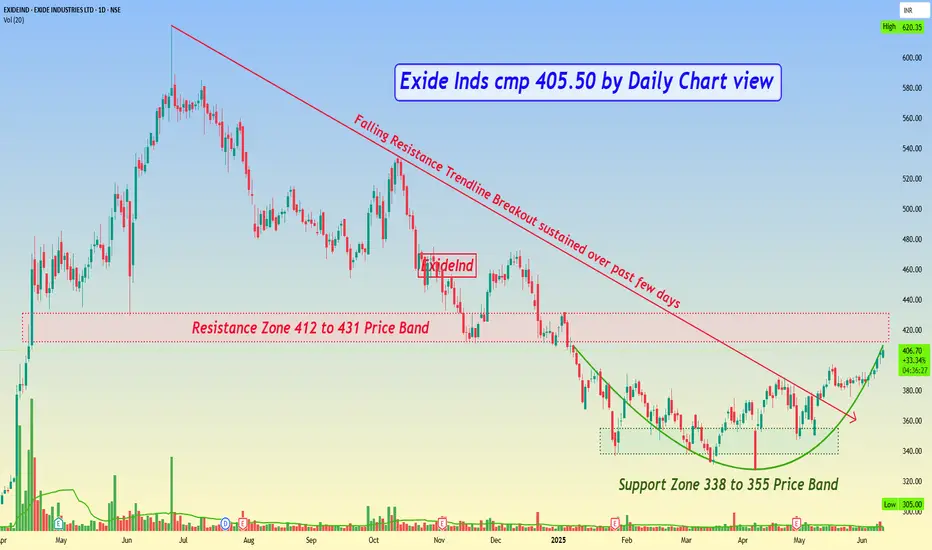
Exide Inds cmp 405.50 by Daily Chart viewExide Inds cmp 405.50 by Daily Chart view
- Support Zone 338 to 355 Price Band
- Resistance Zone 412 to 431 Price Band
- Falling Resistance Trendline Breakout sustained over past few days
- Bullish Rounding Bottom pattern done with Resistance Zone neckline hurdle
- Volumes in close sync with avg traded quantity over past few days with intermittent spikes
EXIDE ready to give 10% upsideCUP formation in W and in the process of completion.
Taken MA supports.
RSI divergence indicating trend is gradually turning positive.
SL at 365 with target of 425.

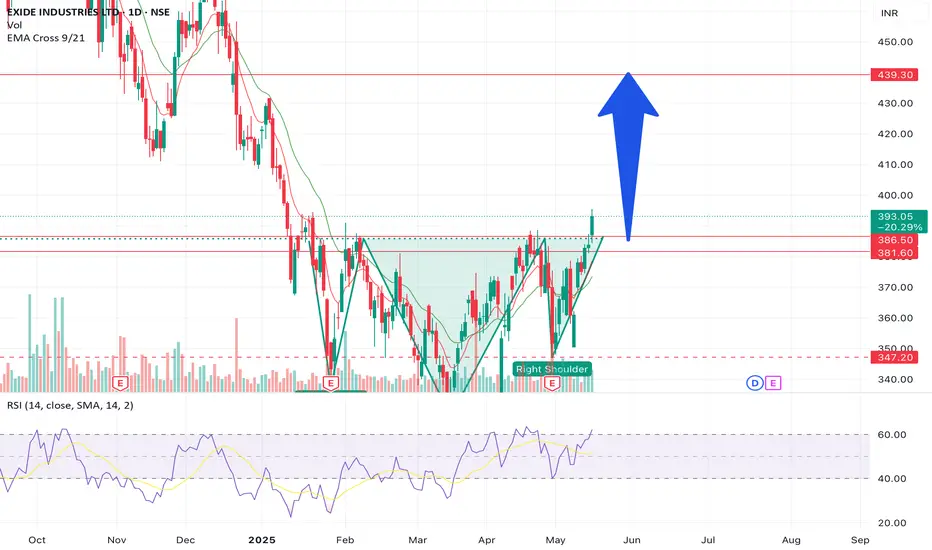
Exide Industies set for minimum 10% up moveIt has broken the neckline of H&S pattern with a bullish engulfing candle. The expected upside may be till 439. The price can come to test the level of 386 - 382 level. Good buy option keeping short term view on upside.
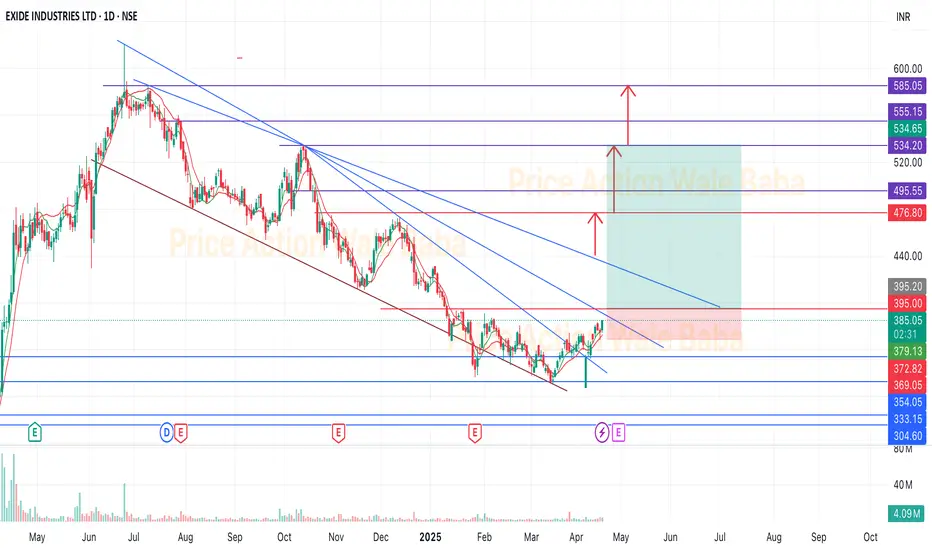
ExideExide near the breakout and looks. good for the up side.
This is bottom out stock and ready to go up.
It's time to buy and hold for the next 6-12 months to take ATH target.
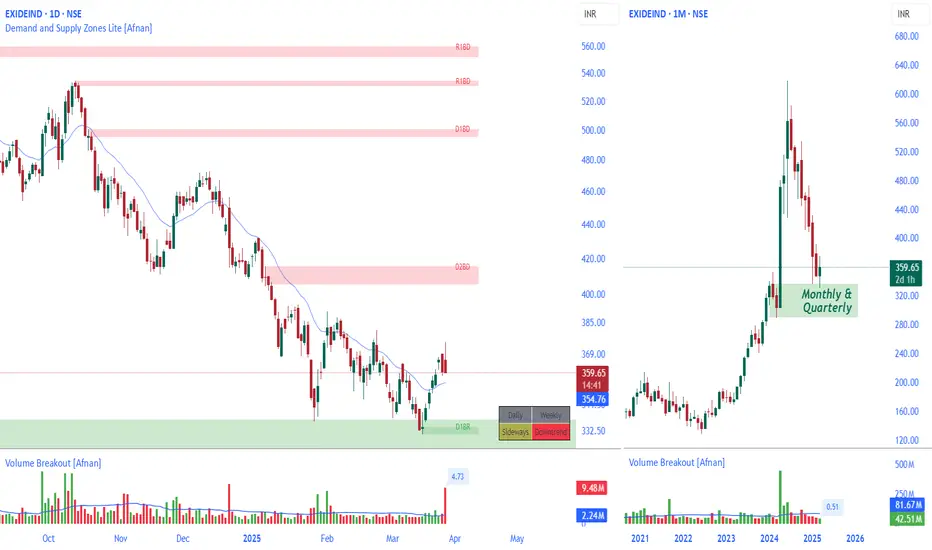
EXIDEIND: A Potential Reversal from Institutional Demand Zone?EXIDEIND has been in a downtrend since June 2024. However, an interesting development has occurred—price has reached a crucial monthly & quarterly demand zone , which is often a footprint of institutional activity. When price enters such zones, it indicates that big players (institutions, banks, and hedge funds) might be accumulating positions.
As a result, the downtrend has stalled , and the stock has moved into a sideways consolidation . This shift suggests that institutional buyers may have stepped in, absorbing the selling pressure and preventing further decline.
📊 Key Observations
EXIDEIND has taken support from both the monthly and quarterly demand zones , strengthening the case for a potential upward move.
The trend is still sideways on the daily timeframe , indicating a phase of accumulation or consolidation before the next big move.
If the price sustains above this demand zone, we may expect an upward move in the coming sessions .
💡 "The market rewards patience and discipline. Stick to your plan and let the charts guide your way!"
This analysis is for educational purposes only and is not intended as a trading or investment recommendation. I am not a SEBI registered analyst.
EXIDE: Must be on RadarWait for the price to tap in the demand zone and then we plan for a entry for now, just keep on eye on it.
⚠️ Disclaimer: This is NOT a buy/sell recommendation. This post is meant for learning purposes only. Views are personal. Please, do your due diligence before investing.⚠️
💬 Drop your thoughts below in the comments section if you liked this analysis!✌️
🔥Happy trading!✅🚀

EXIDEIND - opportunity for quick 5% gainsNSE:EXIDEIND
cmp 364
there is an opportunity for getting quick 5% gains in this stock.
on hourly timeframe there is trendline breakout plus positive diversion on the RSI
I will be looking for entry at cmp 364 with target of 382-385
SL will be 353.
The objective of this analysis is knowledge sharing and education. There isn't any buy or sell advise in this article.
It is expected of each person to carry out own research and evaluation to ascertain whether my perspective is matchingwith your studies.

Exide Short | 19 Dec | IntradayExide is weak in hourly timeframe
As Explained in chart once price get rejected from supply zone or Break swing low. We will look for 440 as target.
Explained in chart as well with levels.

Exideind | All Resistance Trendline Breakout ⭕️ Swing Trading opportunity: Price Action Analysis Alert !!!⭕️
💡✍️Technical Reasons to trade or Strategy applied :-
✅Inverted Head & Shoulder Chart Pattern Bull Breakout
✅Breakout confirmed
✅Rise in Volume
✅Good 3 touches Trendline Breakout with volume
✅Clear uptrend with HH & HLs sequence
✅ Order block as potential Target
✅Check out my TradingView profile to see how we analyze charts and execute trades.
🙋♀️🙋♂️If you have any questions about this stock, feel free to reach out to me.
📍📌Thank you for exploring our idea! We hope you found it valuable.
🙏FLLOW for more !
👍LIKE if useful !
✍️COMMENT Below your view !

EXIDEIND Trading Within Fresh Demand ZoneEXIDEIND is currently trading at ₹418.1, positioned within its demand zone between ₹423.65 and ₹398.85, identified on 16th April 2024. This zone remains fresh and untested, suggesting potential buying interest if the stock price consolidates within this range. Investors may look for signs of support, potentially signaling an upward movement from these levels.

Amara Raja Energy for 60% gainsDate: 30 Oct’24
Symbol: ARE_M
Timeframe: Daily
Amara Raja Energy & Mobility seems to have begun Wave V of 3 which is heading towards 2150 (60% from current price of 1350) as seen in the chart. Once it has crossed 1450, its five waves can be established. Both volume pop out and RSI strength support this view.
This is not a trade recommendation. Please do your own analysis.
HINGLISH VERSION
Aisa prateet hota hai ki Amara Raja Energy & Mobility ne 3 ki Wave V shuroo kar di hai jo 2150 (vartamaan price se 1350 se 60%) ki taraf badh rahi hai, jaisa ki chart mein dekha gaya hai. Ek baar jab yah 1450 ko paar kar jae, to iski 5 Wave sthaapit ki ja sakti hain. Volume pop out aur RSI ki majbooti donon is drshtikon ka samarthan karte hain.
Yah koi trade lene ki salah nahin hai. Kripya apna vishleshan khud karen.

STOCK ON RADAR - EXIDE INDUSTRY According to the radar, Exide industries stock has given a good upside move on daily time frame. The fundamental of the company is also good in the last quarter result.....
View ' - Long Side
Chart Time - 1 day
CMP - 530.50
Demand Zone - 440
Supply Zone - 620
buy at 530 and take profit at 620.....

Exide Symmetrical triangle breakoutExide is showing strong technical pattern breakout. It is expected to touch 620 and possibly 650/700 as per chart.

Exide Industries Breakout & Retest | Swing Trade IdeaExide Industries has recently broken a counter trendline and is currently retesting the breakout level. The stock has also breached the mother candle, but it remains inside a parallel channel that could act as resistance. Keep an eye on how the price reacts within the channel – a breakout above could open up new opportunities, but the channel resistance may cause hesitation. Manage your risk and stay aware of the overall market structure before making a move.

EXCIDE ASCENDING TRIANGLE BREAKOUTExcideIndustreise breaking ascendig triangle pattern
with volume spike and strong rsi
trading above 20ema
#target 600
EDUCATIONAL IDEA ONLY

Exide IndustriesBuy above 515.
All important points are marked.
𝐃𝐢𝐬𝐜𝐥𝐚𝐢𝐦𝐞𝐫: 𝐈𝐧𝐯𝐞𝐬𝐭𝐦𝐞𝐧𝐭 𝐢𝐧 𝐬𝐞𝐜𝐮𝐫𝐢𝐭𝐢𝐞𝐬 𝐦𝐚𝐫𝐤𝐞𝐭 𝐚𝐫𝐞 𝐬𝐮𝐛𝐣𝐞𝐜𝐭 𝐭𝐨 𝐦𝐚𝐫𝐤𝐞𝐭 𝐫𝐢𝐬𝐤𝐬, 𝐫𝐞𝐚𝐝 𝐚𝐥𝐥 𝐭𝐡𝐞 𝐫𝐞𝐥𝐚𝐭𝐞𝐝 𝐝𝐨𝐜𝐮𝐦𝐞𝐧𝐭𝐬 𝐜𝐚𝐫𝐞𝐟𝐮𝐥𝐥𝐲 𝐛𝐞𝐟𝐨𝐫𝐞 𝐢𝐧𝐯𝐞𝐬𝐭𝐢𝐧𝐠. 𝐒𝐭𝐨𝐜𝐤𝐬 𝐬𝐮𝐠𝐠𝐞𝐬𝐭𝐞𝐝 𝐢𝐧 𝐭𝐡𝐢𝐬 𝐠𝐫𝐨𝐮𝐩 𝐚𝐫𝐞 𝐟𝐨𝐫 𝐞𝐝𝐮𝐜𝐚𝐭𝐢𝐨𝐧 𝐩𝐮𝐫𝐩𝐨𝐬𝐞. 𝐖𝐞 𝐝𝐨𝐧𝐭 𝐦𝐚𝐤𝐞 𝐚𝐧𝐲 𝐩𝐫𝐨𝐟𝐢𝐭𝐬 𝐟𝐫𝐨𝐦 𝐭𝐡𝐢𝐬 𝐫𝐞𝐜𝐨𝐦𝐦𝐞𝐧𝐝𝐚𝐭𝐢𝐨𝐧𝐬 𝐞𝐯𝐞𝐫𝐲𝐭𝐡𝐢𝐧𝐠 𝐬𝐡𝐚𝐫𝐞𝐝 𝐡𝐞𝐫𝐞 𝐚𝐫𝐞 𝐜𝐨𝐦𝐩𝐥𝐞𝐭𝐞𝐥𝐲 𝐨𝐟 𝐟𝐫𝐞𝐞 𝐨𝐟 𝐜𝐨𝐬𝐭.

EXIDEIND trendline breakoutExideind trendline breakout from falling wedge
positive crossover in MACD
Above 500 upside potential is 530+ in medium term
Disclaimer : I am not SEBI registered.

Stock Bullish Reversal | Trendline BreakoutExide stock has a trendline breakout. RSI near 60. MACD is positive crossover and stochastic is also positive crossover and Elliott Wave done ABC correction.
I have only shared my study. There is no recommendation. If you buy or sell only after consulting your financial advisor.

EXIDEIND swing trade IdeaEXIDEIND is an uptrend stock. It broke trendline with good volumes.
Can take a swing trade with a target of recent high.
Stoploss is given for safe trader and aggresive trader.
Positions to be taken with proper risk management only.
Note : No idea about its Fundamentals and should always consider market breadth while taking swing trades.

Exide Ind - Sideways to BullishMajor break of Trend line already done
Change of Structure already done
Making 2 HH Hls already done
Stock has finally managed to change the trend and broken the major resistance area of 470-75
Still it is in a supply zone but looks like it will be a good buy if it comes back to 475 area as resistance will now because a major support
As even there will a trend line support in the same area, So it will a good trade with excellent Risk Reward
Wait & Watch

Bullish reversal from its strong support level with good Vol.NSE:EXIDEIND The stock started a bullish reversal from its strong support level with good Volumes. RSI is also supportive. A sustained move beyond 515 would lead to a strong up move shortly.
Trade activated Above the 515 level, Target 657, Stop loss 453.
Check out my other stock ideas below until this trade gets activated, I would love your feedback.
Disclaimer: This analysis is intended solely for informational and educational purposes and should not be interpreted as financial advice. It is advisable to consult a qualified financial advisor or conduct thorough research before making investment decisions.
