How Foreign Investors Manipulate Indian MarketsHello Traders!
Have you ever wondered why the market suddenly falls on a good news day? Or why Nifty rallies when retail traders are bearish? Welcome to the hidden world of FII (Foreign Institutional Investors) activity . Today, let’s uncover how foreign investors can influence and sometimes manipulate the Indian stock market .
Understanding this flow can help you avoid traps and trade smarter with the big players — not against them.
How FIIs Influence the Market
Massive Buying/Selling Power:
FIIs bring in huge capital. Their bulk orders can drive up or drag down prices in minutes, especially in index-heavy stocks.
Volume & Volatility Triggers:
Sudden large orders create volatility. This can trigger stop losses of retail traders and cause panic moves — which FIIs use to build better positions.
Fake Breakouts or Breakdowns:
FIIs often create false moves near key technical levels to trap breakout traders — only to reverse and move in the opposite direction.
Derivative Game:
Through futures & options, FIIs often hedge or create pressure in Nifty/Bank Nifty, giving them leverage to distort short-term price action .
Why FIIs Manipulate (and What They Want)
Better Entry/Exit Prices:
Creating temporary fear or euphoria helps them enter at lower prices or book profits near tops.
Controlling Sentiment:
Big players understand retail psychology. They use media, market moves, and timing to control sentiment and positioning .
Liquidity Advantage:
They need volume to exit large positions — so they often create the volume by triggering retail orders .
Rahul’s Tip
Track FII data daily — not blindly, but with structure. Look at cash flow, derivatives positioning, and sectors being rotated. And remember: The smart money enters when retail panic or celebrates.
Conclusion
Foreign investors have the power to move markets — but not randomly. They act with logic, timing, and structure. By aligning yourself with their footprints instead of fighting them, you can trade with higher accuracy and confidence.
Do you track FII data in your analysis? Share your views below — let’s decode their strategy together!
FII

02 Jan 25 - Direct stance change from bearish to bullish---
Nifty Stance Bullish ⬆
In the last post mortem report, I did indicate the change of stance if Nifty goes above 24177. Nifty has a close of 24188 (weighted average) and 24167 (traded value) - so I cannot say with a 100% guarantee if we got a real close above 24177 or not. The 445 pts ~ 1.88% move today gives nifty a direct stance change from bearish to bullish (no neutral stance).
We are up 409pts ~ 1.72% of which 445pts came today, which also means that the stance was bearish till the 2nd of Jan 2025. What happened today is beyond comprehension, I am almost sure that none of the traders were ready for the move like this.
Nifty has moved 728pts intra week of which 445pts came today.
The USDINR chart is also relevant here, especially the mega move once we got a governor change. I think this is an inflection point and a weakening rupee (no firefighting by the RBI) is good for inflows.
Returning to the Nifty report, a fall below 23931 will shift my stance back to bearish so it is pretty important that Nifty holds the level today. If we continue to go up the crucial resistance levels would be 24348 and 24547. I hope we do not go above 24650 for the current expiry.
---
The change in regulations is hitting professional traders more than the entry level retail ones. SEBI's new set of rules was implemented to turn off the small traders and since most of them do the options buying, the impact is not that much. The professional traders on the other hand are really going crazy as the new margin requirements are not at all helping.
When you take out the professional traders from the equation, they would prefer to trade on forex, crypto or the US options than the Indian counterpart. It is just a matter of time before we see the intellectual migration to the mother market. The whine and the roar on X is proof that influencers have started talking about alternate trading options. Personally, I feel if most of them get access to a stable market - they would not hesitate to migrate.

IDBI BANK - BREAKOUT WITH HEAVY VOLUMEHi All,
This idea is about IDBI Bank Ltd
Price action has given a strong breakout with very heavy volume which indicates institutional buying. Even the shareholding pattern indicates increase in FII and DII buying with lesser retail participation
Good profit growth of 19% CAGR over last 5 years with a healthy dividend payout of 19%
Increase in Reserves which indicates higher Book Value and fairly valued at 17.8 PE
Other fundamentals
Market Cap
₹ 1,12,062 Cr.
Current Price
₹ 104
High / Low
₹ 107 / 57.8
Stock P/E
17.8
Book Value
₹ 47.5
Dividend Yield
1.44 %
ROCE
6.23 %
ROE
11.8 %
Face Value
₹ 10.0
Equity capital
₹ 10,752 Cr.
No. Eq. Shares
1,075
EPS
₹ 5.85
Promoter holding
94.7 %
Change in Prom Hold
0.00 %
Chg in Prom Hold 3Yr
0.00 %
Pledged percentage
0.00 %
Market Cap to Sales
4.27
Sales growth
15.1 %
PEG Ratio
0.94
EVEBITDA
17.4
Quick ratio
2.23
Trade receivables
₹ 0.00 Cr.
Sales
₹ 26,252 Cr.
Debt to equity
5.77
Price to book value
2.19
Free Cash Flow
₹ -1,448 Cr.
CMP / FCF
783
Happy Investing!
Thanks,
Stock-n-Shine

25 Jan ’24 — Unusual last 30mts of price action, could be a NEWSNifty Analysis - Stance Neutral ➡️
Recap from yesterday: ”The issue for the bears from the 63mts chart is the W formation (double bottom). To prove they are still in the game, the Bears must create a big fall and ensure an M pattern supersedes the W. Due to the momentum the bulls got today, we are changing the stance from bearish to neutral. The first target would be to take out the 214991 resistance and nullify the 5 RED candles formed on 23rd. If we were to move downwards, the swing low of 21372 has to be taken out tomorrow itself.”
4mts chart
The main objective of the morning session was spent undoing the bullish surge yesterday. The selling pressure got arrested by 11.00, by then we had already fallen 214pts ~ 1.00%. We then had a quick surge till 11.39 followed by a gradual coo off. The LOD remained at 21247 proving that the BEARS are still in the game. What surprised all of us is the price action in the last 30mts. It did not look like a technical action, most likely it could be a news/event that broke out to a select group of people or insiders. Hope we get some clarity on that by Monday when we reopen.
63mts chart
Yesterday’s W pattern is no longer valid as today’s action has nullified it. Our stance continues to be neutral with a slight inclination to the bearish side. Seems like FIIs are not done unwinding their positions - the run-up to the Budget 2024 looks interesting.

19 Jan ’24 — Holiday Change at 7 PM? SAT working & Monday OFFNifty Analysis - Stance Neutral ➡️
Recap from yesterday: “Today’s price action has confirmed that the channel is broken, but not the support/resistance of 21491. If Nifty trades above 21491 in the morning session — the bears may really feel abandoned. Ideally, the next stop should be 21041 — that was where Nifty bounced off from the trendline on 21st Dec 2023.”
The entire price action for today was totally odd. No, I am not saying this because I lost money trading today. Firstly, the decay was not there on option strikes. Secondly, The far OTM strikes of BankNifty closed at values higher than yesterday - that is a huge anomaly. Nifty OTM PUTS closed at values higher than yesterday that too when the underlying moved up 160pts ~ 0.75%.
Everything made perfect sense when the news broke out that stock markets will be fully functional tomorrow 20th Jan and we will be closed on 22nd Jan Monday. Seems like we are making a fool of ourselves. Was this information passed on to the institutional desk in advance? Will the FIIs now work tomorrow and undo the positions they took for today? How will they hedge the trades as Depository Receipts will be closed on Saturday? The first thing any foreign investor would want is stability and things like these can hamper confidence.
4mts chart
The open was right at the ascending channel lower trend line and our view of bearishness was still relevant as we did not breach that resistance. Interestingly, we were not falling either. FII data for today, a sell value of 3689 crore made no impact on Nifty today. Assuming a segment of people knew what was going to happen with the shift of holidays. Nifty managed to hold its ground today and because of that - we have to change the status to neutral from bearish.
63mts chart
The last 3 candles almost gave away the clue that bearishness was ending. We would still like to see how Nifty will open tomorrow. Ideally, it should open above 21698 i.e. within the channel to cement the idea that Bears are thrown out of control. Also, there will be a portion of traders who would have not taken positions assuming Monday is a working day - speculating a small FOMO effect could misprice the options during the opening minutes.

18 Jan ’24 — FIIs sold 20000 CR in 2 days, Nifty50 in trouble?Nifty Weekly Analysis
Between the last expiry and today, Nifty has only fallen 191pts ~ 0.88%. This does not seem to showcase what really happened during this week. We hit a new lifetime high of 22124 and then fell 839pts ~ 3.8% in 2 days. Something that we rarely see with Nifty.
16mts chart
Nifty Analysis - Stance Bearish ⬇️
Recap from yesterday: “Yesterday Nifty was at the top end of the ascending channel and today it closed right at the bottom end. From 26th Oct 2023, Nifty has always respected the bottom part of the ascending channel. The next support comes up at 21491 and falling below that would also mean we are breaking the channel.”
4mts chart
The gap down ensured we broke the support at 21491. Further price action suggested that we may have some deep cuts today, but strangely Nifty reversed right at 10.00 at 21285 level. Not sure whether it was DIP buying, but we went past the resistance zone of 21491 by 11.59. Nifty did not have enough strength to get back into the ascending channel - but it managed to close near the SR level showing some respite.
FIIs sold over 20000 crores of equity over the last 2 days. When was the last time we had this high volume of selling? 20-25k crore is the approx. volume of transactions they do for a whole month - we got that in 2 days. What do they know that we retail traders don't?
63mts chart
Today’s price action has confirmed that the channel is broken, but not the support/resistance of 21491. If Nifty trades above 21491 in the morning session - the bears may really feel abandoned. Ideally, the next stop should be 21041 - that was where Nifty bounced off from the trendline on 21st Dec 2023. Our stance continues to be bearish until proven wrong.

30th Nov ’23 - Good and Volatile Monthly Expiry Nifty PostMortemNifty Today Analysis
Recap from yesterday: “I still continue to hold on to my long position just that I added some protection with 20000 PE buy in the last minutes of trade today. Not because I wish to change the status to neutral, but to offset the OTM PEs shorted today. Most of them were full of air today as the movement would have spiked up its implied volatility. ATH is 20222 and we are just 126 points away, there are no support/resistance zones in between too.”
5mts chart link - click here
The 20000 PE which was bought as a hedge for the OTM short positions was in action today. Even though I exited it prematurely, It went from Rs11 to Rs39 today. See the encircled region in the chart - 09.40 to 10.05. The steam was let off by then and we quickly gained back ground. Nifty50 was trading below water, mainly due to the pressure from BankNifty. But by 13.40 - Nifty made its intentions clear to go green.
The real push came between 14.15 and close wherein Nifty gained 101pts ~ 0.5% to end the day with credible gains of 36pts. Meanwhile do not get swayed away by the FIIs buy number today - as it may be due to the MSCI inflows on the top largecaps.
1hr chart link - click here
On the 1hr TF, 20015 was today’s stop and reversal level. The hourly candle seemed pretty strong, but some credibility has to be given to this new support level. I wish to continue with my bullish stance, the upper target will be the ATH and the lower target will be the new support of 20015.

CHAMBAL FERTILISER (BULLISH)CHAMBAL FERTILISER is a chemical stock
from a long time stoack was in consolidation
Between the level of 370 -260 from from jun 2022
Now stock was trying to make a inverse HEAD AND SHOULDER PATTERN
From the feb-14-2023 first it makes a SHOULDER at level of 270 -275 on feb -24-2023
After that make a HEAD at level of 250-248 on mar-29=2023 the retrech at the same level of
Shoulder resistence. Then it make a next shoulder at the same level of 270-275 on apr -25-2023
Then they try to retrech on the same level of heads and shoulder neckline i.e 290
above 295 or neckline (day closing is very imp )stock is bullish
just a view / consult your financial advisor befor investing and trading

DABUR BEARISH DABUR LOOKS BEARISH
A stock was try twice to breakout the upper level
But fail
keep an eye
highly volatile stock

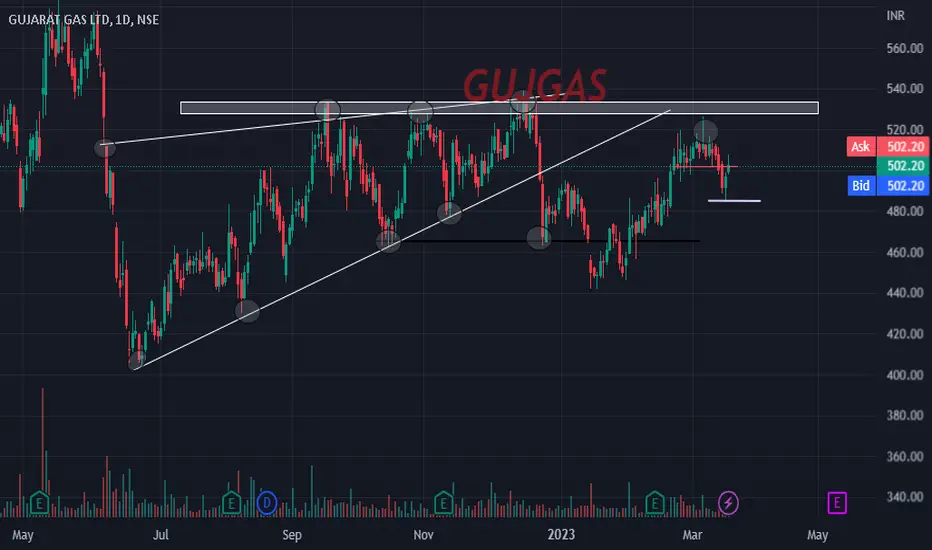
GUJGAS RISING WEDGE AFTER MAKING RISING WEDGE IN GUJGAS
A stock is in consolidation
a movement come in a stock in downword But
Again from the lower level there is buying in stock
stock still not complete the target of rising wedge
keep an eye on that
just a view
consult your advisor before any action
ITS time for oil that is crude oil For a short periods of time
crude oil is getting ready to go up
There was a fall in crude from jun/07/22
And after a fall it was in consolidation
from nov/23/22 till feb/03/23
Now oil gives a Breakout
for a short period of time for
Retrech the important level
keep an eye on crude
for short periods
just a view

A Rissing wedge pattern in BritanniaBritannia made a rissing wedge pattern in a daily chart
Now in a consolidation which looks good
Perfectly retrech at all level
Now wait for break down or breakout
good if break 4310level

I see 300...What do you see in IRB ?NSE:IRB is a fundamentally strong scrip. Their incomes from toll have reported a great rise.
Furthermore, just have a look on FII holding. There is no reason not to add this scrip.
-- Infrastructure sector overall growth
-- Fundamentals
-- Diversified sources of revenue
I see a short term target of Rs.300 and Rs.350 in medium term.
What are your targets ??
The idea shared is for education purpose only.

Barbeque Nation Hosp. LtdBarbeque Nation Hosp. Ltd bought by various FII and DII in bulk deal on 6/4/2022.Total buying of 355 crore Rupees at average price of 1164 Rs per share..
#Barbeque #stocktowatch #stockstowatch #stockmarket #stockmarketindia #swingtrading #bulkdeal #FII #DII #MutualFunds

Who is Bearish on Indian Market Most ?Thursday evening after seeing rebound in nifty I thought selling is over now we can see "V" shaped recovery but I don' t think this going to happen because of the way FII's shorted the Index. Let's Analyse the Index Future data let's start with retailers who are net buyer today they bought 11,956 index future contracts and cover the 201 shorts and now they hold 2,11,112 Long contracts and 1,30,363 shorts contracts. On the other hand DII's Neither Added Long contracts but covered 3,218 short contracts and now They hold 17,362 Long and 58,215 Shorts. Now let's talk about MARKET MAKERS (The FII) on Friday they not only covered Long but also added shorts. They covered 2,420 Long and added 17,745 short and their position in future index now is 40,493 Longs and 1,04,164 Shorts. Pro's Added 5,480 Long and shorted 690 contracts and now they currently hold 44,372 Longs and 20,597 shorts.

Participant wise Open Positions in Index FuturesHere Today's Participant wise Open Position data. In today's we can clearly see FII covered their long as well as short. Today They covered 38,478 longs and 15,750 shorts now they have 42,913 longs and 86,419 shorts. On the other hand Retailers also covered 10,870 longs and 21,214 shorts and now they hold 1,99,156 Longs and 1,30,564 shorts. Propritary desks added 2,265 Longs and covered 16,594 shorts Now they have open position in market 38,892 Longs and 19,907 shorts and Lastly DII added 332 Longs index futures and 6,812 short and they have open position such as 17,362 Longs and 61,433 shorts.

Participant wise open Position in Index FuturesAfter Monday's big falls here is Tuesday's Participant wise open Position in Index Futures data.

Client Wise Position In Index FuturesAfter Todays Blood Bath i thought why not publish an idea of who bought index future and who not.

Strong continuation of upmove, what next?NIFTY 50 EOD ANALYSIS 08-12-21
In this post, I talk about the analysis for the day and the trading range for tomorrow. The video discusses with the help of the charts how the indices as well as leading stocks performed during the day and their likely play tomorrow.
O 17315.25
H 17484.60
L 17308.95
C 17469.75
EOD +293.05 points / +1.58%
India VIX 17.27/-6.45%
SGX Nifty 08-12-21 @ 1900h = +25 points
FII DII = +1156ICrores
CHART BASED CONCLUSIONS using 5 Minutes Chart
Nifty opened with a strong gap up and sustained the same except for 5 minutes when it breached 17400 briefly.
Even though there was positivity throughout and India Vix is also showing a good downward move, the market was choppy and many SLs may have been hit on either side.
The indices made significant higher lows and higher highs.
NIFTY WEIGHT LIFTERS & DRAGGERS
Top 5 Lifters contributed = 131
Top 5 Draggers contributed = 3
Net = +128
BANK NIFTY WEIGHT LIFTERS & DRAGGERS
Top 3 Lifters contributed = 595
Top 3 Draggers contributed = 47
Net = +548
POSITIVES
Nifty closed above 17450 and closer to the day high.
Bank Nifty closed above 37200.
India Vix keeps falling.
The Advance-Decline ratio is quite impressive as 2/3rd scrips have advanced.
FII DII data is +1100 Crores
NEGATIVES
I do think anything worth a mention can fit in here today.
TRADING RANGE FOR 09 Dec 21
Nifty Support = 16900-17000 may well be the new base.
Nifty resistance = 17500-600
Bank Nifty Support = 36500-800
Bank Nifty resistance = 37500-700-37000
INSIGHTS / OBSERVATIONS
Of the total gain of 663 in Bank Nifty on EOD basis, the net contribution of the Top 3 Lifters & Draggers is 548! This explains why Bank Nifty was on a high today.
There are 2 significant things that I feel are important and these are:
Nifty’s low for the day in comparison to that of yesterday is higher by 300+ points.
Bank Nifty Low for the day in comparison to that of yesterday is higher by almost 900 points.
And this becomes even more interesting when we look at the following:
Nifty EOD is up by 300+ points than EOD price of 1-12-21
Bank Nifty is up by 900+ points than EOD price of 1-12-21
Kotak Bank is like a hedging instrument - it prefers to run on its own course as when Bank Nifty was very strong today, Kotak Bank dragged. This has been the character of the scrip.
I do not recollect when was the last time that the indices moved up this way after RBI policy announcements.
Let us see how the expiry turns out tomorrow and whether India Vix continues its downward journey. A weekly close above 17500 on Nifty and 38000 on Bank Nifty would be a good thing to have.
Nifty reached 17422 at 0925h and except for a 5 minute candle which took it to 17390, the rest of the entire day, it moved in a very narrow range of 62 points. However, Bank Nifty had a choppier day compared to Nifty with many ups and downs.
What do you feel about this?
Thank you, and Happy Money Making!
Umesh
8-12-21
NOTE --
This write-up is not a prediction mechanism for the movement of Indices in the Indian markets as the markets are unpredictable in nature. I may refer to many data points in the article but I do not base my view on any of these standalone. In fact, I prefer to react to the price moves than predict the price moves. I also do not review Open Interest. Whatever data points I am using, are all stated in the article. The article title, as well as its contents, can at best be stated as --- This Is How I Read Nifty. I hope I have been able to set the expectations right.
---

Nifty Positional ViewNifty looks sideways.
A comfortable closing Above 15960 or Below 15450 will give atleast 500 points move either side
Presently FIIs are net sellers, unless they turn net buyers Nifty will struggle at resistance of 15960.

FII_Stats_Index_16th JulyNIFTY is knocking on 16000 for quite a few days now. As according to Friday's Stats FII's have covered 5996 contracts of Future Index long and added 6897 shorts.This might be the case coming week. besides,
Option Index Call long 54923
Call Short 70176
Put long 62139
Put Short 40611
From this data I will say market will correct again from this level, so I will Sell on any rise close to 16000 or even above that.
Lets see what happens tomorrow, till then happy learning folks


RBL Bank trading near its Lifetime low - FPI Buy Position
Positive Points:
==============
- Stock is trading near its lifetime low.
- Also, RSI positive divergence can be seen on the weekly chart.
- A bulk deal done by FPI(erstwhile FII) for 256.48 rs.
Negative Points:
=============
- India is struggling with TRUST factor with some banks like PMC, YesBank etc. Keeping in mind, banks like RBL Bank, may be affected badly.
