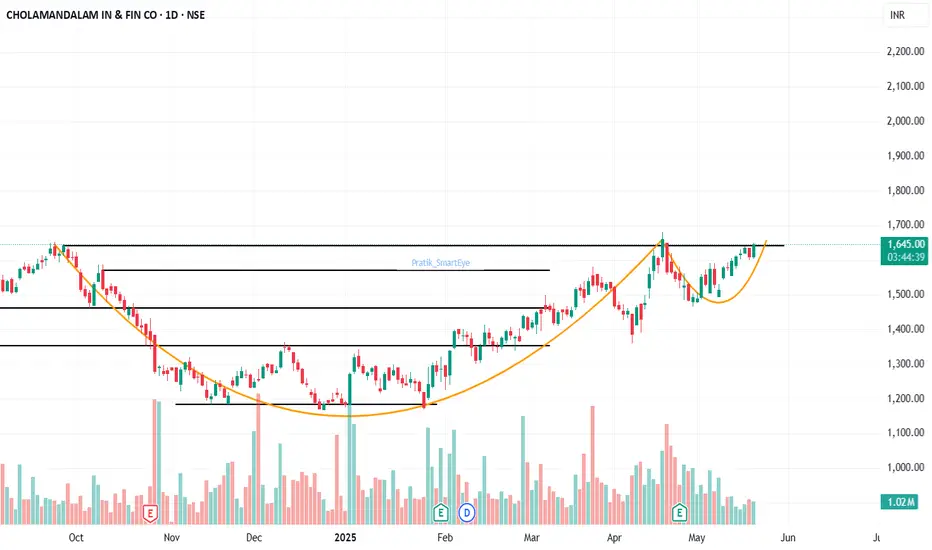
Chola Finance: as expected cup & handle pattern formed.Chola Finance: as expected cup & handle pattern formed sustaining above 1642.
At breakout levels. CMP 1643.
Pattern target of 2100.
View negated below 1500.
Finance
CHOLAFIN- Breakout from DTFCHOLAFIN has resistance weakening on the Daily charts and has given a breakout with good volume.
The target of this pattern signals an upside potential of ~10% from the current price level in the medium term.
The stock is trading above its 50- and 100-day simple moving averages (SMAs). The range is more than >1X, and the Volume is also >1X the average.
CMP- Rs. 1628
Est. Entry price ~ 1670
Target Price- Rs1813 ( ~10% upside)
SL -1610
Note- The candle closed isn't very promising, so we have to wait for a stronger move. The promising move should be able to close above 1670.
Disclaimer: This is not a buy/sell recommendation. For educational purpose only. Kindly consult your financial advisor before entering a trade.

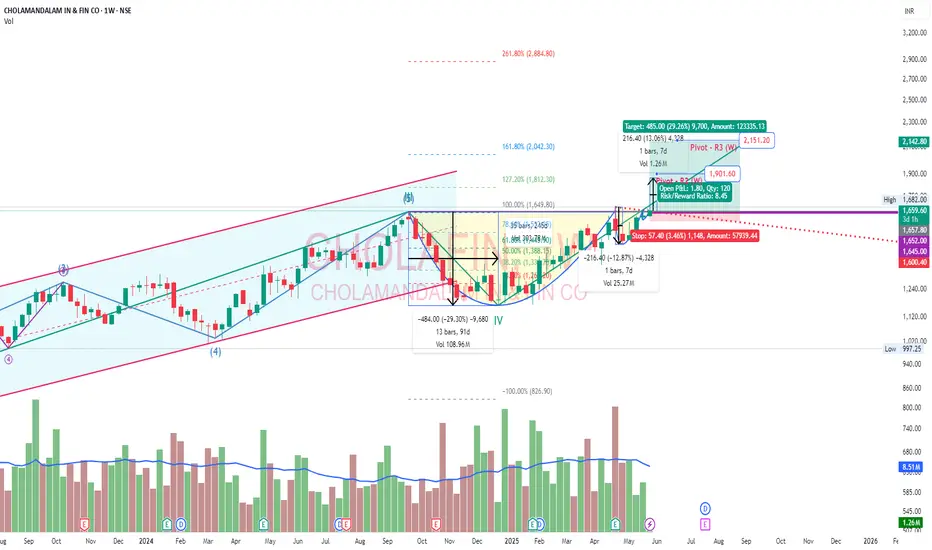
Cholamandalam Finance - Cup & Handle PatternFinance Industry is bullish. Murugappa group of companies are good performers. EID Parry, CG Power, Chola Fin, Chola Holdings, Wendt etc...
Cholamandalam Finance has made cup & handle pattern. 30% potential. 161.8% Fib level, Pivot R3 (W), cup height as target all are in that level. Wave 5 could reach that point.
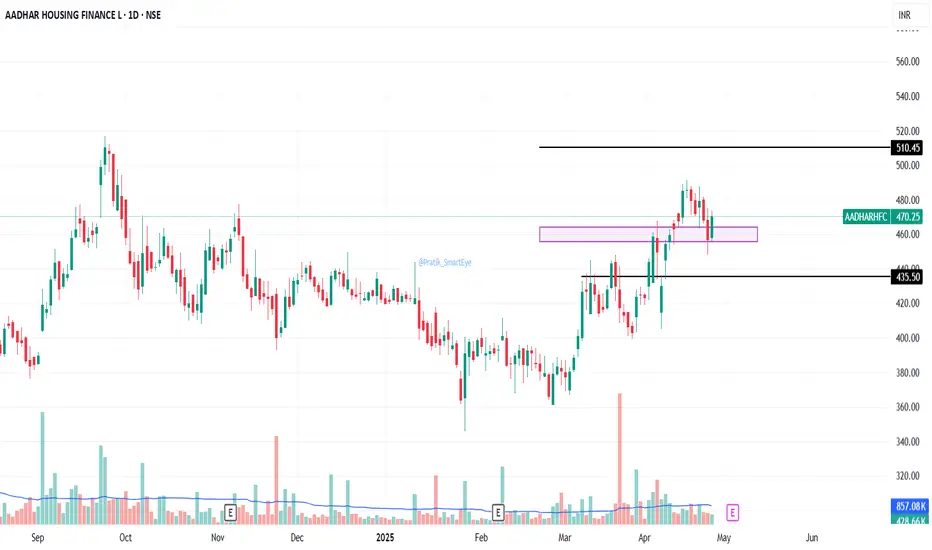
Aadhar Housing: at support zoneAadhar Housing: at support zone, bounce from here will give a strong up-move.
Resistance at 510, Support at 455/435.
Results on 6/May
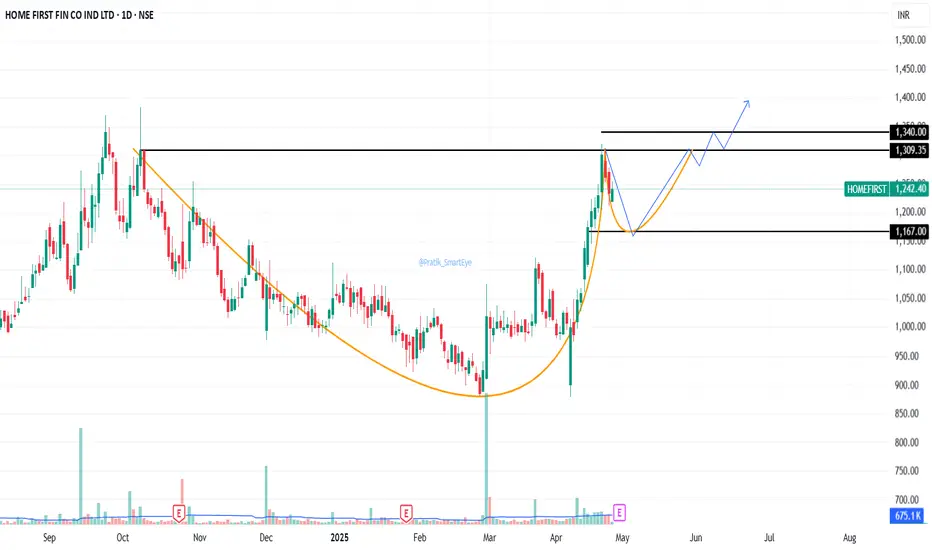
Home First: Cup & Handle pattern in formationHome First: Cup & Handle pattern in formation. Cup formed at 1309. Handle in progress.
Expect to take support and bounce. Reversal confirmation needed.
If support of 1167 is broken then view is negated.
Results expected on 30Apr
PNB Housing: tested resistance zone & taking supportPNB Housing: tested resistance zone & taking support.
Resistance zone at 1015-1040 & next at 1060/1148.
Supports at 967/925.
Tomorrows move will decide the direction based on todays results.
📊 PNB Housing Finance Ltd ||
Q4 FY25 Results
➡️ Revenue from Operations
₹2,021.85 crore (QoQ: +4.1%, YoY: +11.7%)
➡️ Profit Before Tax (PBT)
₹711.21 crore (QoQ: +15.5%, YoY: +27.1%)
➡️ Net Profit (PAT)
₹550.38 crore (QoQ: +13.9%, YoY: +25.3%)
➡️ Earnings Per Share (EPS)
₹21.18 (QoQ: +13.9%, YoY: +25.3%)
🔹 Overall Verdict: Blockbuster
➤ Strong double-digit growth across revenue, PBT, and PAT with operating leverage benefits clearly visible.
🔍 What the Numbers Say
🔹 Revenue Performance
➤ Growth was led by a steady rise in interest income (+12.6% YoY) and a healthy jump in fee & commission income (+1.3% YoY). Fair value gains were lower YoY but not materially impactful.
🔹 Profitability Insights
➤ Strong PBT expansion aided by lower impairments (recoveries and write-backs), with total impairment reversals of ₹64.83 crore this quarter (versus a provision last year). Core spreads and margins appear stable.
🔹 Cost & Efficiency
➤ Finance costs were up YoY (+10.1%) but well absorbed by revenue growth. Operating expenses (employee + others) grew moderately (+13-14% YoY), indicating decent cost control.
🔹 Strategic / Operational Highlights
➤ Final dividend of ₹5 per share announced for FY25.
➤ Significant strengthening of balance sheet (Net Worth: ₹16,863 crore; GNPA reduced to 1.08%, NNPA at 0.69%).
➤ Improved asset quality and reduced stress resolution portfolio under COVID restructuring.

LIC Housing in consolidating, Base Breakout above 618.LIC Housing: in consolidation. Base breakout above 618 sustained closing basis.
Support/SL at 590/551.
Resistance at 658/717/808.

S&P 500 sliding down! Markets under pressure #SP500S&P 500 sliding down! Markets under pressure #SP500
📉 The S&P 500 is trending downward today as market volatility rises. Investors react to economic data, Fed policy expectations, and global uncertainties. Stay alert and manage risk accordingly! #SP500 #StockMarket #Investing #trade #markets #finance #money

Management and PsychologyTrading Psychology simply refers to the feelings and emotions of a trader experiences and the associated actions the trader takes as a result. Just like in any other aspect of life, understanding how our mind works can improve our ability to trade better, take more informed, rational decisions and calculated risk.
How do I master my trading psychology?
What is Trading Psychology? ...
1) Create a Trading Plan. ...
2) Take Regular Breaks. ...
3) Don't Quit Your Day Job. ...
4) Accept That You Will Lose. ...
5) Practice, Practice, Practice. ...
6) Use a Take Profit and a Stop Loss. ...
7) Backtest Your Trading Strategy.
More items...

Database TradingYou can get started trading options by opening an account, choosing to buy or sell puts or calls, and choosing an appropriate strike price and timeframe. Generally speaking, call buyers and put sellers profit when the underlying stock rises in value. Put buyers and call sellers profit when it falls.
Charles Dow occupies a huge place in the history of finance. He founded The Wall Street Journal – the benchmark by which all financial papers are measured – and, more importantly for our purpose, he created the Dow Jones Industrial Index. In doing so, Dow opened the door to technical analysis.

RSI Divergence Low RSI levels, typically below 30 (red line), indicate oversold conditions—generating a potential buy signal. Conversely, high RSI levels, typically above 70 (green line), indicate overbought conditions—generating a potential sell signal.
Successful trades often occur when the RSI crosses above 30 (indicating a buy signal) or below 70 (indicating a sell signal). Adjusting the RSI period to 9 can make it more sensitive to price changes and be suitable for more active trading strategies.

Anand rathi wealth nearing consolidation endAnand rathi wealth is a fantastic wealth compounder fundamental stock. Company has posted more than 30% growth in sales and profit in Q2. Consolidation will breakout soon with a potential of 50%.

Weekly Breakout after 2.5 yrs in PaytmNSE:PAYTM
After 2.5 years, Paytm communication is about to experience a weekly breakout. A breakout failed around October last year. This retest is crucial for the next bullish phase.
A stop loss of 850 would be ideal which is the swing low.
Buy above 1000 with a bullish candle & aim for an upward target of 1300,1550 & ATH.

Can a Corporate Titan Withstand the Tremors of Allegations?In the high-stakes arena of global business, few narratives captivate the imagination quite like the meteoric rise and sudden turbulence of an economic powerhouse. The Adani Group once celebrated as a paragon of Indian entrepreneurial success, now finds itself navigating treacherous waters of legal scrutiny and market skepticism. What began as a remarkable journey of a diamond trader turned infrastructure magnate has transformed into a complex tale of ambition, power, and potential corporate misconduct that challenges our understanding of success in the modern economic landscape.
The allegations against Gautam Adani—ranging from securities fraud to a purported massive bribery scheme—represent more than just a corporate challenge; they symbolize a pivotal moment of reckoning for corporate governance in emerging markets. With U.S. prosecutors indicting Adani and a damaging report by Hindenburg Research accusing the group of "the largest con in corporate history," the conglomerate has witnessed a staggering $68 billion evaporation of market value. This precipitous fall from grace serves as a stark reminder that even the most seemingly invincible corporate empires can be vulnerable to the harsh light of forensic scrutiny and legal investigation.
The unfolding saga transcends the individual narrative of Gautam Adani, touching upon broader themes of economic development, political connections, and the delicate balance between entrepreneurial ambition and ethical conduct. As the Adani Group confronts these unprecedented challenges, the world watches with bated breath, understanding that the outcome will not merely determine the fate of one business empire, but potentially reshape perceptions of India's economic credibility on the global stage. The resilience, transparency, and response of the Adani Group in the face of these allegations will serve as a critical case study in corporate accountability and the complex interplay between business, politics, and regulatory oversight.
Ultimately, this narrative invites us to reflect on the fundamental principles of corporate integrity and the thin line between visionary entrepreneurship and potential systemic manipulation. As investors, policymakers, and global observers, we are compelled to ask: Can reputation, built over decades, withstand the seismic tremors of serious allegations? The Adani Group's journey offers a compelling, real-time exploration of this profound question, challenging our assumptions about success, power, and the intricate mechanisms that govern global business ecosystems.

SCB X PCL, Triangle Pattern Target & Gain +33% PROFITIn SCB X PCL, a Triangle Pattern has formed, and the market is expecting a breakout above the pattern. If the market breaks out above the Triangle Pattern, it is likely to reach the pattern target or the 0.618 Fibonacci retracement level at 146 THB. Take advantage of this Great Opportunity to Earn a Potential Profit of +33% ROI.
I want to help People to Make Profit all over the "World".

IDFC FIRST BANK - BREAKOUT / BREAKDOWNYou guys are smart if you really know how to trade this Pattern !
A rectangle chart pattern forms during a period of consolidation, where the price moves between parallel support and resistance levels. This pattern indicates indecision in the market, with buyers and sellers in equilibrium. The price bounces between these horizontal levels multiple times, creating a rectangular shape. Traders look for a breakout from this range to signal the next move. A bullish breakout occurs above the resistance, while a bearish breakout happens below the support. Volume typically decreases during the formation and spikes during the breakout, confirming the pattern’s validity.
Clear Accumulation/Distribution Happening, pay attention even if you dont want to trade it's fine !

IMPORTANT Macroeconomics: What is the trade balance?IMPORTANT Macroeconomics: What is the trade balance?
The trade balance is an important economic indicator that can have a significant influence on the stock markets.
Here is a simple explanation of this concept and its potential impact:
What is the trade balance?
The trade balance represents the difference between the value of a country's exports and imports over a given period.
In other words:
- If a country exports more than it imports, its trade balance is in surplus (positive).
- If a country imports more than it exports, its trade balance is in deficit (negative).
Impact on the stock markets
The influence of the trade balance on the stock markets can vary depending on whether it is in surplus or deficit:
Trade balance surplus
A trade surplus can generally have a positive impact on the stock markets:
- It indicates strong competitiveness of domestic companies in international markets.
- It can strengthen the value of the national currency, which can attract foreign investors.
-Exporting companies may see their shares increase in value.
Trade deficit
A trade deficit can have a negative impact on stock markets:
-It can indicate a weakness in the domestic economy or a loss of competitiveness.
-It can weaken the domestic currency, which can discourage foreign investors.
-The shares of companies dependent on imports may be negatively affected.
Important nuances
It is crucial to note that the impact of the trade balance on stock markets is not always direct or predictable:
-Overall economic context: Other economic factors can attenuate or amplify the effect of the trade balance.
-Investor perception: The reaction of the markets often depends on how investors interpret the trade balance figures in relation to their expectations.
-Specific sectors: Some sectors may be more affected than others by changes in the trade balance.
In conclusion, although the trade balance is an important indicator, its influence on stock markets must be seen in the broader context of the economy and investor sentiment.

Jio Financial Services LtdNSE:JIOFIN
Long Position on Jio Financial Services Ltd
Best Buy : 280+
Stop Loss : Below 255
Targets; 310/360/400/440+++++
About:
Jio Financial Services Ltd, a subsidiary of Reliance Industries Limited (RIL), has been rapidly expanding its footprint in the financial services sector, leveraging the extensive customer base of Jio Platforms. With India's growing digital adoption and increasing demand for fintech solutions, Jio Financial Services is well-positioned to capitalize on these trends. Additionally, the backing of RIL provides stability and resources for sustained growth .
Technical :
Breakout of ascending triangle pattern.
Good support from lower levels.
Breakout with good volume.
Good Risk to Reward Ratio.
Thanks & Happy Trading
Disclaimer:
This idea is only for educational purposes,
Please Trade at your own RISK''

CNX Finance Bearish signalsBearish sentiment validity on breakout below 23950-25930 range
Targets 23750, 23575
SL around 24140
RR: 1:2.6
It is invalidated once it closes above SL.
Double-top under formation.

GICRE FOR 100% GAINWith strong fundamentals and growth based Story in the Sector itself. The opportunity is seen in the GICRE stock for making profits . Also the Technicals are allowing to Add the stock in the Portfolio with a upside seen of more than 💯 %.
The Financial sector is looking good

BAJAJFINSV - Symmetrical Triangle Breakout🔊 BAJAJFINSV- Symmetrical Triangle Breakout
BAJAJFINSV- BAJAJ FINSERV LTD.
⌛Duration - Short Term (4 month to 8 month)
📊📈 Trade Logic - Symmetrical Triangle Breakout
CMP - 1783
Time Frame - Weekly
🎯Target 1 : 1950
🎯Target 2 : 2200
🎯Target 3 : 2475
🎯Target 4 : 2750
🛑 Stop : 1500
🏆 Risk/Reward Ratio (1: 3.3)
Disclaimer: The stock information shared above is not a recommendation to buy, sell, or hold. It reflects my own analysis and is intended solely for educational purposes. Any actions you take based on this information are your responsibility, and the admin of this channel is not liable for any financial gains or losses. Please consult a financial advisor before making any investment decisions. I am not a SEBI-registered advisor.

FINNIFTY INDEX! LEVELS TO WATCH!FINNIFTY expiry levels marked on 1 HR time frame and currently in a range. watch out these levels for a better view. Study before you punch any order.
NOTE: I'm not a SEBI REG. Study before investing.

