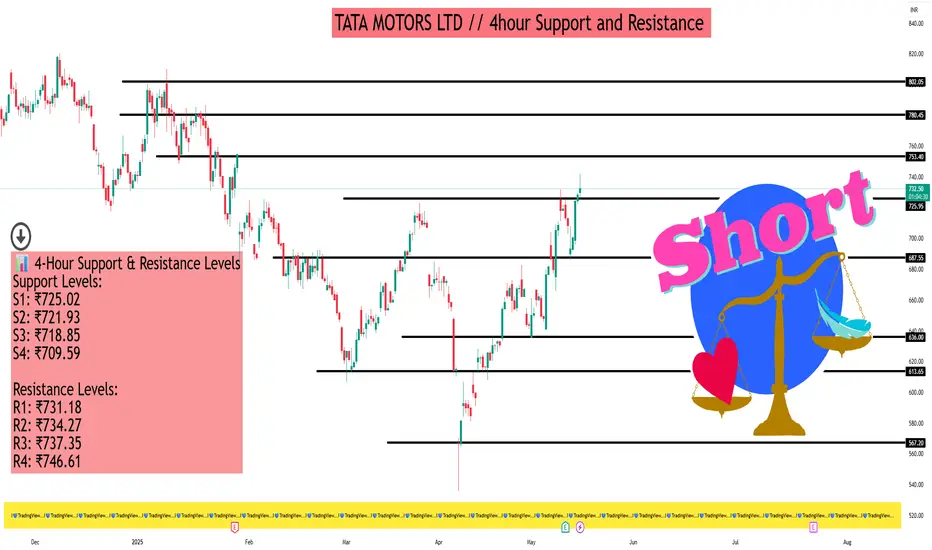
TATA MOTORS LTD // 4hour Support and Resistance As of May 16, 2025, Tata Motors Ltd. (NSE: TATAMOTORS) is trading at approximately ₹735.00. Here's a detailed analysis of its support and resistance levels on the 4-hour timeframe, along with insights from technical indicators and chart patterns.
📊 4-Hour Support & Resistance Levels
Support Levels:
S1: ₹725.02
S2: ₹721.93
S3: ₹718.85
S4: ₹709.59
Resistance Levels:
R1: ₹731.18
R2: ₹734.27
R3: ₹737.35
R4: ₹746.61
These levels are derived from Camarilla pivot calculations and provide key price points where the stock may experience buying or selling pressure.
📈 Technical Indicators Overview
Relative Strength Index (RSI): 68.4 — approaching overbought territory, suggesting potential for a short-term pullback.
MACD (12,26): 8.69 — indicates bullish momentum.
Average Directional Index (ADX): 42.07 — reflects a strong trend strength.
Stochastic Oscillator: 76.29 — nearing overbought levels, which may signal a potential reversal.
Commodity Channel Index (CCI): 103.31 — suggests the stock is in a strong uptrend.
These indicators collectively point towards a bullish trend, but caution is advised due to overbought signals.
🔍 Chart Patterns & Price Action
Recent analyses indicate that Tata Motors has formed a Shark pattern, with potential resistance in the ₹850 to ₹900 range. Short-term targets include ₹700, ₹750, ₹780, ₹820, ₹860, and ₹900. A weekly candle close above ₹900 could signal further upside potential.
Additionally, Elliott Wave analysis suggests that the stock may have completed a Wave (5) near ₹1180, with a potential decline towards the ₹850 level as part of a corrective phase.
🧭 Trading Strategy Insights
Bullish Scenario: If the stock sustains above ₹737.35 (R3), it may target higher resistance levels, with ₹746.61 (R4) being a key level to watch.
Bearish Scenario: A break below ₹725.02 (S1) could lead to further downside, with support at ₹709.59 (S4) potentially being tested.