Understanding Market StructureIntroduction
Market structure is the backbone of price action. It reflects how price behaves over time, how buyers and sellers interact, and how supply and demand influence direction. Whether you’re an intraday scalper or a long-term investor, understanding market structure helps you make better entries, exits, and risk decisions.
Let’s break down this essential topic over the next 3000 words—starting from the basics and going deep into trend analysis, price phases, manipulation zones, liquidity, and how to apply market structure in real-world trading.
1. What is Market Structure?
Market structure refers to the framework of price movement based on the highs and lows that price forms on a chart. It answers key questions like:
Is the market trending up, down, or sideways?
Who is in control—buyers or sellers?
Where are significant support and resistance levels?
What kind of setup is forming?
By observing these patterns, traders can anticipate the next move with higher accuracy instead of just reacting.
2. The Three Main Types of Market Structures
A. Uptrend (Bullish Market Structure)
In an uptrend, price forms:
Higher Highs (HH)
Higher Lows (HL)
This indicates increasing buying pressure. For example:
sql
Copy
Edit
Low → Higher High → Higher Low → New Higher High
Buyers are in control. Traders look for buy entries near higher lows in anticipation of the next higher high.
B. Downtrend (Bearish Market Structure)
In a downtrend, price forms:
Lower Lows (LL)
Lower Highs (LH)
This signals selling pressure.
sql
Copy
Edit
High → Lower Low → Lower High → New Lower Low
Sellers are dominant. Smart traders sell on lower highs, expecting new lows.
C. Range-bound (Sideways Market)
No clear higher highs or lower lows
Price is trapped between a resistance and support
Often forms consolidation zones or accumulation/distribution
In ranges, traders often buy low/sell high within the structure or prepare for a breakout.
3. Key Components of Market Structure
Understanding market structure involves recognizing these components:
A. Swing Highs and Lows
Swing High: A peak in price before it reverses down
Swing Low: A trough in price before it moves up
They form the skeleton of structure. If price fails to break the previous high or low, it may signal a trend reversal.
B. Break of Structure (BOS)
Occurs when price breaks a key swing high or low.
Confirms continuation or change of trend.
For example, a break of a previous higher low in an uptrend signals a potential bearish shift.
C. Market Structure Shift (MSS)
Early sign of trend reversal
Happens when a new lower high is formed after a higher high in an uptrend (or vice versa)
Often precedes a BOS
D. Liquidity Zones
These are areas where large volumes of stop-loss orders accumulate:
Below swing lows
Above swing highs
Smart money often targets these zones before reversing, creating fakeouts or stop hunts.
4. The Four Phases of Market Structure (Wyckoff Model)
Richard Wyckoff’s market cycle is a time-tested way to visualize market structure:
1. Accumulation
Smart money buys quietly in a range
Price shows consolidation after a downtrend
Low volatility, sideways movement
2. Markup
Breakout of the range
Higher highs and higher lows begin
Retail enters late; trend gains strength
3. Distribution
Smart money sells gradually
Price goes sideways again
Volume increases, volatility spikes
4. Markdown
Breakdown from range
Lower highs and lower lows form
Downtrend begins, panic selling ensues
Traders who identify the phase early can ride major trends or prepare for reversals.
5. Timeframes & Fractal Market Structure
Market structure behaves fractally—it repeats on every timeframe:
A daily downtrend may contain multiple 1-hour uptrends
A 5-minute consolidation might just be a pullback on the 15-minute
This is crucial when aligning trades:
Top-down analysis helps confirm structure across timeframes
A good strategy: Analyze on higher TFs (trend), enter on lower TFs (timing)
6. Order Flow & Liquidity in Structure
Behind every market move are two forces:
Order Flow: Buy and sell orders flowing into the market
Liquidity: Zones where many traders place stops or limit orders
Smart Money Concepts
Institutions often manipulate price to:
Grab liquidity
Trap retail traders
Reverse at high-probability zones
For example:
A fake breakout above a resistance might trigger retail buying
Institutions then dump price, flipping the breakout into a breakdown
Understanding liquidity raids, order blocks, and inefficient price moves (FVGs) enhances structure analysis.
7. Reversal vs Continuation Structures
Reversal Structure:
Change from bullish to bearish (or vice versa)
Often shows:
Market structure shift
BOS in the opposite direction
Liquidity sweep
New trend begins
Continuation Structure:
Short pullback within the same trend
Forms bull flags, bear flags, pennants
Confirmed by a strong break in the direction of the prevailing trend
Knowing whether structure signals reversal or continuation is key to avoiding traps.
8. Classic Chart Patterns & Market Structure
Most chart patterns are just visual representations of market structure:
Double Top/Bottom: Failed BOS + liquidity sweep
Head and Shoulders: Trend exhaustion + MSS
Wedges/Flags: Continuation patterns
Rather than memorizing patterns, understand what price is doing within them.
9. Institutional Market Structure vs Retail Perception
Retail traders often:
Focus on indicators
React late to structure changes
Get trapped in fakeouts
Institutions:
Trade based on volume, structure, and liquidity
Use algorithms to hunt liquidity and engineer moves
Create patterns that look bullish or bearish, but reverse once enough orders are triggered
Understanding this behavioral dynamic helps you trade with smart money, not against it.
10. Real-World Market Structure Strategy
Step-by-Step Example:
Scenario: Nifty is in an uptrend on the 1H chart.
Identify Structure:
HH and HL form regularly → uptrend
Mark Key Levels:
Recent HL, HH
Order blocks and liquidity zones
Wait for Pullback:
Price retraces to HL or demand zone
Entry Confirmation:
Bullish candle structure
LTF break of minor resistance (on 15m)
Stop-Loss:
Below recent HL or liquidity zone
Targets:
Next HH or fib extension
Bonus: Use Volume Profile to spot high-volume nodes confirming structure.
✅ Key Takeaways
Market structure = the way price moves via highs and lows
Three types: uptrend, downtrend, range
Tools: BOS, MSS, swing points, liquidity zones
Timeframe alignment is essential
Combine with volume and smart money concepts for maximum edge
Finnifty
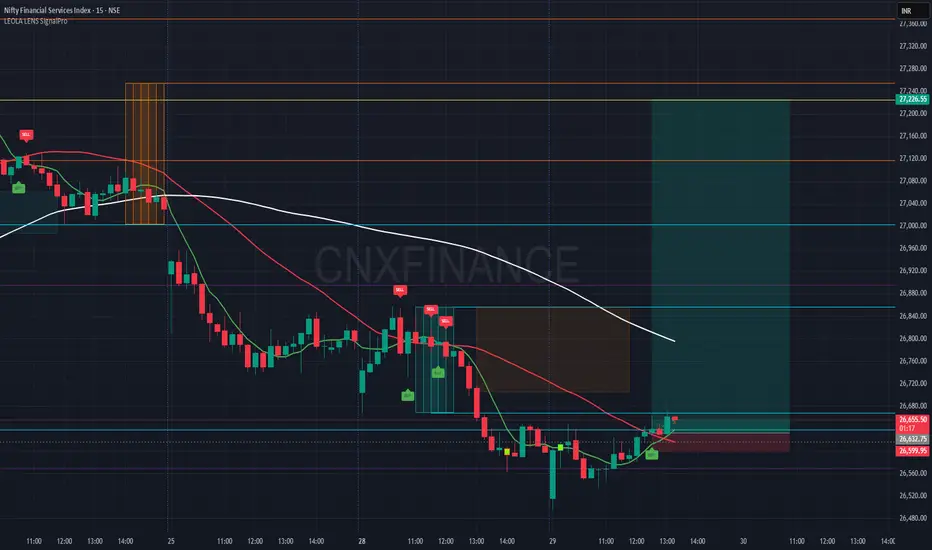
Nifty Financial Services Index-Reversal Set-Long Eyes ONLeolaLens SignalPro has triggered a fresh Buy indication on the 15-minute chart after a prolonged downtrend. This signal has emerged near a possible reversal zone, with defined risk and potential reward setup.
Entry: Around 26,660
Stop Loss: 26,599
🎯 Target 1: 26,880
🎯 Target 2: 27,040
🎯 Target 3 (Extended): 27,240
Key Observations:
Price attempting short-term EMA crossover
Favorable risk-reward ratio setup
Chart structure suggests potential for short-term reversal
🛑 Disclaimer:
This chart is shared strictly for educational purposes. This is not financial advice or a buy/sell recommendation. Please do your own research and consult a registered financial advisor before making any trading decisions.
Technical Analysis Mastery🧠 What is Technical Analysis?
Technical Analysis (TA) is the skill of analyzing price charts and patterns to predict future movements of stocks, indices, commodities, forex, or cryptocurrencies. It’s like reading the mood and psychology of the market by observing price and volume.
Instead of studying company balance sheets or industry trends (that’s fundamental analysis), technical analysis assumes that everything important is already reflected in the price. It’s used by intraday traders, swing traders, and even investors to make smarter entries and exits.
📚 The Core Principle of Technical Analysis
There are three main beliefs that form the base of technical analysis:
Price Discounts Everything
All news, emotions, expectations, and fundamentals are already priced into the chart. So, instead of worrying about inflation or earnings, a technical analyst looks at price action.
Price Moves in Trends
Markets don’t move randomly. They trend – either up, down, or sideways. TA helps you identify the direction of the trend and when it might be changing.
History Repeats Itself
Market behavior is repetitive because human psychology is repetitive. Fear and greed create familiar patterns. Candlestick patterns, chart patterns, and indicators are all built on this belief.
🧭 Types of Market Trends
To master technical analysis, you need to understand trends first:
📈 Uptrend (Bullish): Higher highs and higher lows.
📉 Downtrend (Bearish): Lower highs and lower lows.
➡️ Sideways (Range-bound): Price moves within a horizontal range.
Your first job as a technical analyst is to identify the current trend. Once you know this, your job becomes easier:
Buy in an uptrend, sell in a downtrend, stay cautious in a sideways market.
📊 Reading Price Charts (The Visual Language)
The chart is your battlefield. Let’s break down the types:
1. Line Chart
Shows the closing price over time.
Clean and simple, but lacks detail.
2. Bar Chart
Shows open, high, low, close (OHLC).
More informative than a line chart.
3. Candlestick Chart (Most Popular)
Shows OHLC in a visually rich format.
Green (or white) candles = price went up.
Red (or black) candles = price went down.
Candlesticks reveal trader emotions and help spot patterns like Doji, Hammer, Engulfing, etc.
🔍 Support & Resistance – The Foundation
Support = A price level where demand is strong enough to stop the price from falling further.
Resistance = A level where selling pressure prevents the price from rising.
Imagine support as a floor and resistance as a ceiling. Once broken, these levels often flip roles (old resistance becomes new support).
Example:
If Nifty keeps bouncing back from 21,000 – it’s a support zone.
If it keeps failing near 22,000 – that’s resistance.
✍️ Chart Patterns – Visual Clues to Price Moves
Chart patterns are shapes formed by price on a chart, often signaling upcoming moves.
✅ Continuation Patterns
Price will likely continue in the same direction.
🔺 Flag & Pennant
🔻 Triangle (Symmetrical, Ascending, Descending)
📦 Rectangle
🔄 Reversal Patterns
Suggests trend may reverse.
👨🦲 Head and Shoulders
🧍♂️ Double Top / Bottom
🛑 Rounding Top / Bottom
These patterns help you plan trades with entry, stop loss, and target.
🧠 Candlestick Patterns – Market Psychology in Action
Candlestick patterns show short-term momentum and emotion.
🔥 Bullish Candles
Hammer: Long wick at bottom – buyers stepping in.
Bullish Engulfing: Green candle swallows previous red one.
Morning Star: A 3-candle reversal pattern.
🧊 Bearish Candles
Shooting Star: Long wick at top – sellers taking over.
Bearish Engulfing: Red candle engulfs previous green one.
Evening Star: Opposite of Morning Star.
Candlestick mastery = understanding buyer vs seller fight in every candle.
🧰 Indicators & Oscillators – Your Technical Tools
Indicators are formulas applied to price data to give more insight.
🛣️ Trend Indicators
Moving Averages (MA):
SMA: Simple Moving Average.
EMA: Exponential (gives more weight to recent price).
Used to identify and confirm trends.
MACD (Moving Average Convergence Divergence):
Measures momentum and crossover signals.
Parabolic SAR:
Gives entry/exit dots on chart.
📉 Momentum Indicators (Oscillators)
RSI (Relative Strength Index):
Measures overbought (>70) or oversold (<30).
Stochastic Oscillator:
Shows momentum, good for spotting reversal zones.
CCI (Commodity Channel Index):
Helps detect cyclical trends.
These are tools to confirm what you see on price action – never trade based on indicators alone.
🧪 Volume – The Fuel Behind Moves
Volume tells you how strong or weak a price move is.
Rising volume + rising price = strong uptrend.
Low volume + breakout = fakeout risk.
Volume spike at support/resistance = possible reversal or breakout.
Smart traders always watch volume with price action. It shows institutional interest.
🧱 Building a Trading Setup (Strategy Framework)
A solid technical trading setup has:
Market Context (Trend, Sentiment)
Entry Trigger (Pattern, Indicator, Breakout)
Stop Loss Level (Support/Resistance, ATR, Swing High/Low)
Target (Risk:Reward ratio, Resistance/Support, Fibonacci)
Volume Confirmation
Risk Management Plan
🧠 Psychological Mastery in TA
Even the best technical setup can fail without the right mindset.
Stick to Plan: Don’t react emotionally.
Accept Losses: TA gives probabilities, not guarantees.
Avoid Overtrading: Quality > Quantity.
Backtest Your Strategies: Practice builds confidence.
Mastering TA is not just about charts – it’s about mastering yourself.
🧪 Advanced Concepts in Technical Analysis
Once you’re comfortable with the basics, explore:
🔁 Fibonacci Retracement & Extensions
📏 Average True Range (ATR) for volatility
📈 Ichimoku Cloud for trend + momentum
🔎 Multi-Time Frame Analysis
🔄 Divergence (RSI/Price divergence for reversal signals)
These tools help fine-tune entries and exits.
🧩 Common Mistakes in Technical Analysis
Avoid these traps:
Trading every breakout – wait for confirmation.
Ignoring the trend – don’t go against it.
Using too many indicators – analysis paralysis.
Revenge trading – leads to big losses.
Disrespecting stop loss – small loss can become disaster.
✅ How to Master Technical Analysis?
Learn from real charts – theory alone won’t help.
Practice Daily – track 1-2 instruments closely.
Journal Your Trades – analyze what worked/failed.
Backtest Setups – check success over historical data.
Follow Experts – learn from professional TA traders.
Join Communities – share and get feedback.
Consistency is the key to mastery. 📈
🧠 Final Thoughts: Why Technical Analysis Works
Because humans behave in predictable patterns, and TA captures those behaviors in charts. Whether it’s fear of missing out or panic selling, the psychology leaves footprints on price action.
You don’t need to predict the future. You need to react smartly to what the chart is telling you.
Mastering technical analysis takes time, patience, and lots of screen time – but once you get it, it becomes a powerful edge in the market.
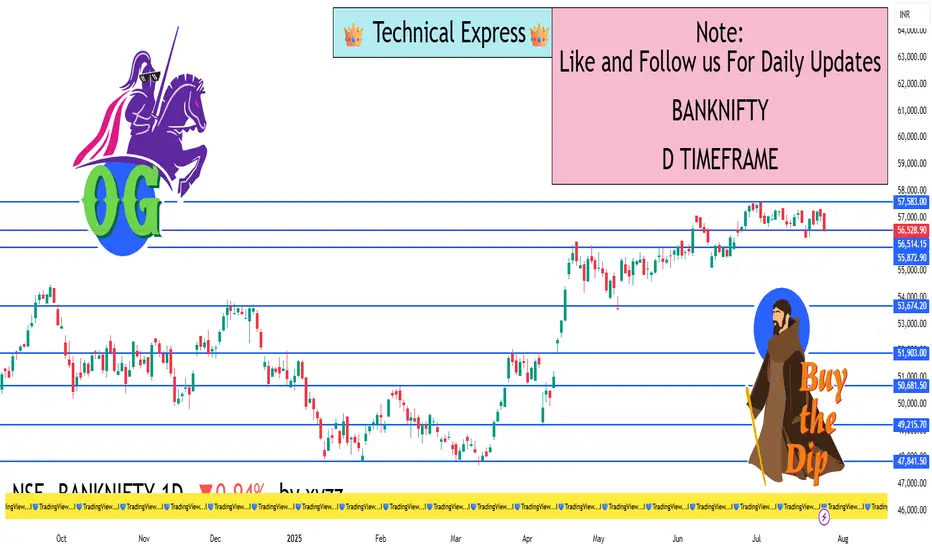
BANKNIFTY 1D TimeframeClosing Price: ₹56,528.90
Opening Price: ₹57,113.90
Day High: ₹57,170.70
Day Low: ₹56,439.40
Net Change: –₹537.15 (–0.94%)
🔹 Key Price Levels
📉 Support Zones:
Support 1 (S1): ₹56,255
Support 2 (S2): ₹55,982
Support 3 (S3): ₹55,524
Fibonacci Support Zone: ₹56,260 – ₹56,430
Camarilla Support Levels: ₹56,460 / ₹56,395 / ₹56,328
📈 Resistance Zones:
Resistance 1 (R1): ₹56,987
Resistance 2 (R2): ₹57,444
Resistance 3 (R3): ₹57,718
Fibonacci Resistance Zone: ₹56,992 – ₹57,165
Camarilla Resistance Levels: ₹56,596 / ₹56,663 / ₹56,730
🔸 Pivot Point (Central Level): ₹56,713
🔹 Trend Direction (1-Day Timeframe)
📊 Short-Term Trend: Consolidating with mild bearish pressure.
📉 Price closed below pivot point (₹56,713), signaling short-term weakness.
✅ Still within bullish structure as long as it holds above ₹55,980 – ₹56,000.
🔹 Technical Indicator Snapshot
RSI: Around 58 → Still in bullish territory, but momentum cooling.
MACD: Positive crossover, but histogram flattening — sign of range or pause.
20 EMA: Near ₹57,000 → Price is currently below this level.
50 EMA: Around ₹55,500 → Still acts as major support.
Price Action: Forming inside candles → Indicates compression/indecision.
Advance Option Trading⚙️ Advance Option Trading
Advance Option Trading helps you level up your skills and trade like the pros!
It’s not just about buying Calls or Puts — it's about using smart, multi-leg strategies like:
🔹 Iron Condors
🔹 Butterflies
🔹 Credit Spreads
🔹 Calendar Spreads
These strategies let you profit from:
📈 Price movement
⏳ Time decay (Theta)
🌪️ Volatility changes (Vega)
🔍 What You'll Learn:
Greeks mastery – Delta , Theta , Gamma , Vega
Risk control – Trade with limited loss & defined risk
Trade adjustments – Fix or flip trades smartly
High-probability setups – Trade based on logic, not luck
💡 Perfect For:
✅ Experienced traders
✅ Options scalpers & income seekers
✅ Anyone ready to trade like institutions
🚀 Final Thought:
Trade smarter. Risk less. Profit more.
Advance Option Trading is your path to professional-level strategies with control, clarity, and consistency.

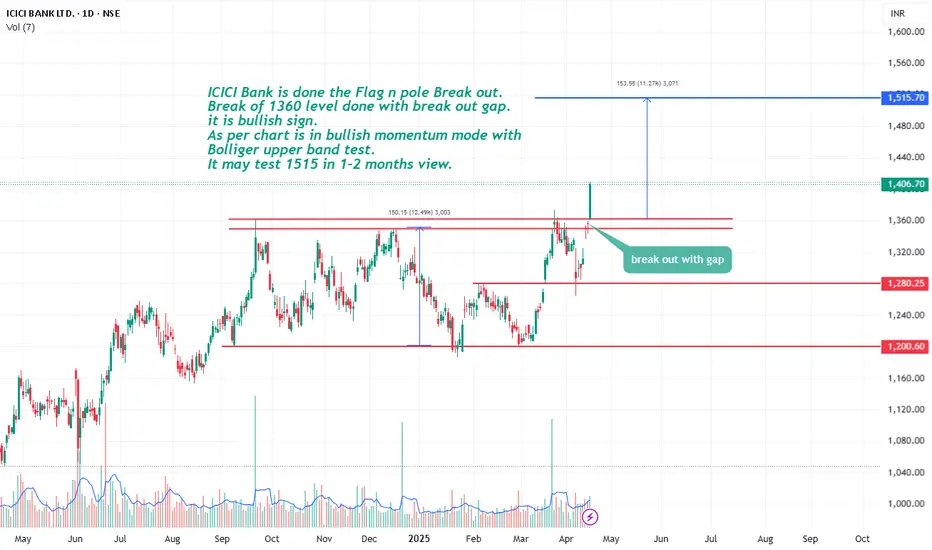
ICICI Bank on flag n pole breakout ICICI Bank is done the Flag n pole Break out. Break of 1360 level done with break out gap.
it is bullish sign. As per chart is in bullish momentum mode with Bolliger upper band test.
It may test 1515 in 1-2 months view.
Bank-nifty Inverse H&S pattern. It may test 55055 soon...Inverse H&S pattern with neckline 53800, Any dip would be buying opportunity for target 55055.

finnifty Inverted H&S on daily TFFinnifty has also made similar setup like nifty and banknifty, i,e., inverted H&S. to get timely and updates during market hours dm.

Finnifty moments for option trading 21/Nov/2024Finnifty moments for option trading 21/Nov/2024
follow us for more updates and information.

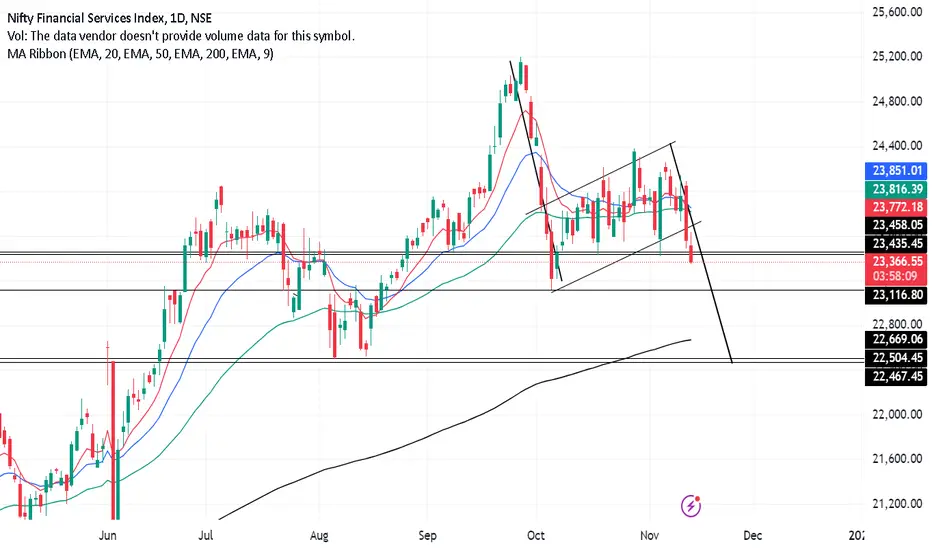
FINNIFTY FALL is on the way. chart has given clear breakdown of the bearish flag pattern in fin nifty.
Quarter numbers of major comps are weak, Inflation is rerouting and now CASA will again go down, sips at peak and retailers will buy this dip.
NBFC and BANKS will suffer more now.
FINNIFTY MATHEMATICAL LEVELSThese Levels are based on purely mathematical calculations.
Validity of levels are upto expiry of current week.
How to use these levels :-
* Mark these levels on your chart.
* Safe players Can use 15 min Time Frame
* Risky Traders Can use 5 min. Time Frame
* When Candle give Breakout / Breakdown to any level we have to enter with High/Low of that breaking candle.
* Targets will be another level marked on chart
* Stop Loss will be Low/High of that Breaking Candle.
* Trail your SL with every candle.
* Avoid Big Candles as SL will be high then.
* This is one of the Best Risk Reward Setup.
For Educational purpose only

FINNIFTY MATHEMATICAL LEVELS FOR NEXT EXPIRYThese Levels are based on purely mathematical calculations.
Validity of levels are upto expiry of current week.
How to use these levels :-
* Mark these levels on your chart.
* Safe players Can use 15 min Time Frame
* Risky Traders Can use 5 min. Time Frame
* When Candle give Breakout / Breakdown to any level we have to enter with High/Low of that breaking candle.
* Targets will be another level marked on chart
* Stop Loss will be Low/High of that Breaking Candle.
* Trail your SL with every candle.
* Avoid Big Candles as SL will be high then.
* This is one of the Best Risk Reward Setup.
For Educational purpose only

FINNIFTY MATHEMATICAL LEVELS FOR THIS WEEKThese Levels are based on purely mathematical calculations.
Validity of levels are upto expiry of current week.
How to use these levels :-
* Mark these levels on your chart.
* Safe players Can use 15 min Time Frame
* Risky Traders Can use 5 min. Time Frame
* When Candle give Breakout / Breakdown to any level we have to enter with High/Low of that breaking candle.
* Targets will be another level marked on chart
* Stop Loss will be Low/High of that Breaking Candle.
* Trail your SL with every candle.
* Avoid Big Candles as SL will be high then.
* This is one of the Best Risk Reward Setup.
For Educational purpose only

FINNITY MATHEMATICAL LEVELS FOR THIS WEEKThese Levels are based on purely mathematical calculations.
Validity of levels are upto expiry of current week.
How to use these levels :-
* Mark these levels on your chart.
* Safe players Can use 15 min Time Frame
* Risky Traders Can use 5 min. Time Frame
* When Candle give Breakout / Breakdown to any level we have to enter with High/Low of that breaking candle.
* Targets will be another level marked on chart
* Stop Loss will be Low/High of that Breaking Candle.
* Trail your SL with every candle.
* Avoid Big Candles as SL will be high then.
* This is one of the Best Risk Reward Setup.
For Educational purpose only

MAs financial ser is on Reversal mode.MAs financial is on reversal mode. As per chart protecting it's current low 272. Indicator are giving bullish indications. It may test 326 and 380 soon.

FINNIFTY MATHEMATICAL LEVELS FOR THIS WEEKThese Levels are based on purely mathematical calculations.
Validity of levels are upto expiry of current week.
How to use these levels :-
* Mark these levels on your chart.
* Safe players Can use 15 min Time Frame
* Risky Traders Can use 5 min. Time Frame
* When Candle give Breakout / Breakdown to any level we have to enter with High/Low of that breaking candle.
* Targets will be another level marked on chart
* Stop Loss will be Low/High of that Breaking Candle.
* Trail your SL with every candle.
* Avoid Big Candles as SL will be high then.
* This is one of the Best Risk Reward Setup.
For Educational purpose only

FINNIFTY MATHEMATICAL LEVELS - VALID TILL EXPIRYFin Nifty Mathematical levels use as Support / Resistance.
Mark these levels on your chart.

FINNIFTY MATHEMATICAL LEVELSThese Levels are based on purely mathematical calculations.
Validity of levels are upto expiry of current week.
How to use these levels :-
* Mark these levels on your chart.
* Safe players Can use 15 min Time Frame
* Risky Traders Can use 5 min. Time Frame
* When Candle give Breakout / Breakdown to any level we have to enter with High/Low of that breaking candle.
* Targets will be another level marked on chart
* Stop Loss will be Low/High of that Breaking Candle.
* Trail your SL with every candle.
* Avoid Big Candles as SL will be high then.
* This is one of the Best Risk Reward Setup.
For Educational purpose only

FinNifty weekly expiry analysis for 03/09/2024.Finnifty has been trading in a rising wedge pattern and is trading around the resistance zone of 23800.
For a while the market is being good for option seller and hitting option buyer hard. If the trend changes and market starts trading below 23680, a bearish trade can be entered with previous supports as targets.
In case the market give a break out of the resistance zone above, a small quantity trade can be initiated.
Major support zone is around 23280 and a quality bearish trade can be entered only once the levels is taken out.
Other levels for intraday trades are 23680, 23600, 23490
Resistance zone :- 23840, 23970
Wait for teh price action near the levels before entering the market.
Keep in mind premium decay will be there as tomorrow is the weekly expiry of the index.

FINNIFTY (CNXFINANCE) - A BEARISH CYPHER PATTERN FORMED. NSE:CNXFINANCE
❇️Harmonic chart pattern: BEARISH CYPHER PATTERN
👉🏻The Cypher pattern is one of the most profitable harmonic patterns and is useful for risk management, because of the large success rate. Traders can minimize losses if they follow the Cypher trading rules and meet the profit target.
🚀How to use
❇️The Cypher harmonic pattern is a trading strategy that uses Fibonacci numbers to identify turning points in geometric price patterns. It can help traders predict future movements, determine when trends will reverse, and decide when to buy and sell. Here are some steps for using the Cypher pattern:
❇️1. Draw the patterns
👉🏻Start with a bullish or bearish impulsive move from point X to A. Then, use a Fibonacci retracement tool to find point B between 38.2% and 61.8% of XA, without closing past 61.8%. Next, use a Fibonacci expansion tool to find point C between 127.2% and 141.4% of the move from X to A, without closing past 141.4%. Finally, use a Fibonacci retracement tool to find point D by moving from X to C and reaching the 78.6% region. You can also use a Fibonacci expansion tool to find point D by moving from B to C and landing between 127.2% and 200%.
❇️2. Enter the pattern
👉🏻Traders can enter a Cypher pattern by setting a limit order at the 78.6% level or using a market order after the price starts to reverse.
❇️3. Set stop losses
👉🏻For a bearish Cypher, place stop losses just above point X. For a bullish Cypher, place stop losses just below point X.
❇️4. Set take profits
👉🏻Draw a Fibonacci extension from point C to point D and set multiple take profits. For example, you could set the first take profit at Fibonacci one, the second at 1.272, and the third at 1.618. You can break into the trade when any of the take profits are hit. Many traders partially close their position at point A, but you can also choose point C for a more aggressive approach
ENTRY STATUS: ACTIVE ✅
TARGET 23440-23140-22555 (as per this harmonic chart pattern)
SL 23670
🚀Happy trading 🫡
👉🏻 @thetradeforecast🇮🇳
