#Finnifty directions and levels for NOV 24th"Good morning, friends! As of November 24th, there is no significant difference in the global and our local market sentiments compared to the last session. The global market sentiment remains bullish, indicated by the Dow Jones. However, our local market shows a moderately bearish trend. It might open with a slight gap-up or a neutral start, considering the GiftNifty value at +10.
Subsequently, if the market experiences a pullback, we shouldn't anticipate a significant move unless it breaks the immediate resistance.
Simultaneously, if it faces rejection around the immediate resistance, the market will likely continue within a range.
Conversely, if the gap-up isn't sustained or if it opens with a gap-down, we can anticipate a similar range-bound market sentiment. Correction may occur if the market breaches the immediate support zone."
Finniftyintradatradesetup

#Finnifty directions and levels for NOV 23"Good morning, friends! As of November 23rd, there is no significant difference from the last session. The global market sentiment is bullish, as indicated by the Dow Jones. However, our local market is showing a moderately bearish trend. It may open with a slight gap-up or a neutral start, as the GiftNifty indicates a value of +10. After that, even if the market takes a pullback, we can't expect a big move that doesn't break the immediate resistance. At the same time, if it rejects around the immediate resistance, then it will turn into a range market. On the other hand, if the gap-up doesn't sustain or if it opens gap-down, we can expect the same range market sentiment, and correction will occur when the market breaks yesterday's low."

#finnifty directions and levels for NOV 21"Good morning, friends! As of November 21st, the global market sentiment is bullish, as indicated by the Dow Jones. However, our local market is showing a moderately bearish trend. It may open with a slight gap-up, or a neutral start, as the GiftNifty indicates a value of +60. There is no significant difference compared to the last session. Structurally, we can expect a range-bound market, either if it undergoes a pullback or if the gap-up doesn't sustain. In my personal opinion, we should wait for confirmation at the immediate support or resistance levels before expecting the next move."

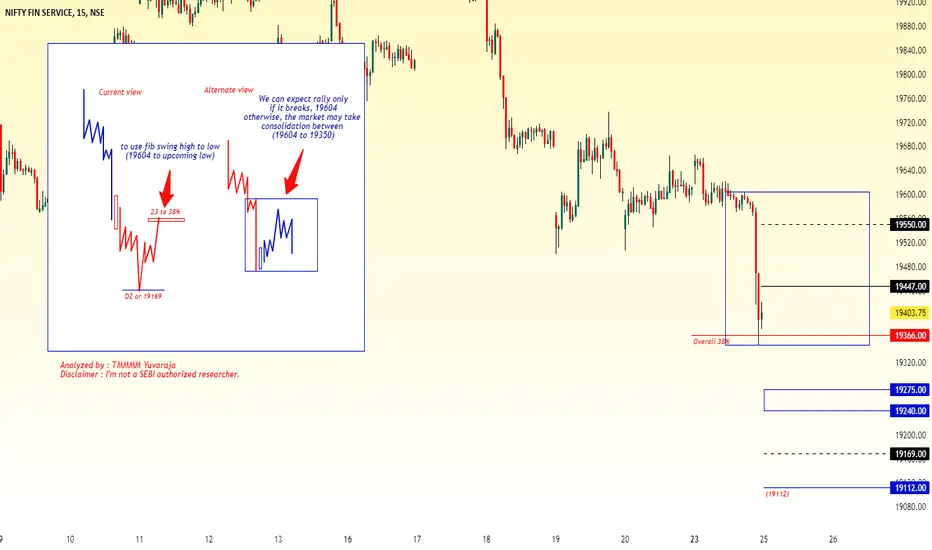
fin nifty futures short side fin nifty futures short side setup
entry level near the 19550-60
target level 100 points
stop loss above of the candle i.e 19580(19590)

Fin Nifty Future chart analysis for 06.11.2023If trigger line crosses over 57.30, it may reach to 67.09, 130-170 Rs in option.
If trigger line crosses below 49.80, it may reach to 39.09, 70 to 105 Rs in Option.

#finnifty direction and levels for NOV 3"Good morning, friends! As of November 3, the global market sentiment is bullish, as indicated by the Dow Jones. Our local market is also showing a moderate bullish trend. It may open with a long gap-down start because the gift nifty indicates 100+. If it opens with a long gap-up, we can expect a rally continuation when it sustains. On the other hand, if it doesn't sustain after the gap-up and undergoes a minimum 38% Fibonacci correction, we should consider this as a corrective change."

#Finnifty direction and levels for NOV 2"Good morning, friends! As of November 2, the global market sentiment is bullish, as indicated by the Dow Jones. Our local market is also showing a moderate bearish trend. It may open with a long gap-down start because the Giftnifty indicates 150+. If it opens with a long gap-up, we can expect a rally continuation when it sustains (it should break the minor 78%). On the other hand, after the gap-up, if the market rejects around the minor levels of 61 or 78%, then we can expect a range market correction."

#Finnifty direction and levels for NOV 1st"Good morning, friends! As of November 1st, there is no significant difference between the last session, and the global market sentiment is moderately bullish, as indicated by the Dow Jones. Our local market is also showing a moderate bullish trend. It may open with a neutral to slightly gap-down start. There is a 5th correctional wave, so if the gap-down sustains, we can expect correction continuation. On the other hand, if a pullback occurs followed by a gap-down, we can anticipate a range market between yesterday's high and the Fibonacci level of 61%."

Finnifty Live Intraday Updates for 31-10-23 !FinNifty important levels to watch are as follows
#Support: 19245
Sell below: 19245 only on 15 minute candle closure below the level.
Target 1: 19145
Target 2: 19080
#Resistance: 19386
Buy Above: 19386 only on 15 minute candle closure Above the level.
Target 1: 19450
Target 2: 19545
=> # Remember each level will act as a support and resistance individually so there is a probability of reversal and a pullback on either side so its better to make an habit to book profits at each targets and re-enter again after a breakout from the same with a proper stoploss as per your own risk appetite.
=> # Please do your own research before initiating any trade. Always use stoploss in order to protect your capital.
=> #If you are Unable to trade properly and dissatisfied with your manual trading results due to psychological disadvantages or busy schedule or "Fear & Greed" emotions, then Algorithmic trading can be the most useful solution to overcome such problems. Kindly follow us and join us using details mentioned below the idea.
=> # Please refer our swing based support and resistance indicator if you find it useful give it a like.
=> # Follow us for more such information and educational ideas and Indicators. Give it a like if you appreciate the idea. Queries will be answered in comment section.
#Disclaimer: This is just a view and published here only for educational purpose, this should not be considered as a buy or sell signal. Trading in stock market may involve financial risk therefore, do your own research before taking any position.

Finnifty monthly expiry analysis for 31/10/23.A bullish engulfing daily candle is showing some positivity in the market. Finnifty has closed above the 20 ema and 110 point higher.
It is about to test 38.2% fibonacci level around 19300 level after the fall of last week.
Global markets at this time are trading in green. Look for close of global market in the morning as indian market will act accordingly.
On the hourly charts, there was a bearishness in the morning and after that it recover giving 300 point move from the day low.
Support :- 19200, 19000
Resistance :-19290, 19420
Tomorrow is the monthly expiry of the index and there are high chances of a good moment in the index. Watch option premiums and trade according to the setup.
Wait for the price action near the levels before entering the market.

#Finnifty directions and levels for oct31"Good morning, friends! As of October 31st, the global market sentiment is moderately bullish, as indicated by the Dow Jones. Our local market is also showing a moderate bullish trend. It may open with a neutral to slightly gap-down start. After that, if a pullback occurs, we can anticipate a continuation of the pullback. On the other hand, there is a sub-wave 4th in progress, so if it undergoes a correction, we can complete it and expect a 5th correction. However, it should break the Fibonacci level of 38%. If it does break the 38% level, we can consider this as the 5th correction (5th in a 5-sub-wave structure)."

#Finnifty directions and levels for oct30"Good morning, friends! As of October 30th, the global market sentiment is bearish, as indicated by the Dow Jones. Our local market is also showing a moderate bearish trend. It may open with a neutral to slightly gap-down start. Structurally, we can expect a minor correction ranging from 38% to 61%. After that, if a pullback occurs, we can anticipate a range-bound market with a potential for continuation. On the other hand, if it breaks the previous bottom, the correction is likely to persist. However, if the market opens with a gap-up, we can only expect pullback continuation if it manages to sustain."

FIN NIFTY - Target Levels - 30.10.23Its Helpful & Useful For Newers & Beginners Of Trading...
Learn & Earn With You Own...
Fin Nifty Spot Price : 19129.2 - India Vix Spot : 10.91% -
Nifty Daily Range : 18998 To - 19261-
Watch Option Strike : Above Break Even Point Buy : 42800 CE
Watch Option Strike : Below Break Even Point Buy : 42800 PE
Always Select ITM Strike Price only
Split The Screen In Your Mobile. Then View The Market Moves & Target Points At Same Time.
Top Nifty & Bottom Bank Nifty.
See My Reversal Target Level - Long Wick Is Shown Only. The Reversal Trend Is Activated. OtherWise Leave It. And Achieve The Target Point.
Second By Second Change The Trailing Stop Loss.. Don't Loss Your Hard Money..
Draw & Watch The Target Points :
Entry Point... & Stop Loss... & Target Point ...Is Yours...
In UpTrend (CE Buy).. Or DownTrend (PE Buy).. Every Target Point Is a Buy Entry Of After Small Retracement. Please Check.
(Watch 5 Days See My Option Strike Target Levels Is Accurate Or Not)
I Am Not Sebi Registered Analysis, This Is Education Purpose Only.
Dear Followers.. Trend Is Our Friend..
1. Draw The Lines In Your Trading View.. Then Only You Understand My Statistical Startegy.
2. Kindly Watch My Break Even Point. Every Day..
3. Above The Break Even Point.. Resistance Break.. UPTrend Starts.. Buy CE..
4. Below The Break Even Point.. Support Break.. DownTrend Starts.. Buy PE..
5. After Retracement.... Stop Loss is Above Or Below Break Even Point..
6. Stop Loss Is Must..
7. Watch 5 Mins Time Frame.. & 15 Mins Time Frame..
8. In Future i Analysis & Focus On Option Strike - Entry, Target, Stop Loss. Also..
9. Above The Target Point Create One 3 min / 5 min Candle. Then One You Take The Buy Entry.
Don"t Enter Blindly.
1. We Focus On Our Daily Analysis..
2. Combination Theory Of Delta, Gamma, Thetta, & Vega.
3. Selection Of OI Analysis.. & Determination Of Volume Calculation.. & Sum Of Implied Volatility Theory
4. We See 4 Types Of Fibinacci Retracement Levels..
(1.High To Low Fib Level, 2.Low To High Fib Level, 3.Long Fib Level & 4. Short Fib Level),
5. Techninal View On Break Even Point.. & Prediction Of Entry, Targets, & Stop Loss..
6. Wait For Support Breaking or Resistance Breaking.. That Time Watch The Market Carefully..
7. Market Moves in UpTrend or DownTrend..
8. Kindly Watch Both The Nifty Target Levels & Bank Nifty Target Levels in your Trading View..
Its Most Important For Daily Tradings..
9. Buy At Low.... Sell At High.... Is The Concept Of Day Tradings..
Kindly Follow My Channel & Like Your Support & Share My Ideas.
TAMIL.. TAMIL... TAMIL.... Engum Tamil.. Ethilum Tamil.. VALGA VALAMUDAN..
Ithu Oru Tamilanin Thoguppu..
Like Pannunga.. Comment Pannunga.. Share Pannunga.. & Profit Pannunga...
Marakkama Unga Friends & Relatives a - market1tomorrow - la Join Panna Sollunga..
This Is My Trading Phychology Of
market1tomorrow

#finnifty direction and levels for oct27"Good morning, friends! As of October 27th, the global market sentiment is bearish, as indicated by the Dow Jones. Our market is also bearish. It may open with a neutral to slightly gap-up. After that, if the market takes a pullback, we can expect a 23% to 38% pullback wave. On the other hand, if the gap-up doesn't sustain, the correction will likely continue."

FIN NIFTY - Target Levels - 27.10.23Its Helpful & Useful For Newers & Beginners Of Trading...
Learn & Earn With You Own...
Fin Nifty Spot Price : 18922.7 - India Vix Spot : 11.73% -
Nifty Daily Range : 18783 To - 19063-
Watch Option Strike : If Above Break Even Point Buy : 18700 CE
Watch Option Strike : If Below Break Even Point Buy : 19100 PE
Always Select ITM Strike Price only
Split The Screen In Your Mobile. Then View The Market Moves & Target Points At Same Time.
Top Nifty & Bottom Bank Nifty.
See My Reversal Target Level - Long Wick Is Shown Only. The Reversal Trend Is Activated. OtherWise Leave It. And Achieve The Target Point.
Second By Second Change The Trailing Stop Loss.. Don't Loss Your Hard Money..
Draw & Watch The Target Points :
Entry Point... & Stop Loss... & Target Point ...Is Yours...
In UpTrend (CE Buy).. Or DownTrend (PE Buy).. Every Target Point Is a Buy Entry Of After Small Retracement. Please Check.
(Watch 5 Days See My Option Strike Target Levels Is Accurate Or Not)
I Am Not Sebi Registered Analysis, This Is Education Purpose Only.
Dear Followers.. Trend Is Our Friend..
1. Draw The Lines In Your Trading View.. Then Only You Understand My Statistical Startegy.
2. Kindly Watch My Break Even Point. Every Day..
3. Above The Break Even Point.. Resistance Break.. UPTrend Starts.. Buy CE..
4. Below The Break Even Point.. Support Break.. DownTrend Starts.. Buy PE..
5. After Retracement.... Stop Loss is Above Or Below Break Even Point..
6. Stop Loss Is Must..
7. Watch 5 Mins Time Frame.. & 15 Mins Time Frame..
8. In Future i Analysis & Focus On Option Strike - Entry, Target, Stop Loss. Also..
9. Above The Target Point Create One 3 min / 5 min Candle. Then One You Take The Buy Entry.
Don"t Enter Blindly.
1. We Focus On Our Daily Analysis..
2. Combination Theory Of Delta, Gamma, Thetta, & Vega.
3. Selection Of OI Analysis.. & Determination Of Volume Calculation.. & Sum Of Implied Volatility Theory
4. We See 4 Types Of Fibinacci Retracement Levels..
(1.High To Low Fib Level, 2.Low To High Fib Level, 3.Long Fib Level & 4. Short Fib Level),
5. Techninal View On Break Even Point.. & Prediction Of Entry, Targets, & Stop Loss..
6. Wait For Support Breaking or Resistance Breaking.. That Time Watch The Market Carefully..
7. Market Moves in UpTrend or DownTrend..
8. Kindly Watch Both The Nifty Target Levels & Bank Nifty Target Levels in your Trading View..
Its Most Important For Daily Tradings..
9. Buy At Low.... Sell At High.... Is The Concept Of Day Tradings..
Kindly Follow My Channel & Like Your Support & Share My Ideas.
TAMIL.. TAMIL... TAMIL.... Engum Tamil.. Ethilum Tamil.. VALGA VALAMUDAN..
Ithu Oru Tamilanin Thoguppu..
Like Pannunga.. Comment Pannunga.. Share Pannunga.. & Profit Pannunga...
Marakkama Unga Friends & Relatives a - market1tomorrow - la Join Panna Sollunga..
This Is My Trading Phychology Of
market1tomorrow

#finnifty directions and levels for oct25"Good morning, friends! As of October 25th, the global market sentiment is moderately bearish, as indicated by the Dow Jones. However, our market is also bearish. It may open with a slight gap-up. After that, if the gap-up doesn't sustain, we can expect a continuation of the correction with minor pullbacks. On the other hand, if the gap-up sustains, we can expect a range-bound market between the previous stock. We can anticipate a rally only if it breaks the top of the minor correction starting point."
Finnifty weekly expiry on 23/10/23.Finnifty on the weekly charts has been consolidating in a narrow range, taking support around 19550 levels.
On the weekly chart, market has closed below the 20 ema. It has closed below the closing range of 19800-19830.
There is a nice support around the 19500 level as it has been tested thrice recently. It tried to recover after a gap down opening.
It has formed an inside candle on the daily charts while closing between both the moving averages.
On the hourly charts, it is forming a bullish pattern of higher high higher low. There is a ascending triangle pattern.
Tomorrow is it weekly expiry due to the holiday on tuesday.
Support :- 19540, 19450
Resistance :- 19640, 19700, 19850
Markets are still unable to go trending and there are high chances of market following through the movement as the monthly expiries of other indices are approaching.
Wait for the price action near the levels before entering the market.

#finnifty directions and levels for #october20"Good morning, friends! As of October 20th, there is no significant difference between the last session, and the global market sentiment is negative, as indicated by the Dow Jones. However, our market is bearish. It may open with a significant gap-down. After that, the market may find support around the immediate support level, and we can expect a minor pullback (23% to 38% Fibonacci level). On the other hand, if the correction breaks the immediate support level, then the correction is likely to continue. Today also the GiftNifty indicates a long gap-down, so if there are any changes in the market's direction, I will inform you in the mid-market session."

Finnifty directions and levels for #October19"Good morning, friends! As of October 19th, the global market sentiment is negative, as indicated by the Dow Jones. However, our market is moderately bearish. It may open with a significant gap-down. After that, the market may find support around the immediate support level, and we can expect a minor pullback (23% to 38% Fibonacci level). On the other hand, if the correction breaks the immediate support level, then the correction is likely to continue.

Finnifty Expiry Trade Setup for 17-10-2023FinNifty important levels to watch are as follows
#Support: 19930
Sell below: 19930 only on 15 minute candle closure below the level.
Target 1: 19900
Target 2: 19850
#Resistance: 19980
Buy Above: 19980 only on 15 minute candle closure Above the level.
Target 1: 20015
Target 2: 20065
=> # Remember each level will act as a support and resistance individually so there is a probability of reversal and a pullback on either side so its better to make an habit to book profits at each targets and re-enter again after a breakout from the same with a proper stoploss as per your own risk appetite.
=> # Please do your own research before initiating any trade. Always use stoploss in order to protect your capital.
=> #If you are Unable to trade properly and dissatisfied with your manual trading results due to psychological disadvantages or busy schedule or "Fear & Greed" emotions, then Algorithmic trading can be the most useful solution to overcome such problems. Kindly follow us and join us using details mentioned below the idea.
=> # Please refer our swing based support and resistance indicator if you find it useful give it a like.
=> # Follow us for more such information and educational ideas and Indicators. Give it a like if you appreciate the idea. Queries will be answered in comment section.
#Disclaimer: This is just a view and published here only for educational purpose, this should not be considered as a buy or sell signal. Trading in stock market may involve financial risk therefore, do your own research before taking any position.

#October17th directions and levels for Finnifty"Good morning, friends! As of October 17th, the global market sentiment is positive, as indicated by the Dow Jones. However, our market trend is in a ranging market. It may open with a gap-up, which indicates a ranging market structure. Therefore, if the market rejects the immediate resistance or if the gap-up doesn't sustain, we can expect a range market continuation. We can expect a pullback continuation only if it breaks the immediate resistance."

Finnifty weekly expiry for 17/10/23.Finnifty has been consolidating in a range for few days. It has formed a doji candle on the daily time and closed below the 20 ema.
Indian markets have been consolidating in a range for few days. Break out or break down can give good targets.
On the hourly charts, the market has given a bearish moving averages cross over. It took resistance from the 20 ema and closed below both the moving averages.
The market can be a trending one this week as there is good consolidation going on in the market.
Watch for the break out or break down in the market and trade with a Stop loss.
On 15 minute time frame, the market has closed around both the moving averages. There is a positive sentiment on the smaller time frame. If the market starts trading above 19850, it can test 19950-20000 levels.
Support :- 19740, 19680
Resistance :- 19860, 19960
In the second half the market has consolidated. Watch for a break out as tomorrow is a weekly expiry and market has given good consolidation.
Wait for the price action near the levels before entering the market.

#October13 directions and levels for finnifty"Good morning, friends! As of October 13th, global market sentiment is negative, as indicated by the Dow Jones. However, our market trend is moderately bullish. It may open with a significant gap down. After that, if it is rejected around the immediate support zone, we can expect a ranging market. On the other hand, if it breaks the immediate support zone, then the correction is likely to continue. If there are any changes, I will inform you during the mid-market update."
