LXEO FLAG & POLELXEO made a FLAG & POLE formation and breakout. We can expect flag target to $12.8 and pole target to $15.5. Entry price above $10.35 with a stoploss of $8.9
We can expext strong resistance at $11.5
Please make your own analysis before taking any trade.
Flagandpole

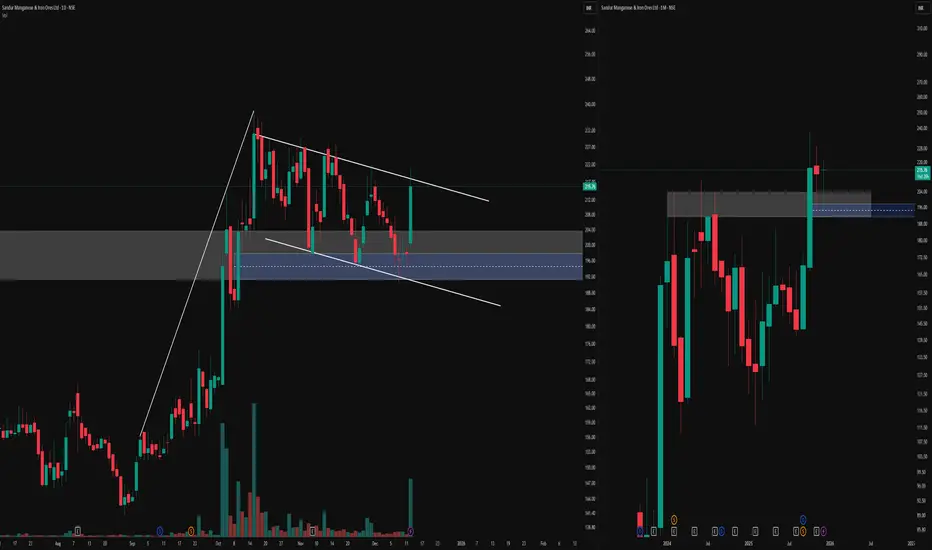
Multi‑Timeframe Flag & Fair Value Gap ObservationOn the left, the daily timeframe is highlighting a potential flag‑and‑pole structure after a strong one‑sided move.
Within this leg, a blue fair value gap has been marked, which price has interacted with multiple times, illustrating how an imbalanced area can act as a reference zone over time.
On the right, the monthly timeframe of the same instrument is added to provide broader structural context to the daily pattern.
This multi‑timeframe layout is meant purely to show how a lower‑timeframe pattern and an identified fair value gap can be viewed alongside the higher‑timeframe trend without attaching any directional bias.
Disclaimer: This post is for educational and illustrative purposes only and does not constitute investment, trading, or financial advice. Always do your own research and consult a registered financial professional before making any trading decisions.
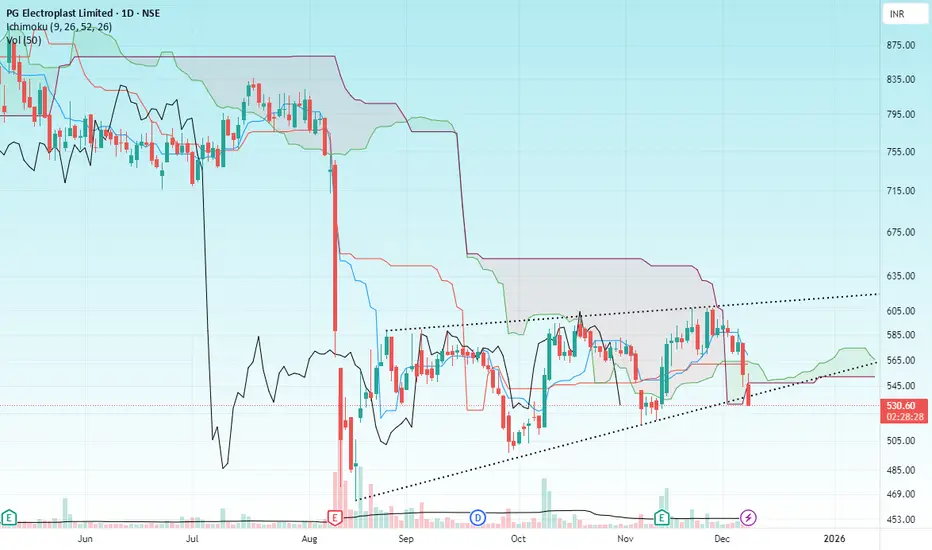
PGELHello & welcome to this analysis
PGEL came out with a statement that analyst seem to have researched another company's financials but posted them as of PGEL.
However, charts suggest a a bearish flag & pole pattern formation is taking place here suggesting more downside below 516.
One can wait for breakdown or use bounce (huge resistance near 565 with a stop loss above 570) for shorting opportunity.
Below 515 it opens for 450.
All the best
Zcash Formed Triple TopZcash Formed Triple Top And Ready For Breakdown.
But Twist is, 0.38 retracement level. trend still strong
Ready short for setup
Reverse Scenario:
Break That Triple Top High
Any Bullish Pattern breakout in smaller time frame.
🧠 Always DYOR (Do Your Own Research)
⚖️ This is not financial advice or suggestion
👉 “Risk Is Real 💸 Stay Practical🚀”
💬 Please feel free to ask any questions (It's Free)

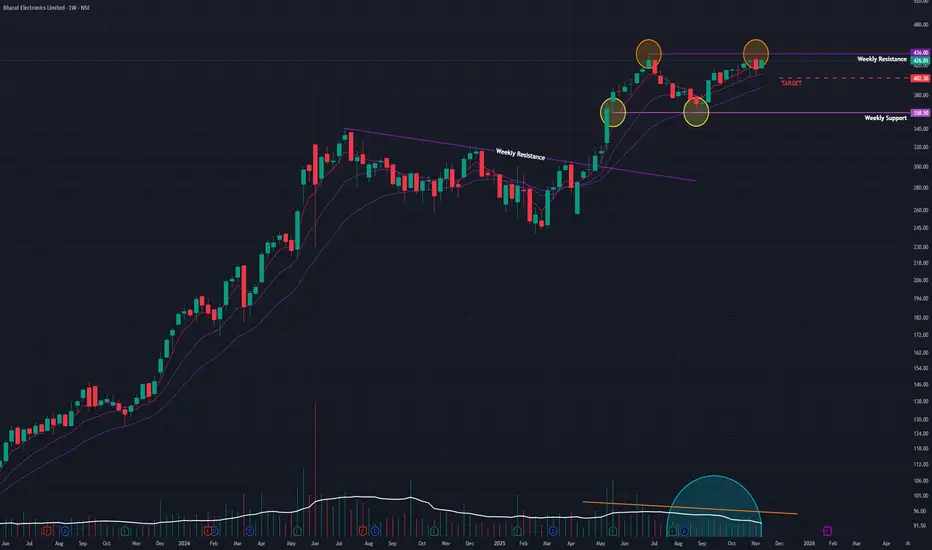
BEL (W): Primed for ATH BreakoutBased on Weekly Timeframe, Logarithmic Scale
This is a classic "coiling spring" setup. The stock is in a tight, bullish consolidation right below its all-time high. A powerful combination of fundamental catalysts, bullish high-timeframe indicators, and classic volume contraction suggests a breakout is highly probable.
🚀 1. The Fundamental Catalysts (The "Why")
This bullish technical pattern is fully supported by a torrent of positive fundamental news, providing a strong "tailwind" for the stock:
- Strong Q2 Earnings: On Oct 31, BEL reported a 26% rise in revenue and an 18% rise in net profit for Q2 2026, beating estimates.
- Massive Order Inflow: The company is announcing new, large-scale orders almost weekly, including ₹792 crore (Nov 10) and ₹871 crore (Nov 14). This provides high visibility for future earnings.
📈 2. The Dominant Pattern: Bullish Consolidation
- The "Flagpole": The stock made a strong move up to its All-Time High (ATH) in June 2025.
- The "Flag": Since then, it has been in a sideways consolidation phase , trading in a tight range just ~2% below its ATH.
- Drying Volume: Volume has been drying up during this consolidation. This is a classic, powerful sign that sellers are exhausted ("supply has dried up") and the stock is being accumulated.
- Recent "Ignition": Last week's +3.04% surge on 73.21M in volume was a significant "ignition" signal, showing that buyers are starting to re-emerge and test the resistance.
📊 3. Confluence of Bullish Indicators
The "trifecta" of bullishness on high timeframes is exceptionally strong:
- RSI: The Relative Strength Index is rising on both the Monthly and Weekly charts, showing that long-term momentum is firmly on the side of the buyers.
- EMAs: The short-term Exponential Moving Averages are in a "PCO" (Price Crossover) state on both the Monthly and Weekly charts, confirming the long-term trend is up.
🎯 4. Future Scenarios & Key Levels to Watch
The price action next week is critical.
🐂 The Bullish Case (Breakout)
- Trigger: A decisive, high-volume weekly close above the ATH resistance (₹436).
- Confirmation: This would confirm the end of the 5-month consolidation and the start of a new leg up into "price discovery."
- Target: The next logical technical price target is around ₹530 .
🐻 The Bearish Case (Breakdown)
- Trigger: If the stock fails to break out and momentum is lost (e.g., due to a broader market pullback).
- Confirmation: The stock would need to break below.
- Target: A failure would see the stock fall to retest its immediate support level at ₹400 .
Conclusion
A "wait and watch" approach is ideal, but the evidence is heavily skewed to the upside. The combination of a perfect technical pattern (high tight flag), bullish high-timeframe indicators, and a powerful fundamental story (earnings + new orders) makes this a textbook setup for an ATH breakout.
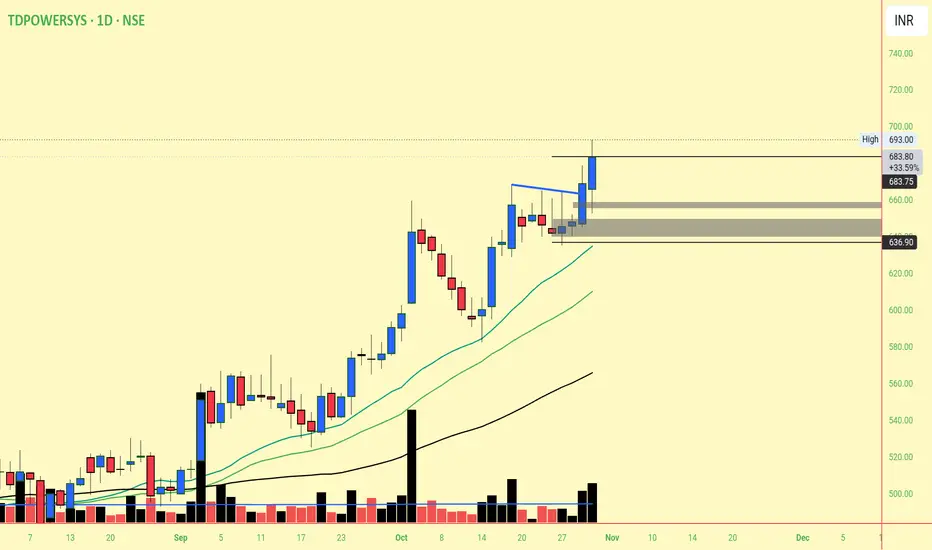
TD Power
Sales Grew 47% YoY and PAT Grew by 49%
Provide good number , also good volume on chart and given break out.
From current level 7% risk .
UBERUBER has recently exhibited a classic Pole and Flag formation on its price chart—typically a bullish continuation pattern that indicates a strong upward trend after a brief consolidation. The "pole" reflects the steep and rapid price rise, while the "flag" represents the short-term consolidation or retracement that follows.
A breakout above the flag’s resistance has been observed, signaling renewed bullish momentum. This breakout suggests that the stock could be entering the next leg of its upward trajectory.
A retracement toward the breakout level could offer a compelling buying opportunity, especially for medium to long-term investors. A stop-loss around $69 is advisable to manage downside risk, as this level marks a key support zone.
If the breakout sustains, the stock has the potential for significant upside over the next 2–3 years, supported by both technical strength and UBER's improving fundamentals and business growth.
Summary :
Pattern Identified: Pole and Flag
Breakout Status: Confirmed
Buy Zone: On retracement near breakout level
Stop Loss: $69
Outlook: Bullish; strong follow-through expected over the next 2–3 years

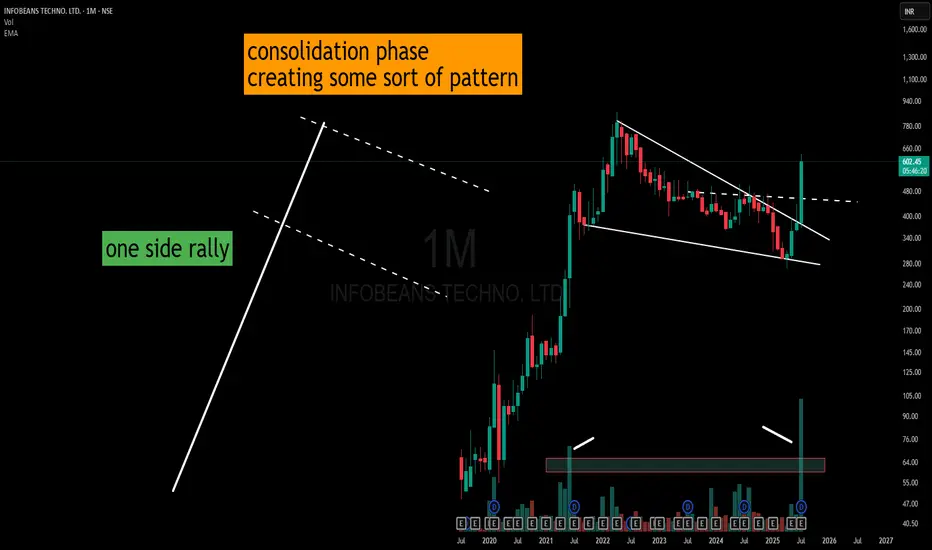
Infobean – Triangle Consolidation with Volume SpikeAfter a sharp one-sided rally, the price entered a prolonged consolidation phase.
Instead of the usual parallel-channel flag formation, the structure has evolved into a descending triangle with slightly lower highs and marginally lower lows.
What stands out is the recent significant volume expansion—often called a “volume buster.” While the shape resembles a pole-then-consolidation setup, the breakout structure and volume shift highlight an important phase change in market activity.
I have only created how I would Draw it and try to get some information out of it.
(This is a structural observation, not a buy/sell recommendation.)
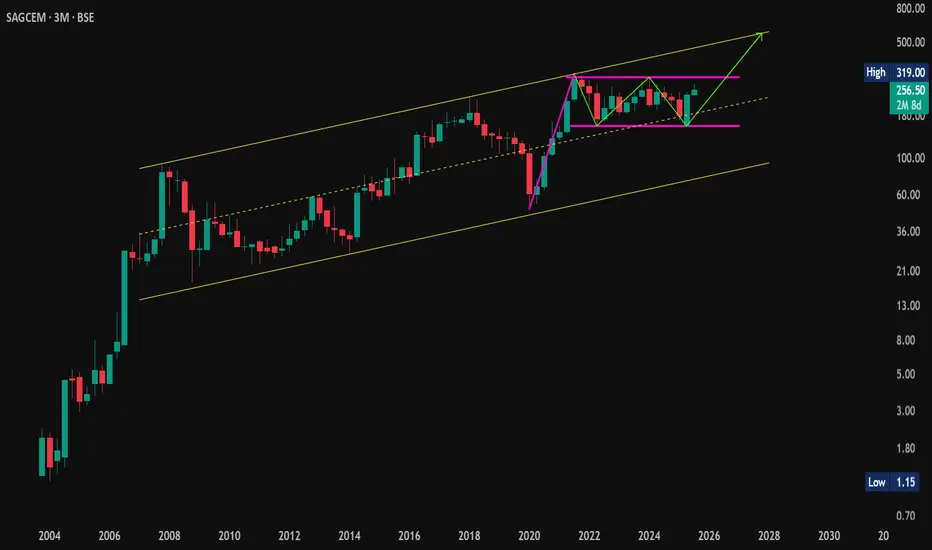
Flag + W Pattern Combo on Monthly! | #SagCem On Radar🔍 #OnRadar
#SagCem (Sagar Cements Ltd.)
🚩 Flag + W Pattern Combo on Monthly!
📈 Chart Timeframe: Monthly & Quarterly (Educational Observation Only)
📊 Technical Structure Overview:
A rare confluence of bullish patterns spotted:
🚩 #FlagPattern — classic continuation structure
🔻🔻 #WPattern (Double Bottom) — bullish reversal signal
🔼 Both developing inside a long-term #AscendingChannel
🎯 Potential Pattern Projections:
Flag Target: 560+
W Pattern Target: 450+
🛡 Support Zones:
255
234–209 (Demand cluster)
❌ Pattern Invalidation:
Below 155 on Monthly Closing Basis (MCB)
🧠 Educational Note:
When multiple bullish structures align on higher timeframes, they often lead to explosive moves—if validated by breakout and volume.
⚠️ Disclaimer:
This is not a buy/sell recommendation. Shared strictly for educational and technical study purposes. Always consult your financial advisor before acting on any market insights.
#PriceAction | #TechnicalAnalysis | #ChartPatterns | #FlagPattern | #Wpattern | #AscendingChannel | #InsideBar | #LongTerm
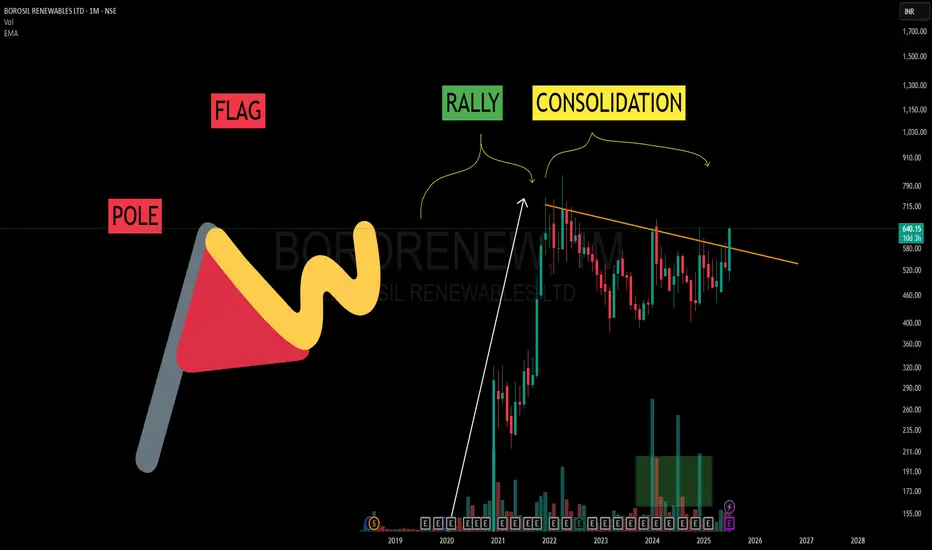
Flag, Pole and Patience– Learning from the Bigger TimeframeIn trading, patterns on higher timeframes often carry deeper meaning.
What you’re seeing in this chart isn’t a forecast — it’s a learning opportunity.
Let’s break this down:
🔺 POLE:
This sharp rally from 2020–2022 represents a strong burst of momentum. That’s your Pole — it shows clean directional intent from market participants.
🏁 FLAG:
After the rally, price didn’t crash — it started consolidating. This sideways or slightly downward structure is known as the Flag.
It often appears as a phase of “cooling off” — traders taking profits, new buyers waiting.
📈 RALLY + CONSOLIDATION = Classic Flag & Pole
A rally followed by consolidation = textbook flag structure.
⏳ And here’s the takeaway:
When viewed on a Monthly (WTF - Way Too Far 😅) timeframe, these patterns take years to form. But that also means they carry weight.
No predictions here. Just learning.
Understanding market rhythm through structure > outcome can be your edge.
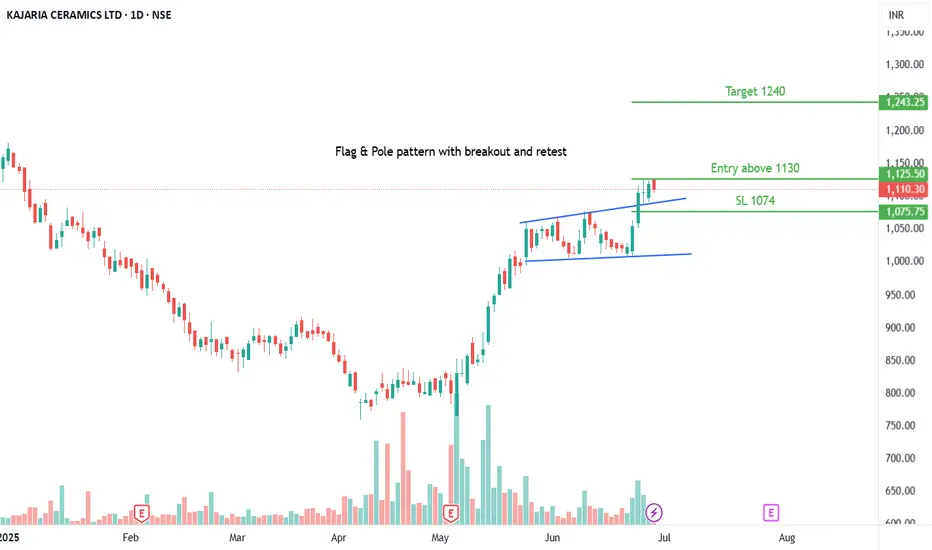
KAJARIACERAll details are given on chart for educational purpose only. If you like the analyses please do share it with your friends, like and follow me for more such interesting charts.
Disc - Am not a SEBI registered analyst. Please do your own analyses before taking position. Details provided on chart is only for educational purposes and not a trading recommendation
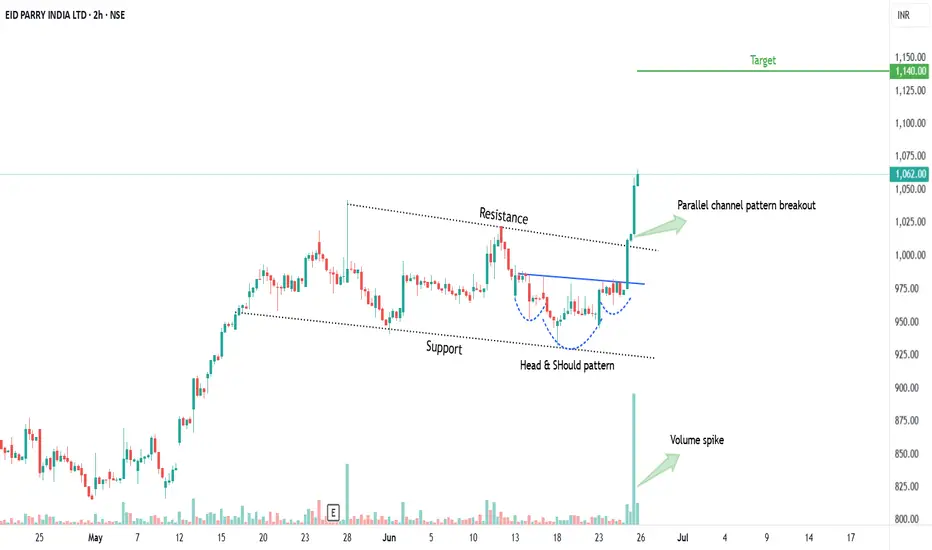
EIDPARRY - HNS & Flag & Pole patternAll details are given on chart for educational purpose only. If you like the analyses please do share it with your friends, like and follow me for more such interesting charts.
Disc - Am not a SEBI registered analyst. Please do your own analyses before taking position. Details provided on chart is only for educational purposes and not a trading recommendation
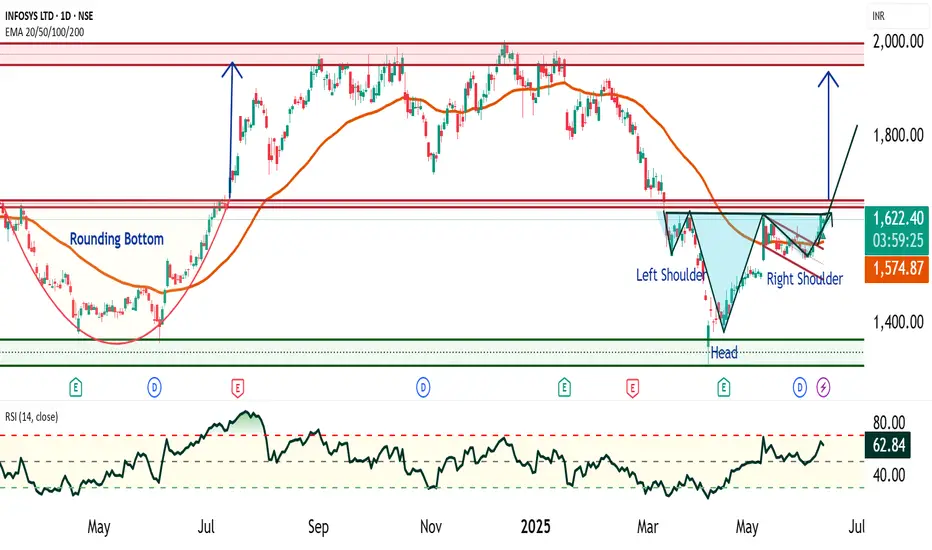
Infosys - Bullish Flag and Head & Shoulder Patterns🔍 1. Infosys Current Price Range and Key Levels
Since January 2021, Infosys has been trading in a broad range between ₹1300 and ₹2000, consolidating for over 4 years. Within this range, there are three key support and resistance levels to watch closely:
Support: ₹1300 (major floor)
Intermediate Resistance/Support Zone: ₹1600 – ₹1650
Strong Resistance: ₹2000 (upper bound)
📈 2. Bullish Flag Pattern: A Bullish Flag is a continuation pattern that forms after a strong upward price move "flagpole", followed by a period of consolidation in a narrow downward or sideways channel "flag". It typically signals a pause before the uptrend resumes.
Infosys recently broke out of a bullish flag pattern and crossed above ₹1580 with a strong closing on higher volume, indicating renewed buying interest.
Price is currently trading above the 50-day Exponential Moving Average (EMA), confirming the continuation of the mid-term uptrend.
However, the zone around ₹1650 remains a strong and key resistance level to monitor closely.
🧩 3. Potential Bullish Head and Shoulders Pattern Above ₹1650
Should Infosys break decisively above ₹1650, it is likely to form another significant bullish pattern known as the Bullish Head and Shoulders.
This pattern signals a trend reversal from bearish to bullish and is considered highly reliable.
Trend: Appears after a downtrend or consolidation, signaling reversal
Touchpoints: Three lows – left shoulder, head (lowest point), and right shoulder, roughly at similar levels
Neckline: The resistance line connecting the highs between shoulders and head
Timeframe: Medium-term, often forming over weeks up to 6 months
Volume: Typically higher volume on left shoulder and head formation, volume dips on right shoulder, and surges on breakout
⚠️ 4. Key Concerns in Infosys Chart Pattern
Price-Volume Divergence: During the head formation, volume increased sharply as price fell — indicating strong selling pressure. However, volume was low when price approached the neckline — suggesting weak buying interest to confirm breakout. This divergence signals potential caution.
Resistance Zone: Price remains below the key resistance at ₹1650, which has acted as a ceiling multiple times. A decisive breakout is required to sustain further upside momentum.
⚠️ Disclaimer
This report is intended solely for educational and training purposes and does not constitute investment advice. Traders and investors should conduct their own research and consult financial advisors before making trading decisions.
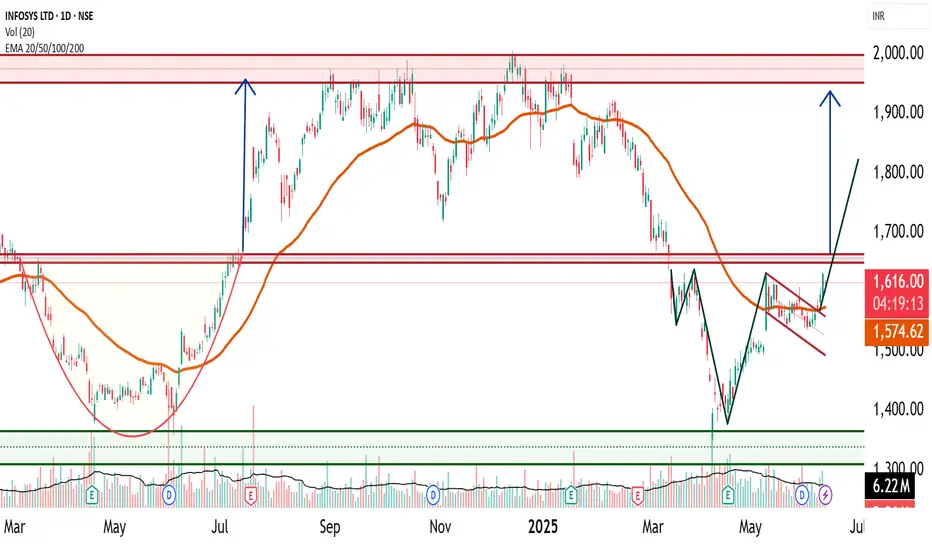
Infosys Technical Research- Flag and Head and shoulders🔍 1. Infosys Current Price Range and Key Levels
Since January 2021, Infosys has been trading in a broad range between ₹1300 and ₹2000, consolidating for over 4 years. Within this range, there are three key support and resistance levels to watch closely:
Support: ₹1300 (major floor)
Intermediate Resistance/Support Zone: ₹1600 – ₹1650
Strong Resistance: ₹2000 (upper bound)
📈 2. Bullish Flag Pattern: A Bullish Flag is a continuation pattern that forms after a strong upward price move "flagpole" , followed by a period of consolidation in a narrow downward or sideways channel "flag". It typically signals a pause before the uptrend resumes.
📊 2. Infosys Recent Technical Development
Infosys recently broke out of a bullish flag pattern and crossed above ₹1580 with a strong closing on higher volume, indicating renewed buying interest.
Price is currently trading above the 50-day Exponential Moving Average (EMA), confirming the continuation of the mid-term uptrend.
However, the zone around ₹1650 remains a strong and key resistance level to monitor closely.
🧩 3. Potential Bullish Head and Shoulders Pattern Above ₹1650
Should Infosys break decisively above ₹1650, it is likely to form another significant bullish pattern known as the Bullish Head and Shoulders (Inverse Head and Shoulders).
Bullish Head and Shoulders
This pattern signals a trend reversal from bearish to bullish and is considered highly reliable.
Trend: Appears after a downtrend or consolidation, signaling reversal
Touchpoints: Three lows – left shoulder, head (lowest point), and right shoulder, roughly at similar levels
Neckline: The resistance line connecting the highs between shoulders and head
Timeframe: Medium-term, often forming over weeks up to 6 months
Volume: Typically higher volume on left shoulder and head formation, volume dips on right shoulder, and surges on breakout
⚠️ 4. Key Concerns in Infosys Chart Pattern
Price-Volume Divergence: During the head formation, volume increased sharply as price fell — indicating strong selling pressure. However, volume was low when price approached the neckline — suggesting weak buying interest to confirm breakout. This divergence signals potential caution.
Resistance Zone: Price remains below the key resistance at ₹1650, which has acted as a ceiling multiple times. A decisive breakout is required to sustain further upside momentum.
⚠️ Disclaimer
This report is intended solely for educational and training purposes and does not constitute investment advice. Traders and investors should conduct their own research and consult financial advisors before making trading decisions.
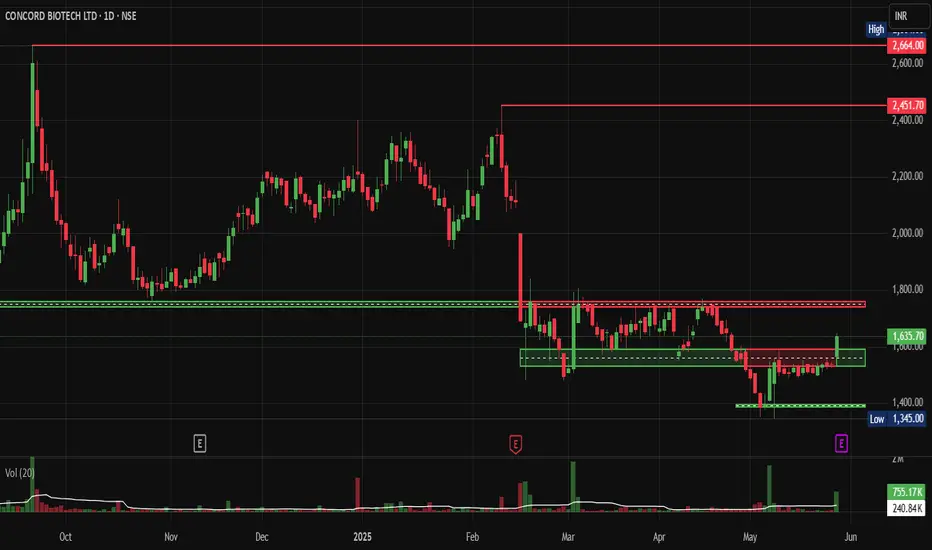
Concordbio: Flag Bo and VCP Setup after 6.5% Surge today.NSE:CONCORDBIO Hidden Pharma Gem Shows Classic VCP Setup After 6.5% Surge - Is Another Breakout Brewing? Well, the Structure looks beautiful, and the Results are tomorrow.
Technical Overview:
NSE:CONCORDBIO presents a compelling technical setup following a dramatic transformation from a prolonged consolidation phase to explosive momentum. The stock has exhibited textbook volatility contraction pattern (VCP) characteristics, culminating in what appears to be a flag breakout formation.
Price Action Analysis:
The stock experienced a significant markup phase from August to October 2024, surging from around ₹1,750 to peak levels near ₹2,664, representing approximately 52% gains. This initial thrust established new 52-week highs and demonstrated strong institutional accumulation based on the volume surge during the breakout phase.
Following this parabolic move, the stock entered a healthy consolidation phase from November 2024 through May 2025, forming a classic flag pattern. During this 6-month consolidation, the stock contracted its volatility significantly, with price action tightening between ₹2,400 resistance and ₹1,900 support levels.
Volume Analysis:
The volume pattern supports the technical setup:
- High volume during initial breakout phase (August-September 2024)
- Declining volume during consolidation (healthy distribution)
- Recent volume pickup suggests smart money accumulation
- Volume at support levels shows buying interest
Volatility Contraction Pattern (VCP) Confirmation
The chart clearly displays VCP characteristics:
- Initial strong uptrend with high volume (August-October 2024)
- Subsequent consolidation with contracting volatility and declining volume
- Multiple pullbacks of decreasing magnitude (typical VCP trait)
- Volume drying up during the consolidation phase, indicating a lack of selling pressure
- Recent volume expansion suggests renewed institutional interest
Key Technical Levels:
Support Levels:
- Primary Support: ₹1,531 (recent swing low)
- Secondary Support: ₹1,450-1,500 (psychological level and previous resistance turned support)
- Critical Support: ₹1,345 (absolute low, breach would invalidate bullish structure)
Resistance Levels:
- Immediate Resistance: ₹1,750-1,800 (flag upper boundary)
- Major Resistance: ₹2,400-2,451 (previous consolidation highs)
- Ultimate Target: ₹2,664 (52-week high)
Base Formation Analysis:
The stock has constructed a robust 6-month flag base following the initial breakout. This base formation shows:
- Tight price action with lower volatility
- Volume contraction during consolidation (healthy sign)
- Multiple retests of support levels without breakdown
- Ascending lows pattern within the flag structure
Trade Setup and Entry Strategy:
Pattern: Flag breakout from VCP base
Entry Zone: ₹1,650-1,680 (on breakout above flag resistance with volume)
Confirmation: Daily close above ₹1,700 with 2x average volume
Stop Loss: ₹1,500 (below key support and flag low)
Risk-Reward Ratio: Approximately 1:2.5
Target Levels:
- Target 1: ₹1,900 (measured move from flag pole)
- Target 2: ₹2,100 (intermediate resistance)
- Target 3: ₹2,400-2,450 (major resistance zone)
Position Sizing: Risk 1-2% of portfolio capital given the stop loss distance
Sectoral and Fundamental Backdrop:
NSE:CONCORDBIO operates in the pharmaceutical fermentation and biotechnology space, specialising in complex fermentation-based APIs and biosimilars. The sector has been experiencing renewed interest due to:
- India's growing prominence in global pharmaceutical supply chains
- Increasing focus on biosimilars and complex generics
- Government initiatives supporting domestic pharmaceutical manufacturing
- Rising healthcare expenditure and demand for specialised medicines
The company's fundamentals appear supportive of the technical breakout, with the fermentation and biotech segments showing strong growth potential in the post-pandemic environment.
Risk Factors:
- Broader market volatility could impact individual stock performance
- Pharmaceutical sector faces regulatory risks and pricing pressures
- Global economic uncertainties affecting export-dependent companies
- Technical failure below ₹1,500 would invalidate the bullish thesis
My Take:
NSE:CONCORDBIO presents a high-probability technical setup combining VCP pattern characteristics with flag breakout potential. The 6-month consolidation has allowed the stock to digest previous gains while building energy for the next leg higher. Current price action near key support levels offers an attractive risk-reward opportunity for momentum traders and swing investors.
The combination of strong sectoral tailwinds, solid base formation, and classic technical patterns makes this an interesting candidate for breakout traders willing to accept moderate risk for potentially substantial rewards.
Keep in the Watchlist.
NO RECO. For Buy/Sell.
📌Thank you for exploring my idea! I hope you found it valuable.
🙏FOLLOW for more
👍BOOST if you found it useful.
✍️COMMENT below with your views.
Meanwhile, check out my other stock ideas on the right side until this trade is activated. I would love your feedback.
Disclaimer: "I am not a SEBI REGISTERED RESEARCH ANALYST AND INVESTMENT ADVISER."
This analysis is intended solely for informational and educational purposes and should not be interpreted as financial advice. It is advisable to consult a qualified financial advisor or conduct thorough research before making investment decisions.
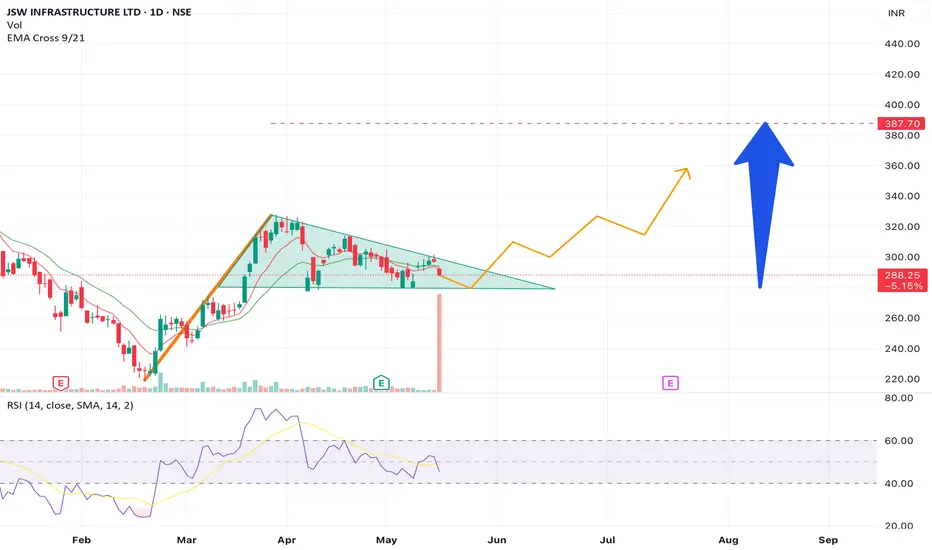
JSW Infrastructure got a huge volume transaction. Long probableA super huge volume transaction has happened in JSW infra. It has formed flag and pole pattern in recent times breakout from the pattern has a probable upside with significant return.
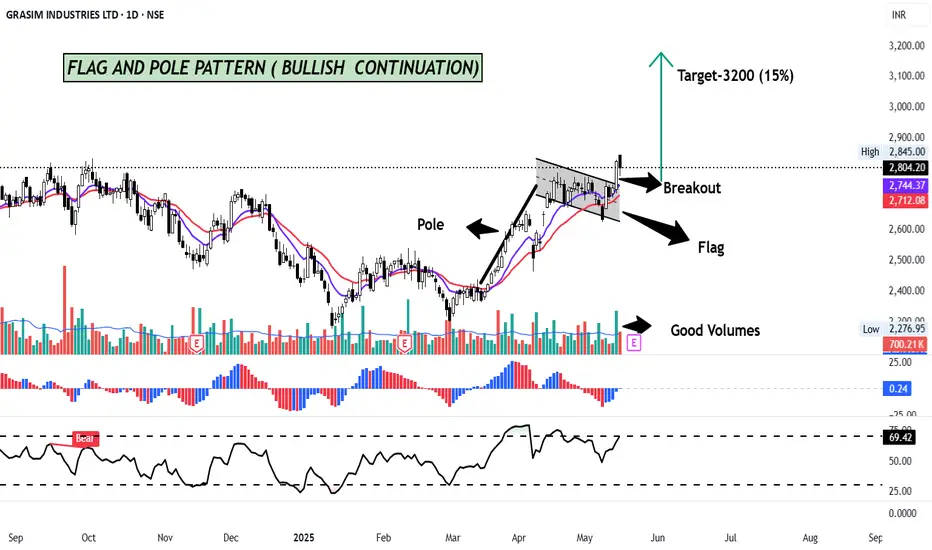
GRASIM- FLAG AND POLE PATTERN BREAKOUT ( BULLISH)GRASIM has formed a FLAG AND POLE pattern on the Daily charts and has given a breakout with good volume.
The "flag and pole pattern" in technical analysis is a chart pattern that signals a potential continuation of an existing trend. It's characterized by a sharp, initial price movement (the "pole") followed by a period of consolidation (the "flag") within a defined range. A breakout from this range, in the same direction as the initial pole, suggests a likely continuation of the original trend
The target of this pattern signals an upside potential of 15% from the current price level in medium term.
Stock is trading above its 11 & 22 day EMA. RSI is at 69, signalling positive momentum.
CMP- Rs. 2804
Target Price- Rs 3200 ( 15% upside)
SL - 2704
Disclaimer: This is not a buy/sell recommendation. For educational purpose only. Kindly consult your financial advisor before entering a trade.
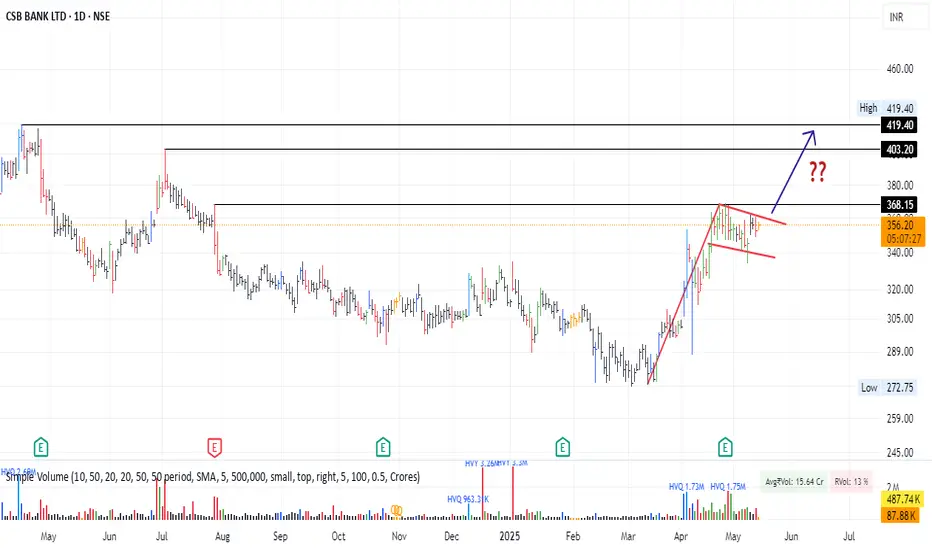
Is CSB Bank ready fo 420 and above levels ?? Looks like a good Flag Structure in making.. Stock moved a nice 20+% on decent volumes. now consolidating..
Alembic Ltd – Inverted Flag Pattern Forming | Breakout Trade SetAlembic Ltd appears to be forming a classic inverted flag pattern on the daily chart:
Bearish Flagpole: A strong and sharp downward move from ~₹148 to ₹88 established the flagpole.
Bullish Flag (Retracement Channel): Since March, the price has been moving in a parallel rising channel — a typical retracement phase.
The price is currently near the lower trendline of the flag, suggesting a potential entry point for a breakout trade.
Support zone : Around ₹100–₹101 near the lower channel boundary.
Target: ₹113–₹115 (upper boundary of the flag channel).
Stop-Loss: Below the lower trendline of the flag (~₹96), or tighter based on risk preference.
Bias:
Neutral to slightly bullish in the short term as long as price stays within the flag.
Watch for a volume-supported breakout above recent swing highs (~₹105) to confirm momentum toward the target.

DIVISLAB Flag and Pole FormationTrade Setup
Entry Level: ₹6,336 🚀
Stop Loss (SL): ₹5,323 (Closing Basis)
SL Percentage: -16.01% 📉
Target Levels:
T1 (Positional Target): ₹7,404 (+16.88%) 🎯
Risk-to-Reward (R:R): 1:1⚖️
Technical Highlights
📌 Flag & Pole: The stock shows a strong flag and pole pattern, indicating bullish potential.
📌 Key DMAs: Trading comfortably above key moving averages (DMAs), adding strength to the setup.
📌 Pullback Bounce: Well-supported bounce after pullbacks.
📌 Volume: Needs improvement for stronger confirmation.
📌 RSI: Decent, supportive of the setup.
Key Strategy
⚡ Wait for Volume Confirmation: Entry should be accompanied by increasing volumes to ensure breakout sustainability.
⚡ Tight Monitoring: Since the R:R is moderate, ensure disciplined adherence to the SL.
⚡ Partial Booking at ₹7,000: Optional for risk reduction before T1.
Risks:
1️⃣ Volume Concern: Weak volume might fail to sustain breakout.
2️⃣ Broader Market Trends: Adverse market movements may impact performance despite strong technicals.
💬 Execute cautiously, and ensure disciplined trading!
⚠ Disclaimer: This is for educational purposes and not financial advice. Please consult your advisor before trading.

FLAG PATTERN BREAKOUTEID Parry has given flag pattern breakout. The breakout candle is supported by rising volume indicating a strong momentum for short term and mid momentum also long term momentum is good. the R:R we can achieve in the trade is 1:4.

flag and pole breakout Vidhi speciality food and ingredients has given a good breakout of flag pattern and has retested its breakout line and is ready to move upwards. This stock has good momentum and trade can help us achieve returns with the R:R ratio of 1:4.

will flag wave high???Ashapura minechem successfully gave breakout of flag and pole pattern and has retested and bounced back from the breakout level. Buyers in the stock seems interested and is technically expected to reach price lvl of 781 with the risk reward ratio of 1:5.
