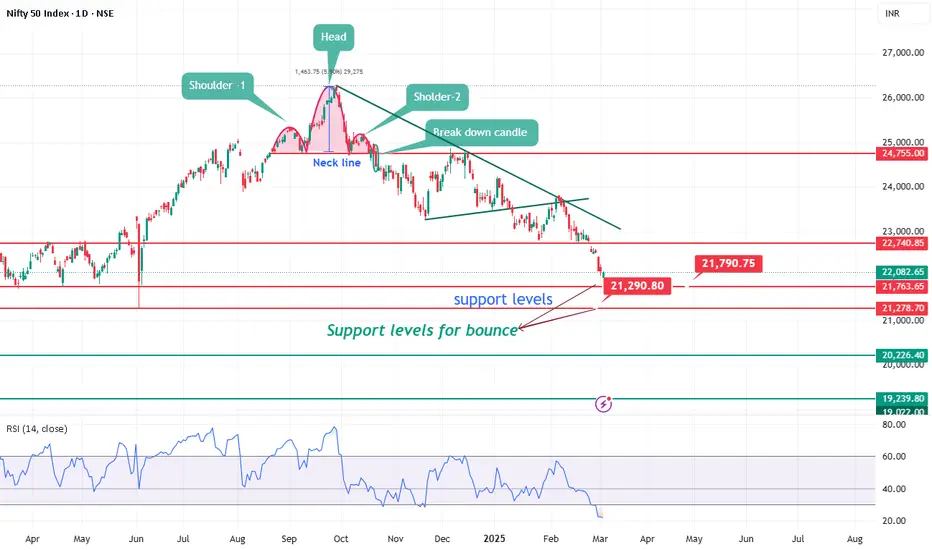
Nifty support levels for bounce.Nifty has been corrected 17% from top. As per chart index is in oversold condition on daily chart. There is still space for downside lower levels for support would be 21800 and 21222.
Flagnpole
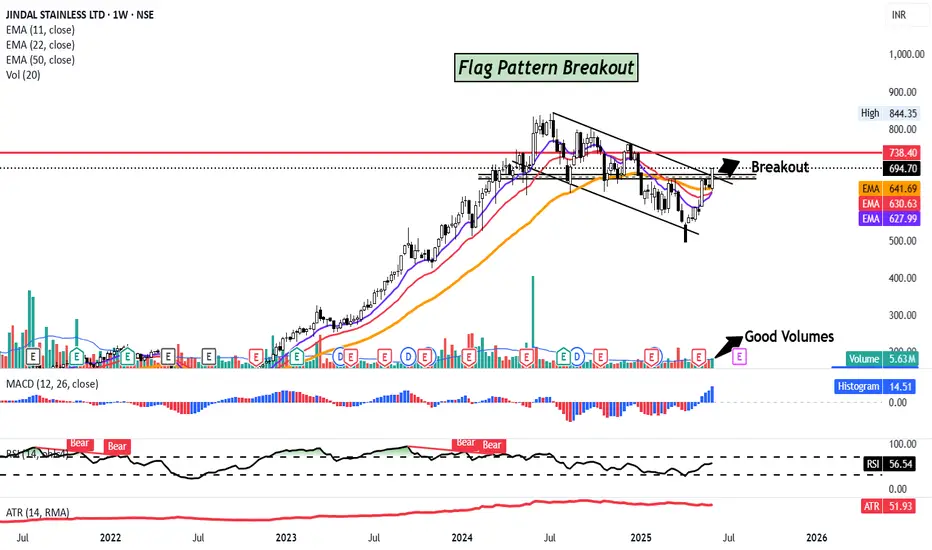
Flag N Pole Pattern BreakoutJindal Stainless has given a Flag and Pole Breakout with good volumes. The pattern is visible on the weekly chart and one may also call it a breakout from the falling channel .Either ways the stock is looking good for an upmove of around 25% in the short term. The stock was in the channel since July'24.
The "flag and pole pattern" in technical analysis is a chart pattern that signals a potential continuation of an existing trend. It's characterized by a sharp, initial price movement (the "pole") followed by a period of consolidation (the "flag") within a defined range. A breakout from this range, in the same direction as the initial pole, suggests a likely continuation of the original trend
Stock is trading above its 11 & 22 day EMA. RSI is at 69, signalling positive momentum.
CMP- Rs. 695
Target Price- Rs 885( 25% upside)
SL - 635
Disclaimer: This is not a buy/sell recommendation. For educational purpose only. Kindly consult your financial advisor before entering a trade.
Shriram piston may test 2800.Shriram piston form Flag n pole pattern. Break out done after consolidation. Indictors are bullish. It may test 2800 soon as per chart

C A N A R A B A N K CANBNK Fut made flag n pole pattern on an hourly charts with decent OI addition suggesting long build up & its about to break out of formation.
Could be bought with mentioned stoploss & target.

DIVISLABDivilab fut broke above flag n pole pattern on an hourly charts with decent long build up sseen on OI.
Risk:Reward = 1:2
Could be bought with mentioned stoploss & target.

C O N C O RCONCOR Fut broke above bullish flag n pole with increase in OI suggesting long build up on an hourly charts.
Risk:Reward 1:4
Not to be missed breakout
Could be bought with menioned stoploss & target

F L A G P A T T E R N B R E A K O U TBajajfinserve broke out of flag n pole pattern on an hourly chart with decent OI.
Could be bought with mentioned stoploss & target

GODREJPROPGODREJPROP broke out of flag pattern with decent volumes on an hourly chart.
Could be bought with mentioned stoploss & target.

INTELLECT DESIGNINTELLECTbroke of flag n pole pattern on an hourly chart with decent volumes.
Could be bought with mentioned stoploss & target.

BANKNIFTYBANKNIFTY broke above flag n pole pattern on an hourly chart with good OI build up.
Could b bought with mentioned stoploss & target.

CUMMINSINDCUMMINS made flag n pole pattern on an hourly chart with good volumes, although its a conditional buy above 1640.
With mentioned stoploss & target.

SRFSRF made flag n pole pattern on hourly charts with decent volumes & broke out of flag pennant pattern.
Could be bought with mentioned stoploss & target.
Not too be missed breakout.

TRENTTRENT broke out of flag n pole pattern on an hourly TF with decent volumes.
Could be bought with mentioned stoploss & target.

cholafinCholafin broke out of flag N pole pattern on 30 min TF with decent volumes.
Could be bought with mentioned stoploss & target.

TRENTTRENT made flag n pole pattern on an hourly charts with good volumes, although, it hadn't broke out of it yet.
Safe traders could wait patienty to break above 1364 then enter with mentioned stop & target.
Aggressive traders can buy here add on dip or add more above breakout with mentioned stoploss & target.

METROPOLISMETROPOLIS broke out of flag pattern with good volumes on 30 min TF.
Could be bought with mentioned stoploss & target.
Risk:Reward is very much in favour of bulls.

PELPEL broke out of flag n pole pattern on hourly charts, safe traders can wait for confirming candle of 15/30 min TF closing above 701 level, aggressive traders can buy here with mentioned stoploss & targets.
Not to be missed breakout as RISK:REWARD is very good.
Could be bought with mentioned stoploss & targets.

SILVERSilver is still in triangular correction on weekly time frame and now it has weekly closed below RK's stop loss line which is a sign for weak sentiments again also weekly macd is about to turn bearish again so we can assume that after completing wave a-b-c-d- now we are unfolding wave e in triangle pattern, which can be last decline before breakout towards north move ahead, so if our assumptions are going to be true then silver can fall towards price of $ 21.40, before it turns bullish for a long term rally to start, On up side we can assume $ 30.72 as 0.618% of wave 3 as a target of wave 5 of bigger degree.
Overall wave structure and chart pattern
Price closed below weekly RK"s stop loss line
weekly macd down tick
Daily macd turned negative again
Daily rsi down tick and closed below 40 range
DMI _ ADX turned negative
TLBD along with near Lbb to challenge
Most investors treat trading as a hobby because they have a full-time job doing something else.
However, If you treat trading like a business, it will pay you like a business.
If you treat like a hobby, hobbies don't pay, they cost you...!
Disclaimer.
I am not sebi registered analyst.
My studies are for educational purpose only.
Please Consult your financial advisor before trading or investing.
I am not responsible for any kinds of your profits and your losses.

Mawana Sugars Short term Long EntryNSE:MAWANASUG We are seeing a Breakout of flag n pole pattern with good volumes. stock is rising after taking a support from 0.61 fib level and has crossed 0.786 lvl with a strong candle. We can see T1 - 168 very soon after that T2 - 203 then , T3 - 226 as per flag n pole target and 1.61 fib extension confluence. keep SL- 127.8

IIFLSEC Short term Swing entryNSE:IIFLSEC This stock gave a Breakout of falling wedge on daily and flag n pole on weekly , rising from 0.5-0.61 fib support zone on weekly timeframe , expect T1- 110 ,T2 - 117 and as per Flag n pole T3 - 180


Birla Soft - Flag & Pole PatternBirla Soft - Flag & Pole Pattern on Weekly Time Frame
Wait for the Breakout
Volumes are decreasing
RSI ~70
CMP: 439.90
Buy Till 400.
SL: 380 (CB)
Once breakout of Flag & pole pattern is confirmed on charts
T1: 480
T2: 520

SUPREME Petrochemical Flag and Pole patternNSE:SUPPETRO Levels are Mentioned in the chart...
Note:
1. Views are personal. Recheck and take the trade as per your RR.
2. Always remember SL is your lifeline not the big target...
3.Follow us for more patterns and like, share so that we feel it is helpful to many and share more patterns...
3. Views given here is not a tip rather it is for educational purpose... After market opens, the condition might change so learn to handle for different conditions..
4. To learn more about patterns, Psychology behind the trade and price action trading... contact us.. Thanks..
