VadilalVadilal Industries looks good on the bullish flag.
Short term breakout inside the channel.
Target will be 5000 in next 3 months.
Good to accumulate for the next 3-6 months.
Flag

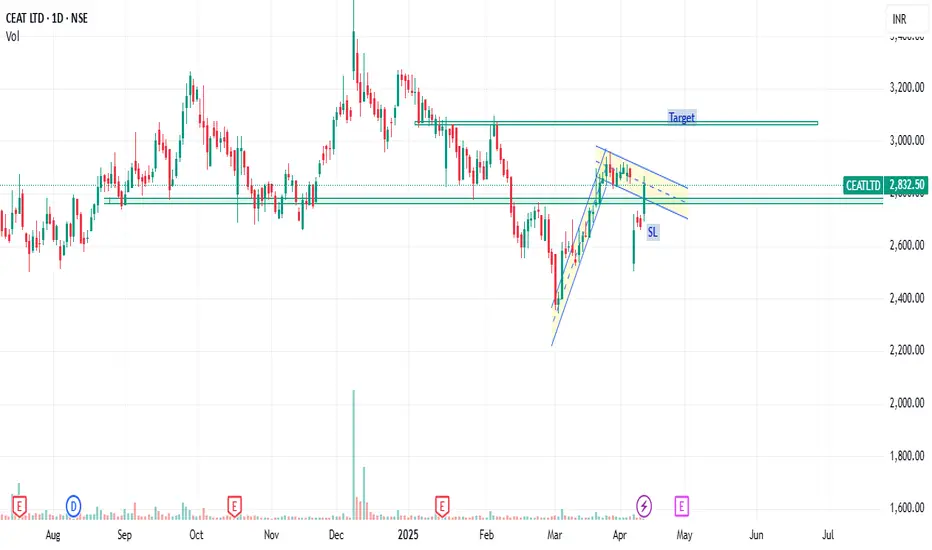
Ceat_Flag patternCreated flag pattern.
Do consider your risk and RR ratio.
Don't just blindly place order.
Always consider your financial concern person.
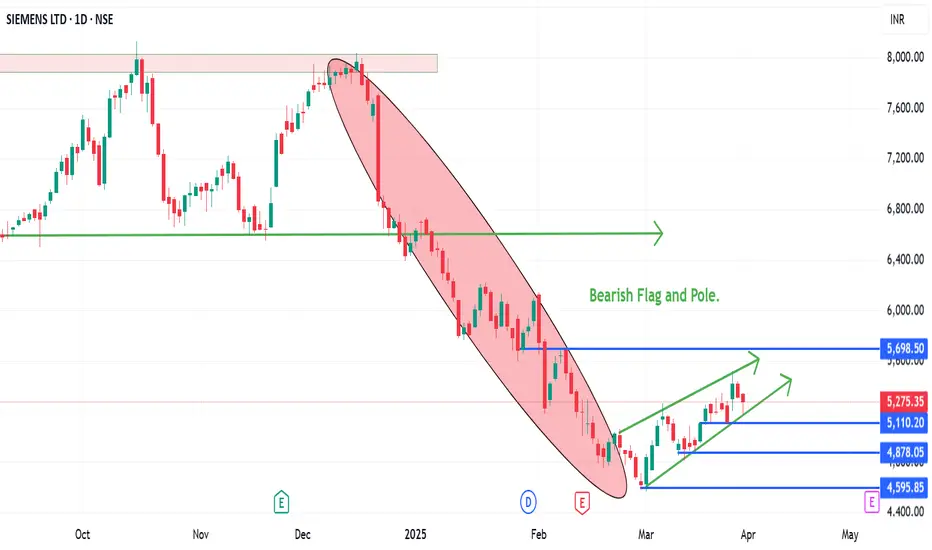
Siemen forming a Flag and Pole pattern on the bearish side.A bearish Flag and pole pattern in Siemens.
The stock has fell from 8000 to 4600 and recovered back to 5300. If there is a break down of the parallel channel, it can retest the recent low of 4600.
It is trading below 100 and 200 EMA on the daily charts. There will be resistance from the levels.
Wait for the break down and let stock price test the recent low.
Enter only once the stock has given a break down, else avoid entering the short trade.
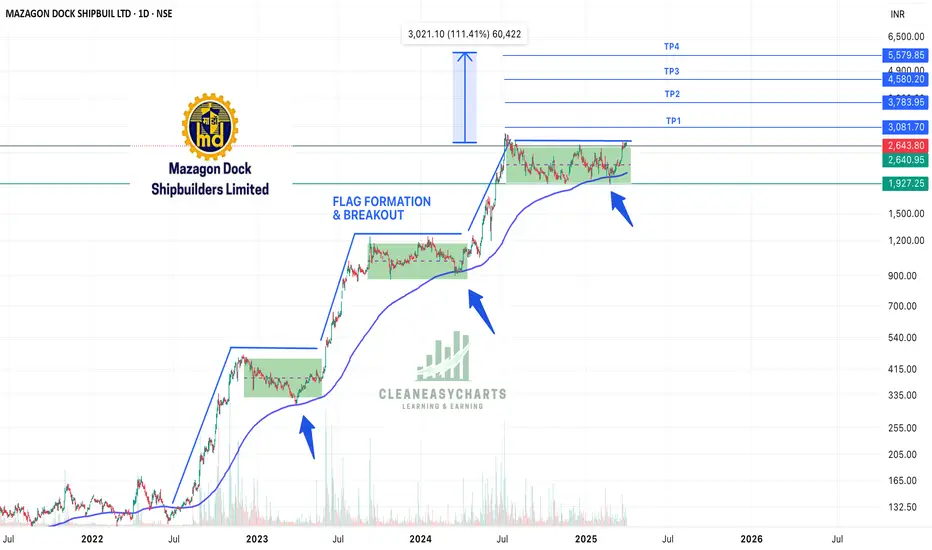
Mazagon Dock - Flag Pattern!!!Mazagon Dock is looking super good both on Fundamental & Technical pattern on account of following:
1. Consistent profitability from 2o years + dividend and no debt
2. Only Shipyard to be conferred Navratna Status
3. Capex planned for next 4-5 years - INR 5000 crores
4. World class infra - Capacity of building 11 Submarines & 10 War Ships concurrently
5. Technically, it is making flag pattern and then giving a breakout. It take support on 200EMA.
6. It is consolidating from last 9 months and a breakout will result in breakout from flag pattern to take price to new heights.
Keep following @Cleaneasycharts as we provide right stocks at right time at right price.
Cheers!!!
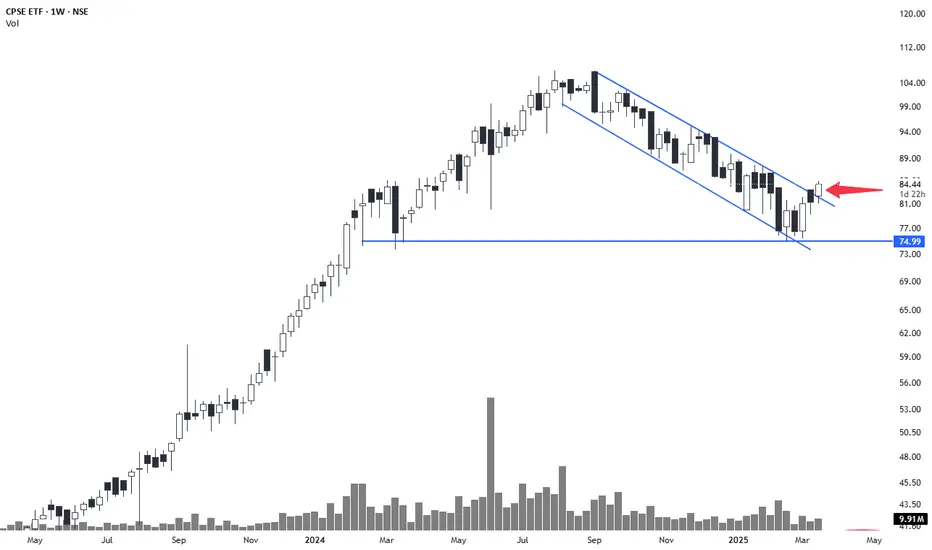
CPSE ETF Weekly BreakoutCPSE ETF breakout is happening from a long descending channel. Took support from previous long term lows 1 year back. Can it sustain the breakout and head towards the previous high is too be seen. It will be a long flag break out if it does.
possible pole n flag breakout in GLOBUS SPRITISStock Overview
Stock Name: Globus Spirits Ltd.
Exchange: NSE (National Stock Exchange of India)
Current Price: ₹881.20
Business Profile: Globus Spirits Ltd. is a leading player in the alcoholic beverages industry, specializing in the production and distribution of Indian Made Foreign Liquor (IMFL), Country Liquor, and Bulk Alcohol. The company operates across multiple segments, catering to diverse consumer preferences.
Key Levels
Support (Yellow Zone): ₹709.65
Swing Zone (Green Zone): ₹1,310.20
Target Levels (T): T1: ₹1,711.15 T2: ₹1,996.50 T3: ₹2,360.05 Final Target: ₹3,409.90
Technical Indicators
Relative Strength Index (RSI):
Current RSI: 49.54, indicating neutral momentum. RSI values above 70 suggest overbought conditions, while below 30 indicate oversold conditions.
Volume:
Current Volume: 964.3K. High volume during price increases confirms strong buying interest, while low volume during declines suggests weak selling pressure.
Moving Average (MA):
The 50-period Simple Moving Average (SMA) is ₹915.57. The stock trading below this level indicates potential bearish sentiment.
Sector and Market Context
Sector Performance: Globus Spirits Ltd. operates in the alcoholic beverages sector, which has shown resilience amid fluctuating market conditions. The sector benefits from steady consumer demand and favorable regulatory policies.
Market Trends: The broader market has been moderately bullish, with indices showing gradual recovery. However, sector-specific factors, such as raw material costs and excise duties, remain critical.
Risk Considerations
Market Risks: Volatility in the broader market due to macroeconomic factors like interest rate changes or geopolitical events.
Sector-Specific Risks: Regulatory changes, fluctuations in raw material prices, and shifts in consumer preferences could impact performance.
Stock-Specific Risks: Potential earnings misses or management changes may influence investor sentiment.
Analysis Summary
Globus Spirits Ltd. presents a mixed technical outlook. While the RSI indicates neutral momentum, volume trends suggest periods of strong investor interest. The stock's performance is closely tied to sector trends and broader market conditions. Investors should monitor key levels and remain cautious of potential risks. This analysis is for informational purposes only and does not constitute financial advice.

Bajaj Finance: Defying Market Correction with Potential BreakoutTopic Statement:
Bajaj Finance has remained strong despite the broader market correction, and a breakout above its key resistance level could trigger a new rally.
Key points:
1. The stock continues to move upward despite the market correction.
2. The price is approaching a critical resistance level at 8,200.
3. A breakout from this triple-top resistance could lead to further upside momentum.

SRF: Resilient Amid Market Correction & Faces Strong ResistanceTopic Statement:
SRF has held up well compared to the broad market correction, but it now faces a crucial resistance level that will determine its next move.
Key points:
1. The stock is moving in a sideways zone with clear accumulation and distribution levels.
2. The price is attempting a breakout from the distribution zone but faces stiff resistance at the level of 3,000.
3. Weekly RSI is at 68, indicating overbought conditions.
4. The company has a high PE of 73.9, suggesting the stock is expensive.

NIFTY Predictions (wave pattern and Fibonacci study based)Hello everyone,
Nifty Almost bottom done spot 22550 closing before the elections in india now Nifty PE ratio is 20 which looks attractive undervalued. most probably till september-octber 2025 market going to break previous lifetime high its all for study purpose RSI is oversold

Flag and Pole in Nifty. 22500 or 23500?After last week's Trending Pole, Nifty has been sideways this week trading in a range and creating a retracement flag.
Breakout on either side of the Range could lead to a trending move towards the Upper Limit of the Parallel Channel (Green) 23500 or The Midline of the Parallel Channel (Yellow) 22500.
RSI is divergent
Any dip towards 22500 could witness a decent buying.
Trade outside the Flag only.

CarTrade Tech- CnH FnP. Keep on Radar📊 CarTrade Tech - Technical Analysis 🚗
Reason for Picking This Stock:
CarTrade Tech has been in an uptrend since March 2023, trading within a rising channel. The stock tends to take support near the 50 DMA and the channel bottom, showcasing strong demand in those areas.
✨ Key Highlights:
1️⃣ Breakout from 3.5-Year Resistance: The stock has broken above a significant 3.5-year-old resistance level of ₹1,622.85 and gave a weekly closing above it.
2️⃣ Chart Patterns:
Cup and Handle (CnH) formation near the 3.5-year resistance.
Flag and Pole (FnP) pattern adds conviction to the breakout.
3️⃣ No Overhead Resistance: The left side of the chart shows no major resistance, providing room for upside movement.
4️⃣ Relative Strength in Market Correction: The stock has held strong during the broader market correction.
🎯 Trading Levels & Risk-Reward (R:R):
Entry: ₹1,835
Stop Loss (Closing Basis): ₹1,514
Positional Target: ₹2,543
SL %: 17.5%
R:R: 1:2
📌 How to Trade:
✅ Wait for Confirmation: A clear breakout with volume and a wide-range candle will strengthen the setup.
✅ Small Position Size: As the market trend is bearish, trade with reduced risk.
✅ Pullback Entry: Look for a pullback to the 50 DMA region or channel bottom for better risk-reward entries.
✅ Add on Base Formation: If the stock consolidates above the breakout level and breaks out again, consider this as a further entry point.
⚠️ Risk Considerations:
🚨 The broader market is trading well below the 50 DMA and 200 DMA, with a death cross in play. Committing large capital at this point may not be advisable.
🚨 This is a pure technical call on a fundamentally weak company. Perform your own due diligence before trading.
💡 Key Points to Watch:
1️⃣ Clear breakout from the Flag and Pole (FnP) and Cup and Handle (CnH) patterns.
2️⃣ The channel top may act as a resistance, so monitor price action near those levels.
3️⃣ Broader market stabilization above the 200 DMA and 50 DMA is crucial for larger capital deployment.
🚦 Final Thoughts:
CarTrade Tech is showing relative strength in a falling market—a key factor for stock selection during corrections. The intention is to highlight opportunities in stocks performing well despite broader market weakness. Trade cautiously and stick to strict risk management. 💪 and do not wait for target to be achieved in this market condition. Try to book partial and trail SL.
📉 Disclaimer: This analysis is for educational purposes only and not financial advice. Always consult your financial advisor before making any trading decisions.

DIVISLAB Flag and Pole FormationTrade Setup
Entry Level: ₹6,336 🚀
Stop Loss (SL): ₹5,323 (Closing Basis)
SL Percentage: -16.01% 📉
Target Levels:
T1 (Positional Target): ₹7,404 (+16.88%) 🎯
Risk-to-Reward (R:R): 1:1⚖️
Technical Highlights
📌 Flag & Pole: The stock shows a strong flag and pole pattern, indicating bullish potential.
📌 Key DMAs: Trading comfortably above key moving averages (DMAs), adding strength to the setup.
📌 Pullback Bounce: Well-supported bounce after pullbacks.
📌 Volume: Needs improvement for stronger confirmation.
📌 RSI: Decent, supportive of the setup.
Key Strategy
⚡ Wait for Volume Confirmation: Entry should be accompanied by increasing volumes to ensure breakout sustainability.
⚡ Tight Monitoring: Since the R:R is moderate, ensure disciplined adherence to the SL.
⚡ Partial Booking at ₹7,000: Optional for risk reduction before T1.
Risks:
1️⃣ Volume Concern: Weak volume might fail to sustain breakout.
2️⃣ Broader Market Trends: Adverse market movements may impact performance despite strong technicals.
💬 Execute cautiously, and ensure disciplined trading!
⚠ Disclaimer: This is for educational purposes and not financial advice. Please consult your advisor before trading.

SkyGold - Glittering in the Sky- Flag Pole Breakout - Abv 370About Co.
1. Established in 2008 and headquartered in Mumbai, Sky Gold Limited specializes in 22-carat lightweight gold jewelry.
2. Product Range includes plain gold jewelry, studded pieces, and Turkish designs.
3. B2B Model, supplying to major retailers like Malabar Gold, Joyalukkas, Kalyan Jewellers, and more.
4. Over 2,000 retail showrooms across India feature Sky Gold products.
5. State-of-the-art manufacturing facility in Navi Mumbai with an 81,000 sq. ft. space and a 750 kg/month processing capacity.
6. Design library of 500,000+ designs, including rings, bangles, pendants, and earrings.
7. Migrated to NSE and BSE main boards in January 2023.
8. Q2 2024 net profit surged fivefold to ₹36.7 crore, with revenue up 94.2% to ₹768.8 crore.
9. Recent acquisitions of Sparkling Chains & Starmangalsutra boosted market share from 35% to 70%.
10. ₹270 crore fundraise strengthened working capital and expanded market reach.
#Results
SKYGOLD Q3 NET PROFIT AT 36.6 CR V 8.9 CR YOY
REVENUE AT 997 CR V 460 CR
SKYGOLD Q3 EBITDA AT 57 CR V 18.5 CR YOY
MARGINS AT 5.72 % V 4 %
#Analysis
The stock has formed Flag & Pole Breakout & with Excellent results and tailwind in Gold/Jewellery sector, one may ride the stock above 370 for targets of 460+ with SL of 322.

Varun Beverages Limited - Looks promising for far!VBL - Formation of FVGs suggest a potential Flag pattern however it appears to be on the verge of formation and yet to be confirmed!
Key levels to watch:
Around 650 range close to the trendline.
Around 680 levels
Pattern confirmation:
Open and Close above 680 range in daily time frame with good volume.
Potential rally:
Monitor stock movement around the upcoming quarterly earning results. If it breaks the mentioned levels, further flag may pattern may continue the rally around 850+.
Currently at probable early spot!
#Budget 2025
#FMCG
#Aboard

BULL FLAG FORMATION IN ADANI GREEN ENERGY - SWING TRADESymbol - ADANIGREEN
CMP 988
Adani Green Energy Limited, incorporated in 2015, is a holding company of several subsidiaries carrying business of renewable power generation within the group and is primarily involved in renewable power generation and other ancillary activities.
In Adani Green Energy, a bullish flag formation has developed. A breakout from this formation is expected to drive the price towards 1240, representing an approximate upside of 26% from the current level. I am initiating a long position in the Futures at the current market price 988
Additionally, I plan to increase my position near the 970-965 price range and will maintain the long position with a stop loss at 938
Disclaimer - Do not consider this as a buy/sell recommendation. I'm sharing my analysis & my trading position. You can track it for educational purposes. Thanks!

BEL CMP 307 - Weekly - Formed Flag patternBEL (Bharat Electronics) CMP 307 - Weekly - Formed Flag pattern
Resistance around 309, 322
Target-1 : 340
Target-2 : 386

Bearish Flag Pattern Breakdown in NiftyA Bearish Flag Pattern has been observed in NSE:NIFTY , signalling a potential downward movement. If this breakdown is successful, the following targets can be expected:
First Target: 22,550
Second Target: 22,000
Disclaimer:
This analysis is for educational and informational purposes only. It does not constitute financial advice. Market movements are subject to various factors, and trading involves significant risk. Always conduct your own research or consult with a professional financial advisor before making any investment decisions. NSE:NIFTY

GOLD Triangle BreakoutGold has given a breakout from Triangle Pattern on 1D timeframe. It had been consolidating since November 2024.

pole & flag in MAZGAON DOCKMAZGAON DOCK weekly chart, possible pole&flag pattern in formation.
Mazagon Dock Shipbuilders Ltd., incorporated in the year 1934, is a Small Cap company (having a market cap of Rs 90,685.87 Crore) operating in Defence sector.
Mazagon Dock Shipbuilders Ltd. key Products/Revenue Segments include Contract Revenue, Sale of Products, Other Operating Revenue, Ship Repairs and Scrap for the year ending 31-Mar-2024.

Banknifty Bullish Harmonic Pattern Moving AVG Support__RSIHello everyone,
banknifty fall consecutive 6 days trading at 8 months low 48700 RSI Positive divergence,
Bullish harmonic pattern and flag in making while nifty W in making So reversal possibilities also Maving avg band support overal confluence support with ocsillators bullish.
bullish reversal banknifty,
Banknifty Bullush Harmonic,
banknifty bullush flag,
Banknnifty RSI oversold and positive divergence,

EXELFlag formation on monthly chart
use retracement to enter fresh with a perspective of 2-3yrs. consider 19 as your stop loss

will flag wave high???Ashapura minechem successfully gave breakout of flag and pole pattern and has retested and bounced back from the breakout level. Buyers in the stock seems interested and is technically expected to reach price lvl of 781 with the risk reward ratio of 1:5.

UNITED BREWERIESUBL is looking good an outperformer in a sector all the time frame is in momentum and making a very good chart pattern that is flag and the retracement is also at 23% is a good signal for buying an all other indicatros is also showing it to go up side momentum so above 2144 it is a buy candidate target is 2266
