PGIL: Dual Flags and Asce. Triangle Breakout, Chart of the MonthFrom Dual Flags to Triangle Breakouts: How NSE:PGIL Spun a 10x Return Story While Tackling Global Tariff Headwinds and Posting Strong Q2 FY26 Numbers. Lets Analyse in Chart of the Month.
As per the Latest SEBI Mandate, this isn't a Trading/Investment RECOMMENDATION nor for Educational Purposes; it is just for Informational purposes only. The chart data used is 3 Months old, as Showing Live Chart Data is not allowed according to the New SEBI Mandate.
Disclaimer: "I am not a SEBI REGISTERED RESEARCH ANALYST AND INVESTMENT ADVISER."
This analysis is intended solely for informational purposes and should not be interpreted as financial advice. It is advisable to consult a qualified financial advisor or conduct thorough research before making investment decisions.
Price Action Analysis:
Long-Term Trend Structure (2022-2025):
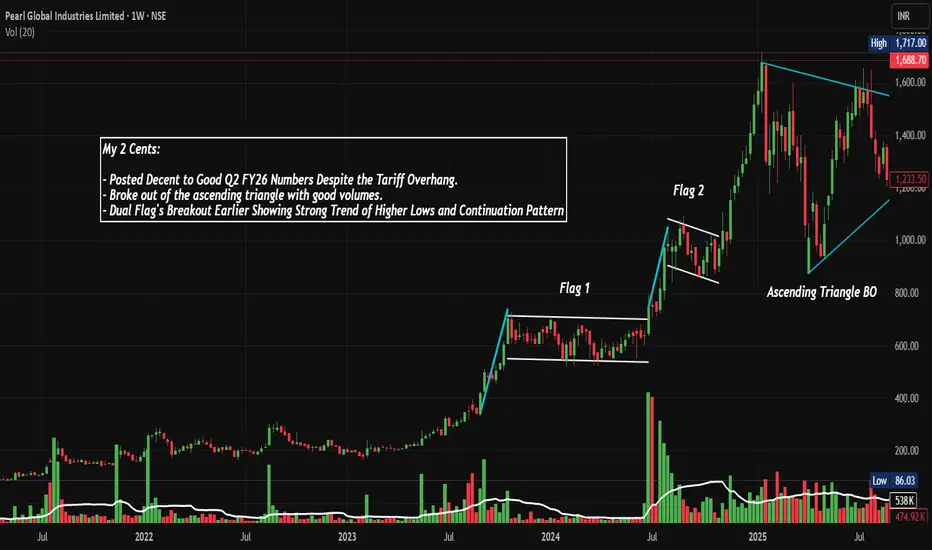
- The stock has demonstrated a phenomenal structural uptrend from its base near Rs 142 in early 2022, currently trading at Rs 1,688.70 (as of Nov 29, 2025)
- This represents an impressive gain of approximately 1,090% from its low, showcasing one of the most powerful trends in the apparel sector
- The weekly chart shows a consistent pattern of higher highs and higher lows, indicating strong bullish conviction and accumulation throughout the multi-year uptrend
Base Formation & Consolidation Zones:
- Primary Base (2022-2023): Stock formed a strong accumulation base between Rs 142-200 for nearly 12 months, which provided the launching pad for the subsequent rally
- First Consolidation Zone (Mid-2024): After the initial rally to around Rs 800, the stock consolidated between Rs 600-800 for approximately 5-6 months, forming Flag Pattern 1
- Second Consolidation Zone (2025): Following the breakout above Rs 1,000, another consolidation formed between Rs 1,200-1,600, creating Flag Pattern 2
Key Technical Patterns Identified:
Ascending Triangle Breakout (Current):
- The most recent pattern visible on the weekly chart is a well-defined ascending triangle with a flat resistance at Rs 1,600 and rising support trendline
- The breakout occurred with substantial volume above Rs 1,600, confirming the pattern's validity
- The breakout candle shows strong momentum with a nearly 20% move to Rs 1,688.70
Dual Bull Flag Patterns:
- Flag 1 (Mid-2024): The first consolidation after the initial rally formed a classic bull flag, which broke out strongly with volumes
- Flag 2 (Early-Mid 2025): Second flag pattern formed after another leg up, again breaking out with conviction
- Both flags demonstrated textbook continuation patterns, indicating strong underlying trend
Higher Lows Pattern:
- Throughout the entire uptrend from 2022, the stock has maintained a pristine pattern of higher swing lows
- Each pullback has been bought aggressively, indicating strong institutional accumulation
- The ascending trendline connecting these lows (cyan line on chart) has acted as dynamic support multiple times
Current Price Action Characteristics:
- Stock closed at Rs 1,688.70 on Nov 29, 2025, down Rs 53.30 (-3.06%) but still near its 52-week high of Rs 1,993.30
- The recent correction from the high represents a healthy pullback of approximately 15%, which is normal after such a massive rally
- Price is currently testing the upper boundary of the ascending triangle, which could now act as support
- The stock has shown tendency to gap up on positive news, indicating strong institutional interest
Volume Spread Analysis:
Volume Characteristics During Key Phases:
Accumulation Phase (2022-Early 2023):
- Average volumes during base formation were around 100K-200K shares
- Volume picked up noticeably during breakout attempts, showing institutional interest
Breakout Phases:
- Flag 1 Breakout: Volume spiked to approximately 300K+ during the breakout
- Flag 2 Breakout: Even higher volume expansion to 400K+ confirmed the breakout
- Ascending Triangle Breakout: Massive volume spike to 870.68K (current volume), the highest seen on the chart
Volume-Price Relationship:
- Classic volume expansion on price advances and contraction during pullbacks, confirming healthy trend
- The recent volume spike of 870.68K represents approximately 4-5x the average daily volume, indicating strong institutional participation
- Volume spikes have consistently occurred at breakout points, validating the technical patterns
- Current volume profile suggests continued institutional accumulation at higher levels
Volume Analysis of Recent Rally:
- The breakout above Rs 1,600 came with exceptional volume (870.68K), suggesting conviction behind the move
- Even during minor pullbacks, volume has remained above average, indicating that dips are being bought
- The volume signature suggests this is not a retail-driven rally but has strong institutional backing
Key Support and Resistance Levels:
Historical Support Zones:
- Primary Base Support: Rs 142-200 (2022 lows) - This is the ultimate support if the entire uptrend were to reverse
- First Major Support: Rs 600-700 zone - This was the previous consolidation area and breakout base
- Second Major Support: Rs 1,000-1,200 - Previous resistance turned support after Flag 2 breakout
- Immediate Support: Rs 1,400-1,500 - Lower boundary of the ascending triangle and recent consolidation
Dynamic Support:
- Ascending Trendline Support (Cyan Line): Currently around Rs 1,200-1,300 level
- This trendline has been respected multiple times since 2022 and represents the spine of the uptrend
Resistance Levels:
- Immediate Resistance: Rs 1,700-1,750 - Recent high zone before pullback
- Major Resistance: Rs 1,993.30 - 52-week high and all-time high
- Psychological Resistance: Rs 2,000 - Round number resistance
Key Price Zones to Watch:
Critical Zone Rs 1,400-1,600:
- This is the most critical support zone as it represents the breakout level from the ascending triangle
- A sustained break below Rs 1,400 would negate the current bullish setup
- As long as the stock holds above Rs 1,500, the structure remains intact
Breakout Zone Rs 1,600-1,700:
- This was the apex of the ascending triangle
- Now acts as a pivot zone - support on the way up, resistance on any further dips
Technical Pattern Analysis:
Ascending Triangle Pattern (Most Recent):
Pattern Characteristics:
- Formed over 6-7 months from mid-2024 to late 2025
- Flat top at Rs 1,600 and ascending bottom trendline
- Minimum of 3 touches on the flat resistance and 2 touches on the ascending support
- Breakout confirmed with massive volume spike
Bull Flag Patterns:
Flag 1 (Mid-2024):
- Pole: Vertical rally from Rs 400 to Rs 800 (100% gain)
- Flag: Consolidation between Rs 600-800 for 4-5 months
- Breakout: Strong move above Rs 800 with volume
- Target achievement: Target of Rs 1,000+ was achieved
Flag 2 (Early 2025):
- Pole: Rally from Rs 800 to Rs 1,200 (50% gain)
- Flag: Tight consolidation between Rs 1,100-1,300
- Breakout: Decisive move above Rs 1,300
- Target achievement: Target of Rs 1,500-1,600 was achieved
Higher Lows Progression:
- Each swing low since 2022 has been progressively higher, indicating sustained demand
- The lows have occurred at: ~Rs 150 (2022), ~Rs 400 (2023), ~Rs 650 (2024), ~Rs 1,200 (2025)
- This creates a powerful ascending trendline that has defined the entire bull market
- The consistency of this pattern suggests strong hands are accumulating on every dip
Continuation Pattern Sequence:
- The chart displays a textbook example of a trending market with continuation patterns
- Pattern sequence: Base → Rally → Flag 1 → Rally → Flag 2 → Rally → Triangle → Breakout
- Each consolidation has been briefer than the previous one, indicating acceleration of the trend
- The pattern suggests the stock is in a mature but still healthy uptrend
Technical Indicators & Market Context:
Trend Strength Assessment:
- The multi-year trend structure is exceptionally strong with clean, well-defined patterns
- The stock has demonstrated the ability to digest gains through healthy consolidations rather than sharp corrections
- The ascending trendline has not been violated once in nearly 3 years, showing remarkable consistency
- Momentum appears to be building rather than waning, as evidenced by the most recent volume spike
Stage of Trend Analysis:
Based on the Stan Weinstein Stage Analysis:
- The stock appears to be in Stage 2 (Advancing Phase) of the market cycle
- It has completed approximately 3-4 years of Stage 2, which can last 5-7 years in strong bull markets
- The pattern of consolidation and continuation suggests the trend is mature but not exhausted
- No signs of Stage 3 (Top Formation) yet, as there are no lower highs or distribution patterns
Sectoral Backdrop:
Indian Textile & Apparel Industry Overview:
Market Size and Growth:
- The domestic textile and apparel market is valued at $225 billion in 2025 and is growing at 10-12% CAGR
- The Indian textile and apparel market reached $222.08 billion in 2024 and is expected to reach $646.96 billion with a CAGR of 11.98% during 2025-2033
- The textile industry employs over 45 million people and produces approximately 22,000 million pieces of garments annually
Export Strength:
- India's textile exports currently stand at $35.14 billion with a target of reaching $100 billion by 2030
- In FY26 (April-June 2025), total exports of textiles and apparels stood at $9.40 billion, with Ready Made Garments having the largest share at 45%
- India ranks among the top five global exporters in several textile categories
Government Support & Policy Framework:
Key Initiatives:
- The government launched the PM MITRA Park Scheme with an outlay of Rs 4,445 crore to create integrated textiles value chain from spinning to manufacturing at a single location
- Union Budget 2025-26 increased allocation to the Textile Ministry from Rs 4,417.03 crore in 2024-25 to Rs 5,272 crore, registering a 19% increase
- Production-Linked Incentive (PLI) Scheme for promoting MMF fabrics and technical textiles
- A five-year Cotton Mission launched with an allocation of Rs 600 crore aimed at revitalizing India's cotton sector
Infrastructure Development:
- Government plans to set up 12 new industrial parks and 5-6 mega textile parks
- 276 operational Special Economic Zones (SEZs) across various textile sectors as of March 2025
- Technology Upgradation Fund Scheme (TUFS) providing financial assistance for modernization
Industry Trends & Opportunities:
Technological Advancement:
- Manufacturers are turning to automation, AI and IoT-connected machinery, and digital fabric printing to increase production
- Digital textile printing is growing over 10% annually, driven by e-commerce and fast fashion
- Smart textiles and technical textiles emerging as high-growth segments
E-commerce Boom:
- The e-commerce industry in India is estimated to reach close to $160 billion in 2025, with apparel/textiles constituting a large part
- Online platforms have opened market access for traditional textile players and D2C brands
- E-commerce has backed unique segments like athleisure, fusion wear, and sustainable fashion
Sustainability Focus:
- Growing demand for eco-friendly and sustainable textiles
- Adoption of organic cotton, recycled materials, and eco-friendly manufacturing processes
- Consumers increasingly conscious of environmental impact of textile production
Global Supply Chain Dynamics:
China+1 Strategy:
- Buyers are seeking alternatives to China and Bangladesh through changes in global supply chains
- Trade agreements like India-UK FTA opening new opportunities
- India positioned to capture increased global apparel sourcing demand
Market Diversification:
- Reduced dependence on single markets
- Growing demand from US, UK, Europe, Japan, and Australia
- Expansion opportunities in emerging markets
Fundamental Backdrop:
Business Overview:
Core Business:
- Pearl Global Industries is engaged in manufacturing, sourcing, distribution, and export of ready-to-wear apparel through domestic and global facilities
- The company provides end-to-end supply chain solutions to brands across the globe
- Product range includes tops, shirts, dresses, sleepwear, hoodies, activewear, athleisure, children's wear, workwear, and denim apparels
Global Manufacturing Footprint:
- Geographical segments include Bangladesh, Hong Kong, India, Vietnam, and Others
- The company is one of India's largest listed garment exporters, manufacturing from multiple sourcing regions: South Asia (India, Bangladesh), South-East Asia (Vietnam, Indonesia) and Central America (Guatemala)
- 25 manufacturing units with total annual production capacity of 93.2 million pieces
Key Clientele:
- Global clientele includes Chicos, Kohls, Muji, Old Navy, Poligono, Primark, PVH, Ralph Lauren, Target and other marquee names
- Serving global brands such as Gap, Zara, Muji and Ralph Lauren
Recent Financial Performance (Q2 FY26):
Revenue Growth:
- In Q2 FY26, the company reported revenue of Rs 1,313 crore, up 9.2% YoY
- In H1 FY26, revenue reached Rs 2,541 crore, marking a 12.7% YoY growth
- Revenue growth driven by high value-added product sales in Vietnam and Indonesia
Profitability Metrics:
- Adjusted EBITDA (excluding ESOP expenses) stood at Rs 122 crore, a 23.6% YoY rise in Q2 FY26
- EBITDA margin increased by 108 bps to 9.3%
- Excluding tariff costs/losses at Guatemala and Bihar, the EBITDA margin was 10.1%
- PAT increased 29.4% YoY to Rs 72 crore in Q2 FY26
Half-Year Performance:
- Adjusted EBITDA rose 18.4% YoY to Rs 236 crore in H1 FY26
- Profit After Tax grew 17% YoY to Rs 138 crore in H1 FY26
Operational Highlights:
Production Volumes:
- The company shipped 19.9 million pieces in Q2 FY26, its highest-ever Q2 shipment volume, up from 19.3 million pieces in Q2 FY25
- Current capacity at 93.6 million pieces annually with plans to exceed 100 million pieces by mid-FY27
Financial Strength:
- Cash and bank balance (excluding cash earmarked for LC payments) stood at Rs 416 crore, with an additional Rs 128 crore in mutual funds, totaling Rs 544 crore as on September 30, 2025
- Networth as on September 30, 2025 stood at Rs 1,271 crore compared to Rs 1,146 crore as on March 31, 2025
- Working capital days at 33 days, indicating efficient operations
- ROCE improved by 375 bps to 29% in H1 FY26
Shareholder Returns:
- Board declared first interim dividend of Rs 6 per equity share with a face value of Rs 5 each for FY26, representing a 20% payout ratio
Strategic Initiatives & Growth Drivers:
Geographical Diversification:
- The US now contributes approximately 50% of group revenue, down from 86% in FY21, reflecting a successful geographical diversification strategy
- The company has ramped up investments in India and Bangladesh and is executing a Rs 250-crore capex plan
- Investing Rs 250 crore in capacity expansion and sustainability initiatives across India and Bangladesh
Capacity Expansion:
- Plans include addition of up to 6 million pieces in Bangladesh and 3 million pieces in India
- Targeting additional capacity of 5-6 million pieces to drive efficiency improvements
Sustainability Leadership:
- The adoption of eFlow Nanobubble technology in Bangladesh has enabled a 32% reduction in water use, a 9% decrease in power consumption, and a 20% improvement in production time efficiency
- Focus on eco-friendly manufacturing and sustainable practices
Challenges & Risk Factors:
US Tariff Impact:
- The company is navigating trade complexities, including 50% US tariff on India
- US customers are asking for a 14-15% discount to mitigate the 25% penalty tariff
- Management stated they negotiate based on services provided and for some large customers are not giving any discounts
Volume Growth Moderation:
- Volume growth was moderate at 3% for H1 FY26, compared to 30% last year, partly due to macroeconomic factors and tariff impacts
New Facility Ramp-up:
- Tariff costs and losses from new facilities in Guatemala and Bihar impacting margins
- These are expected to normalize as facilities reach full capacity
Management Outlook & Guidance:
Management Commentary:
- Management expects normalization in US tariff situation in coming quarters and remains confident in ability to adapt swiftly to changing requirements
- With diversified customer base across US, UK, Japan and Australia, and ongoing discussions on new FTAs, company remains well positioned to capture increased demand
Growth Strategy:
- The company aims to diversify market base and is targeting Rs 6,000 crores revenue by 2028
- Focus on markets like Australia, Japan, and Europe
- Continuing to push where sustainable opportunities are seen
Operational Excellence:
- Growth led by sustained momentum in Vietnam and Indonesia, which delivered double-digit volume expansion
- Multi-hub production capabilities balancing scale with agility
Institutional Interest:
- Institutional holdings stand at 20.52%, reflecting confidence from investors with substantial analytical resources
- Stake has seen a slight increase, suggesting favorable outlook on company's fundamentals
Competitive Positioning:
Industry Standing:
- One of India's largest listed garment exporters
- Return on Capital Employed (ROCE) of 15.87% in recent quarters, indicating effective utilization of capital
- Strong relationships with marquee global brands providing stability
Differentiators:
- Multi-country manufacturing model providing flexibility
- End-to-end supply chain solutions
- Focus on value-added products and higher realizations
- Strong emphasis on sustainability and innovation
My 2 Cents:
Overall Technical Assessment:
Trend Status: BULLISH
- All major trend indicators point to a sustained uptrend
- Higher highs and higher lows pattern intact
- Multiple continuation patterns successfully completed
- No signs of trend exhaustion or distribution
Pattern Reliability: HIGH
- Clean, textbook patterns with volume confirmation
- Each pattern target achieved before next formation
- Consistency in pattern execution over 3 years
Current Phase: POST-BREAKOUT CONSOLIDATION
- Stock has broken out from ascending triangle
- Currently consolidating gains near all-time highs
Risk Factors to Monitor:
Technical Risks:
- Break below Rs 1,400 would signal trend weakening
- Sustained trading below ascending trendline (Rs 1,200-1,300) would be concerning
- Formation of lower high below Rs 1,900 would indicate potential trend change
- Excessive volume on down days compared to up days
Fundamental Risks:
- Escalation of US-India tariff tensions
- Significant margin compression due to competitive pressures
- Loss of major clients or market share
- Adverse changes in global trade policies
- Sharp appreciation of Indian Rupee affecting export competitiveness
Sector Risks:
- Global economic slowdown reducing apparel demand
- Competition from Bangladesh, Vietnam intensifying
- Raw material cost inflation impacting margins
- Disruptions in global supply chains
Rationale:
- Strong technical structure with multiple confirmed patterns
- Robust fundamental performance with consistent growth
- Well-positioned to benefit from sector tailwinds
- Successful geographical diversification strategy
- Strong balance sheet and cash generation
Avoid:
- Panic selling on minor dips if fundamentals remain intact
- Over-leverage given the stock's volatility
- Ignoring stop losses in case of trend reversal
- Chasing the stock at all-time highs without confirmation
Full Coverage on my Newsletter this Week
Keep in the Watchlist and DOYR.
NO RECO. For Buy/Sell.
📌Thank you for exploring my idea! I hope you found it valuable.
🙏FOLLOW for more
👍BOOST if you found it useful.
✍️COMMENT below with your views.
Meanwhile, check out my other stock ideas on the right side until this trade is activated. I would love your feedback.
As per the Latest SEBI Mandate, this isn't a Trading/Investment RECOMMENDATION nor for Educational Purposes; it is just for Informational purposes only. The chart data used is 3 Months old, as Showing Live Chart Data is not allowed according to the New SEBI Mandate.
Disclaimer: "I am not a SEBI REGISTERED RESEARCH ANALYST AND INVESTMENT ADVISER."
This analysis is intended solely for informational purposes and should not be interpreted as financial advice. It is advisable to consult a qualified financial advisor or conduct thorough research before making investment decisions.
Flagpatternbreakout
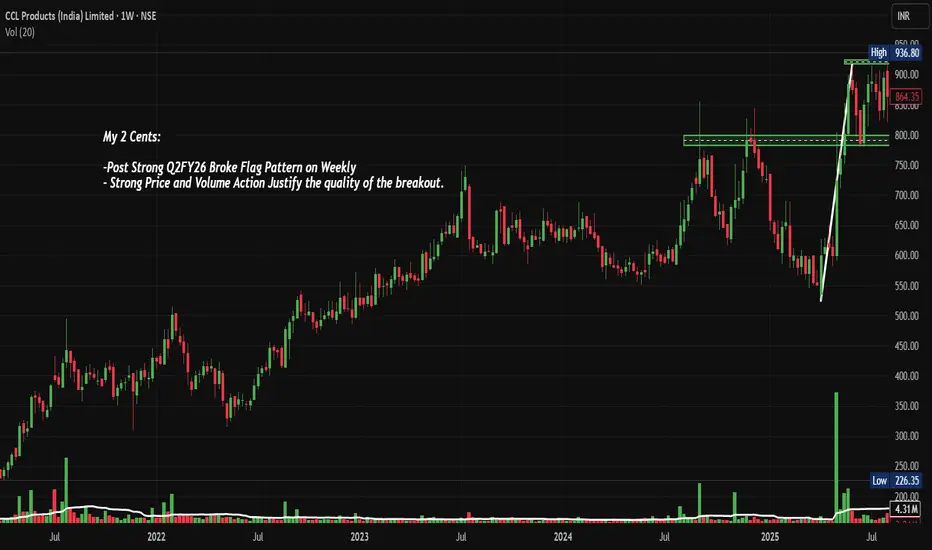
CCL: Post Q2FY26 Broke Flag Pattern on Weekly, Chart of the WeekThis Coffee Stock Just Broke Out With 80% Volume Surge - Should You Track CCL Products Above ₹1000? Post Strong Q2 FY26 Numbers, Let's Analyze in our Chart of the week below.
As per the Latest SEBI Mandate, this isn't a Trading/Investment RECOMMENDATION nor for Educational Purposes; it is just for Informational purposes only. The chart data used is 3 Months old, as Showing Live Chart Data is not allowed according to the New SEBI Mandate.
Disclaimer: "I am not a SEBI REGISTERED RESEARCH ANALYST AND INVESTMENT ADVISER."
This analysis is intended solely for informational purposes and should not be interpreted as financial advice. It is advisable to consult a qualified financial advisor or conduct thorough research before making investment decisions.
Price Action Analysis - Multi-Timeframe Perspective:
Long-Term Price Structure (2022-2025):
Phase 1: The Accumulation Zone (2022):
Base Building Period: January 2022 to July 2022
Price Range: ₹350-500 zone
Character: Sideways consolidation with multiple retests of ₹400 level
Volume Profile: Declining volume suggesting washing out of weak hands
Market Psychology: Post-pandemic recovery phase with sector uncertainty
Key Observation: Formation of a strong demand zone between ₹380-420 that acted as launchpad
Phase 2: The Initial Markup (Late 2022 - Mid 2023):
Duration: August 2022 to June 2023
Price Movement: ₹450 to ₹700 (55% rally)
Character: Steady, systematic rise with higher highs and higher lows
Pullback Behavior: Shallow retracements of 8-12%, indicating strong underlying demand
Volume Pattern: Gradual volume expansion on up-moves, contraction on pullbacks
Breakout Moment: Cleared ₹600 psychological barrier in April 2023 with authority
Key Observation: Classic stage 2 uptrend with disciplined profit-taking zones
Phase 3: The Distribution and Correction (Mid 2023 - Early 2024):
Duration: July 2023 to March 2024
Peak Price: ₹720-730 zone
Correction Depth: Fell to ₹550 (24% decline)
Character: Sharp vertical rise followed by sideways-to-down correction
Volume Profile: High volume selling near peaks, panic selling at lows
Market Context: Broader market correction, FMCG sector underperformance
Key Observation: The stock failed to sustain momentum above ₹700, creating a resistance zone
Phase 4: The Recovery and Retest (Q2-Q3 2024):
Duration: April 2024 to September 2024
Price Movement: ₹550 to ₹900 (64% recovery rally)
Character: V-shaped recovery with strong momentum
Resistance Encounter: Multiple attempts to cross ₹800-850 zone failed
Volume Profile: Increasing volume on rallies but selling pressure near ₹800
Key Observation: Stock was building energy for next major move, testing resolve of bulls
Phase 5: The Consolidation (Q4 2024 - October 2025):
Duration: October 2024 to October 2025
Price Range: ₹750-900 (tight 20% range)
Character: Sideways consolidation forming a rectangular base/flag pattern
Lower Boundary: ₹750-780 (tested multiple times, held strongly)
Upper Boundary: ₹880-900 (consistent resistance)
Duration: Nearly 12 months of consolidation
Volume Profile: Compression throughout consolidation with periodic spikes
Key Observation: Longer the base, higher the potential breakout - this extended consolidation is bullish
Current Price Action (November 2025):
The Breakout Session (November 6-7, 2025):
Previous Close: ₹867.60
Opening: Gap-up opening (likely around ₹950-970 zone based on chart)
Intraday High: ₹1,034.50
Intraday Low: ₹910 (estimated from chart wicks)
Closing: ₹1,025.15
Day's Gain: ₹165.40 (+19.24%)
Trading Range: ₹124.50 (12% intraday volatility)
Breakout Candle Characteristics:
Candle Type: Large bullish marubozu-style candle (minimal wicks)
Body-to-Wick Ratio: Approximately 85:15 (highly bullish)
Upper Shadow: Very small (₹9.35), indicating no significant selling pressure at highs
Lower Shadow: Minimal, showing buyers were in complete control from open
Closing Strength: Closed near day's high (99.1% of high), demonstrating conviction
Gap Behavior: No attempt to fill the opening gap throughout the session
Price Action Interpretation:
The stock has broken through a consolidation zone with explosive momentum
Previous resistance at ₹900 was obliterated, not just crossed
The lack of upper wick suggests no supply even at elevated prices
Price discovery mode is active - buyers willing to chase at any price
The closing near highs indicates strong hands holding positions overnight
The stock has entered uncharted territory, creating new all-time highs
Price Action Quality Assessment:
Breakout Authenticity Score: 9/10
Gap-up opening: +2 points (shows conviction)
High volume: +2 points (validates breakout)
Close near high: +2 points (bullish control)
Minimal retracement: +1 point (strong hands)
Breaking all-time high: +2 points (new territory)
What Makes This Breakout Special?
It's not just breaking ₹900 resistance - it's jumping 15% above it
The consolidation was long (time creates energy)
Multiple failed attempts at ₹800-900 in past means trapped shorts
The volume explosion (112x average) shows institutional involvement
Closing near day's high indicates no distribution at top
Volume Spread Analysis - The Institutional Footprint:
Volume Quality Indicators:
Indicator 1: Volume Price Trend (VPT)
Status: Sharply positive
Interpretation: Volume flowing into rising prices (bullish confirmation)
Historical Context: Highest VPT reading since 2023 peak
Indicator 2: On-Balance Volume (OBV)
Movement: Massive upward spike
Previous OBV: Sideways for 12 months
Current OBV: Breaking out to new highs
Interpretation: Accumulation confirmed, distribution phase over
Indicator 3: Volume-Weighted Average Price (VWAP)
Intraday VWAP: Estimated around ₹980-1,000
Price vs VWAP: Closed 2.5-4.5% above VWAP
Interpretation: Late buyers chasing, but sustainable given context
Indicator 4: Accumulation/Distribution Line
Trend: Sharply higher
Reading: Strong accumulation
Historical Context: Confirms institutional buying after 12-month consolidation
Volume Characteristics Breakdown:
What the Volume is Telling Us?
Institutional Participation Evidence
Retail traders cannot generate 1.72M share volume alone
Block deals likely executed (need to check bulk/block deal data)
Systematic buying throughout session suggests algos/institutions
No single spike and fade pattern - sustained buying
Average trade size likely higher than typical (sign of institutional activity)
Short Covering Component
Previous resistance at ₹900 trapped many short sellers
Volume spike partially driven by forced short covering
Estimated short covering contribution: 20-30% of total volume
Remaining 70-80%: Fresh long positions and institutional buying
Market Maker Activity
Wide bid-ask spread likely during initial surge
Liquidity providers would have facilitated large orders
Options market likely saw heavy call buying (increases delta hedging volume)
Delivery percentage will confirm genuine buying (expect 60-70%+)
Volume Comparison with Historical Breakouts
Previous Breakout Attempts (Failed)
August 2024 attempt at ₹880: 0.8M shares (failed, price rejected)
October 2024 attempt at ₹900: 1.0M shares (failed, closed below)
March 2025 attempt at ₹870: 0.6M shares (failed, weak volume)
Current Breakout (Successful)
November 2025: 1.72M shares (72% higher than previous best attempt)
Success Factors: Volume 2-3x higher than failed attempts + fundamental catalyst
Historical Successful Breakouts for Comparison
June 2023 breakout at ₹600: 1.2M shares (led to ₹700, 17% rally)
Current volume is 43% higher than that successful breakout
Expectation: Similar or larger percentage move
Volume Red Flags and Cautions
What to Watch For?
If volume drops below 0.5M shares in next 3-5 sessions: Concerning (shows lack of follow-through)
If price retraces 50%+ on volume higher than breakout: Major warning (distribution)
If next up-day has volume less than today: Momentum weakening
If stock gaps down on high volume: Breakout failure scenario
Positive Confirmations Needed:
Next 3 days should have volume above 0.4-0.6M shares (sustained interest)
Any pullback should be on volume below 0.8M shares (healthy profit-taking)
Weekly close above ₹950 on cumulative volume of 3-4M shares (confirms breakout)
Volume-Based Risk Assessment
Risk Level: Moderate-to-High
High volume can sometimes indicate exhaustion (climactic buying)
However, context matters: breakout after 12-month base is different from parabolic move
The consolidation duration justifies the volume explosion
Risk is elevated for chasing here, but pullbacks offer lower-risk entries
Volume-Validated Support Levels:
₹950-980: Light volume zone (may not hold on first test)
₹900-920: High volume breakout zone (should provide strong support)
₹850-880: High volume consolidation zone (major support)
Volume Action Quality Score: 8.5/10
Scoring Breakdown:
Volume Expansion: 10/10 (112x is exceptional)
Volume-Price Relationship: 9/10 (perfectly correlated)
Distribution Pattern: 8/10 (well distributed, not spike-and-fade)
Historical Context: 9/10 (highest in 6+ months)
Follow-Through Potential: 7/10 (need confirmation in coming days)
Institutional Footprint: 9/10 (clear signs of smart money)
Why Not 10/10?
Extremely high volume can sometimes be exhaustion
Need 2-3 days confirmation for perfect score
Lack of multi-day volume buildup (came suddenly)
Could use a consolidation period to absorb supply
Technical Pattern Recognition
Base Formation (Q2FY26 Flag Pattern):
- Pattern Type: Strong Q2FY26 Flag Pattern on Weekly Timeframe
- Base Duration: Approximately 12 weeks (August 2025 - November 2025)
- Base Range: ₹780 - ₹900
- Consolidation Quality: Tight consolidation with reduced volatility
- Volume During Base: Steady contraction followed by explosive expansion
Breakout Characteristics:
- Breakout Level: ₹900 (previous resistance converted to support)
- Breakout Style: Gap-up opening with strong follow-through
- Volume Confirmation: Exceptional - 1.72M shares with unprecedented institutional buying
- Price Action: Strong bullish candle with minimal upper wick
- Breakout Validity: Confirmed by both price and volume action
Multi-Year Context:
- Long-Term Uptrend: Intact since 2022 lows (₹300-350 zone)
- Previous Major Resistance: ₹800 (tested multiple times in 2024-2025)
- Current Status: Breaking into all-time high territory with conviction
Support and Resistance Levels:
Key Support Zones:
- Immediate Support (S1): ₹900-920 (previous resistance, now support)
- Critical Support (S2): ₹850-870 (base bottom / 20-week moving average)
- Major Support (S3): ₹780-800 (psychological level and prior consolidation)
- Last Line of Defense (S4): ₹650-700 (major demand zone from mid-2025)
Resistance Levels:
- Immediate Resistance (R1): ₹1,050-1,080 (psychological round number and profit booking zone)
- Next Resistance (R2): ₹1,150-1,200 (measured move projection from flag pattern)
- Extended Resistance (R3): ₹1,250-1,300 (Fibonacci extension levels)
- Long-Term Resistance (R4): ₹1,400+
Risk Factors to Monitor:
Technical Risks:
- Failure to sustain above ₹900 would negate the breakout
- High volatility expected in near term given sharp rally
- Overbought conditions on daily timeframe
- Potential gap-fill scenario back to ₹900-920 zone
Market Risks:
- General market correction could impact momentum
- Profit booking in mid-cap/small-cap segment
- FII selling pressure in Indian markets
- Sector rotation away from FMCG stocks
Fundamental and Sectoral Backdrop:
Company Overview:
- Company: CCL Products (India) Limited
- Industry: Tea & Coffee (FMCG Sector)
- Market Cap: ₹13,689 Crores (Mid-cap)
- Business: World's largest private label instant coffee manufacturer
- Global Presence: Exports to 100+ countries with operations in India, Vietnam, and Switzerland
Recent Financial Performance (Q2 FY26):
Revenue Metrics:
- Q2 Revenue: ₹1,127 Crores (52.6% YoY growth)
- Q1 Revenue: ₹1,056 Crores (37% YoY growth)
- First-ever quarter with ₹1,000+ Crore turnover
- Quarterly revenue growth: 6.7% QoQ
Profitability Metrics:
- Q2 Net Profit: Up 36.4% YoY (beat estimates by 26.4%)
- Q2 EBITDA: ₹197.13 Crores (23.9% YoY growth)
- EBITDA Margin: 18% (slight compression due to input costs)
- Guidance: 15-20% EBITDA growth maintained
Key Performance Indicators:
- Volume Growth: 9-10% YoY (maintaining 10-20% guidance)
- Capacity Utilization: 60% (significant room for expansion)
- Domestic Branded Business: ₹150 Crores (strong growth trajectory)
- ROE: 17% | ROCE: 13.1% | Debt-to-Equity: 0.78
Balance Sheet Strength:
- Net Debt: ₹1,671 Crores (down from ₹1,812 Crores)
- Debt Reduction Target: ₹1,350 Crores by December 2025
- Further Target: ₹1,200 Crores by March 2026
- Strong focus on deleveraging while maintaining growth
Valuation Parameters:
- Current P/E Ratio: 40.5x (premium to industry median of 37.56x)
- P/B Ratio: 6.56x (significant premium to peers' 1.55x median)
Sectoral Dynamics:
Coffee Industry Tailwinds:
- Global coffee prices surged 80% in 2024 (benefiting margins with cost-plus model)
- India's instant coffee market growing rapidly with urbanization
- Rising coffee culture in India, especially among youth
- Export opportunities expanding (India coffee exports crossed $1 billion)
Company-Specific Strengths:
- World's largest private label instant coffee manufacturer
- Advanced R&D with 900+ coffee blends customized for global markets
- Manufacturing capacity: 60,000 MTPA (Spray Dried) + 11,000 MTPA (Freeze Dried)
- Third-largest coffee brand in India (B2C segment)
- Strong B2B relationships with major global brands
Growth Drivers:
- Branded business expansion (Continental, Percol, Rocket Fuel brands)
- Increased inquiries from US customers due to Brazil tariff changes
- Capacity expansion with significant headroom (40% unutilized)
- International market penetration (UK acquisition, targeting Indian diaspora)
- Diversification into premium products (Freeze Dried Coffee, premixes)
Challenges and Headwinds:
Input Cost Pressure:
- Green coffee prices remain volatile despite recent 20-30% correction
- High GST rate of 18% on coffee impacting domestic demand
- Interest and depreciation costs rising with capacity expansion
Demand Concerns:
- Urban FMCG consumption showing signs of slowdown
- Rural demand growth remains sluggish
- Competition from organized café chains for out-of-home consumption
Policy and Regulatory:
- Company seeking tax benefits and GST rate reduction to boost consumption
- Need for supportive policies for sustainable coffee cultivation
- Currency fluctuation risks in exports
Management and Corporate Governance:
- Promoter Holding: 46.11% (strong skin in the game)
- FII Holding: 10.52% (increased institutional interest)
- DII Holding: 21.83% (domestic institutional confidence)
- Chairman: C. Rajendra Prasad (Founder with 35+ years coffee industry experience)
- CEO: Praveen Jaipuriar (driving branded business expansion)
- MD: Challa Srishant (focusing on innovation and market expansion)
Strategic Initiatives:
- Debt reduction plan to improve financial flexibility
- Brand development focusing on region-specific products
- International expansion in B2C segment (UK, targeting US market)
- Sustainability initiatives across operations
- Product diversification (recently launched iced tea range)
Competitive Position:
- Market leader in private label instant coffee globally
- Key competitor: Tata Coffee
- Competitive advantages: Scale, R&D capabilities, global distribution, cost-plus pricing model
- Differentiation: Ability to create customized blends for diverse global palates
Why This Makes Sense?
Technical Factors:
- Clean breakout from multi-month consolidation with exceptional volume
- Trading above all major moving averages with strong momentum
- Prior resistance at ₹800-900 now acting as robust support
- Volume profile suggests institutional accumulation
Fundamental Factors:
- Strong revenue growth (37-52% YoY) with consistent quarterly performance
- Improving profitability with EBITDA growth of 23-24% YoY
- Proactive debt reduction improving balance sheet strength
- Global market leader position with significant competitive moats
Sectoral Factors:
- Coffee consumption growing in India with changing lifestyle preferences
- Export opportunities expanding with global supply chain shifts
- Company well-positioned to capture both B2B and B2C growth
- Capacity headroom provides growth visibility
What to Track?
Immediate Action Items:
- Monitor price behavior at current levels (₹1,000-1,050)
- Wait and Look for consolidation/pullback
- Set price alerts at key levels: ₹950, ₹900, ₹870
- Review quarterly results and management commentary
Ongoing Monitoring:
- Track weekly closes - should remain above ₹900
- Monitor volume patterns - sustained above-average volume bullish
- Watch for management updates on debt reduction progress
- Keep eye on green coffee prices and margin trends
- Assess broader market sentiment and FMCG sector performance
Review Triggers:
- Quarterly earnings announcements (next due February 2026)
- Any major change in promoter/institutional holdings
- Significant deviation from volume guidance (10-20%)
- Breach of critical support at ₹850
My 2 Cents:
The stock presents a compelling opportunity based on:
- Strong technical breakout with exceptional volume confirmation
- Robust fundamental performance with 37-52% revenue growth
- Industry leadership position as world's largest private label coffee manufacturer
- Improving balance sheet with proactive debt reduction
- Analysis Valid Until: Next quarterly results or significant technical breakdown below ₹870
Full Coverage on my Newsletter this Week
Keep in the Watchlist and DOYR.
NO RECO. For Buy/Sell.
📌Thank you for exploring my idea! I hope you found it valuable.
🙏FOLLOW for more
👍BOOST if you found it useful.
✍️COMMENT below with your views.
Meanwhile, check out my other stock ideas on the right side until this trade is activated. I would love your feedback.
As per the Latest SEBI Mandate, this isn't a Trading/Investment RECOMMENDATION nor for Educational Purposes; it is just for Informational purposes only. The chart data used is 3 Months old, as Showing Live Chart Data is not allowed according to the New SEBI Mandate.
Disclaimer: "I am not a SEBI REGISTERED RESEARCH ANALYST AND INVESTMENT ADVISER."
This analysis is intended solely for informational purposes and should not be interpreted as financial advice. It is advisable to consult a qualified financial advisor or conduct thorough research before making investment decisions.
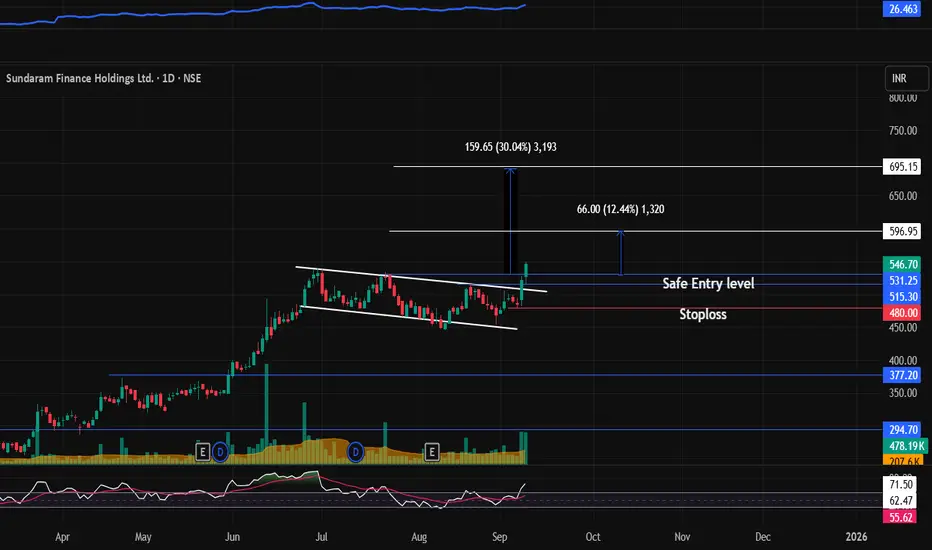
SUNDARMHLD : Breakout stock (Swing pick)#SUNDARMHLD #flagbreakout #breakoutstock #channelbreakout #swingtrading #momentumtrading
SUNDARMHLD : Swing / Short term (1-3 months)
>> Flag Breakout or Channel Breakout
>> Good Strength in stock
>> Volumes picking up
>> Low PE Stock
>> Swing Traders can Look for 10-12% Levels & Short term traders can go for Higher Levels
>> Enter at Retracement
Swing Traders can lock profit at 10% and keep Trailing
Please Boost, comment and follow us for more Learnings
Disc : Charts shared are for learning purpose only, not a Trade recommendation. Do your own research and consult your financial advisor before taking any position.
CHENNAI PETRO-BLEND OF TECHNOFUNDABuy CHENNAI PETRO 680 TILL 610 FOR target of 740 and 850. Classic blend of fundamental a technical analysis. Bullish flag and inverse head & shoulder breakout happening at 630 levels.
Also available near P to B/V with dividend yield above 8%.
view invalid below 580.
Paracables- Cables setup for climbing higher.1. Price is currently high above the multiyear strong support and ascending parallel channel
2. Fib 0.618 retracement done in monthly which is exactly matching with the support line of 44.95
3. After the RB breakout, it formed a flag pattern in monthly and yet to breakout.
4. Once breakout done, first target will be 90.51 and second target will be 220
5. Note: This setup is for long term only. So patience needed to achieve the desired results.
Note: This is for educational purpose only and not a stock recommendation.

APL Apollo Tubes - Flag & Pole BONSE:APLAPOLLO gave a Flag & Pole Breakout today. Post Q4 Results.
Con-Call Highlights:
MARCH-QUARTER CONSOL TOTAL REVENUE FROM OPERATIONS 55.09 BILLION RUPEES
MARCH-QUARTER CONSOL PROFIT 2.93 BILLION RUPEES
SEES TOTAL CAPACITY OF 6.8 MILLION TONS BY FY28
SEES CAPEX OF 15 BILLION RUPEES IN NEXT 3 YEARS
Keep in the Watchlist.
NO RECO. For Buy/Sell.
Disclaimer: "I am not a SEBI REGISTERED RESEARCH ANALYST AND INVESTMENT ADVISER."
This analysis is intended solely for informational and educational purposes and should not be interpreted as financial advice. It is advisable to consult a qualified financial advisor or conduct thorough research before making investment decisions.

FLAG PATTERN BREAKOUTEID Parry has given flag pattern breakout. The breakout candle is supported by rising volume indicating a strong momentum for short term and mid momentum also long term momentum is good. the R:R we can achieve in the trade is 1:4.

Shivalik Rasayan is on breakout & ready for Multibagger ReturnsHello Everyone i hope you all will be doing good, today i have brought a stock which has given breakout of flag pattern, and now it is ready to fly in blue sky stock name is Shivalik Rasayan and it is established in 1981, is a manufacturer of organophosphorous based insecticides and chemicals. At present company is debt free company managing its affair from internal accrual. The company has a long established reputation as a reliable and accepted supplier of quality products around the globe that endorses their commitment towards quality. SRL’s manufacturing facilities are based in Dehradun, Uttaranchal on 21 acres land. The installed capacity of the facility is more than 1000 Metric Tons per year. The company uses the latest technology available in Agro Chemical along with the ultra modern techniques to control pollution for eco friendly environment.
Stock is good with consistent earning growth and it is giving best entry for long term investing, i will suggest everyone to do SIP in this multibagger gem. It is never gonna to disappoint you in long term. Follow all the levels which i have mention on the chart.
Fundamental Analysis
Market Cap
₹ 1,263 Cr.
Current Price
₹ 812
High / Low
₹ 827 / 493
Stock P/E
90.0
Book Value
₹ 326
Dividend Yield
0.06 %
ROCE
6.08 %
ROE
2.74 %
Face Value
₹ 5.00
Industry PE
33.3
Debt
₹ 96.7 Cr.
EPS
₹ 9.02
Promoter holding
48.0 %
Intrinsic Value
₹ 222
Pledged percentage
0.00 %
EVEBITDA
30.6
Change in Prom Hold
0.00 %
Profit Var 5Yrs
-1.35 %
Sales growth 5Years
9.86 %
Return over 5years
30.3 %
Debt to equity
0.19
Net profit
₹ 17.2 Cr.
ROE 5Yr
6.49 %
Profit growth
-0.57 %
Earnings yield
2.19 %
PEG Ratio
-66.7
Disclaimer:- Please always do your own analysis or consult with your financial advisor before taking any kind of trades.
Dear traders, If you like my work then do not forget to hit like and follow me, and guy's let me know what do you think about this idea in comment box, i would be love to reply all of you guy's.

Is KPI Green's Flag Unlocking the Potential for a Remarkable 82%NSE:KPIGREEN
📈 Unleashing Potential: KPI Green's Technical Breakout Opportunity 🚀
The breakout of KPI Green, from a flag pattern is supported by trading volumes. There is evidence of institutional accumulation on specific dates; May 16th & 17th June 12th & 14th and June 20th to July 11th.
The rounding bottom pattern that is forming adds to the outlook. There might be a resistance zone around 980. As long as support remains above 885 the flag patterns strength will continue.
If KPI Green consolidates around the 980 level there could be a breakout that presents a trading opportunity.
In addition to indicators it's worth noting that KPI Green has fundamentals. For those interested, in ratios and data further information can be found in the comments section.
(Disclaimer: Information provided for educational purposes only. Not financial advice. Trading involves risk. Consult a professional before making decisions.)

Dalmia Bharat | HH-HL Uptrend Continues | 40% Upside NSE:DALBHARAT
Stock is continuously making Higher High & Higher Low Pattern
Current Price trading above all major Weekly Exponential Moving Avgs
RSI in Bullish Zone
Tgt: 2140 - 2350 - 2680
SL : 1675
Upside Potential : 40%
Time Frame : 3 - 12 Months

flag pattern - high bullish opportunity - GREENPANEL🔴DISCLAIMER
***** It's just for an educational purpose and so you must also follow your own technical analysis before taking up the trade ******
Aggressive traders enter at the breakout and conservative traders may give entry after retracement (Retracement is optional, we cannot expect every stock to take a retest after the breakout, it may also continue to have its bullish pressure after the breakout)
After reaching our targets, trail your stop loss to get maximum profit from the stock in a single trade
Comments

Two bullish chart pattern breakouts can be noticed on the chartWe have following two bullish pattern breakouts occurring on the chart.
1. Flag pattern breakout
2. Rectangle pattern breakout

