FLAG BREAKOUT + STRONG FUNDAMENTAL = AUTO STOCK ON THE MOVE SUBROS ON FIRE
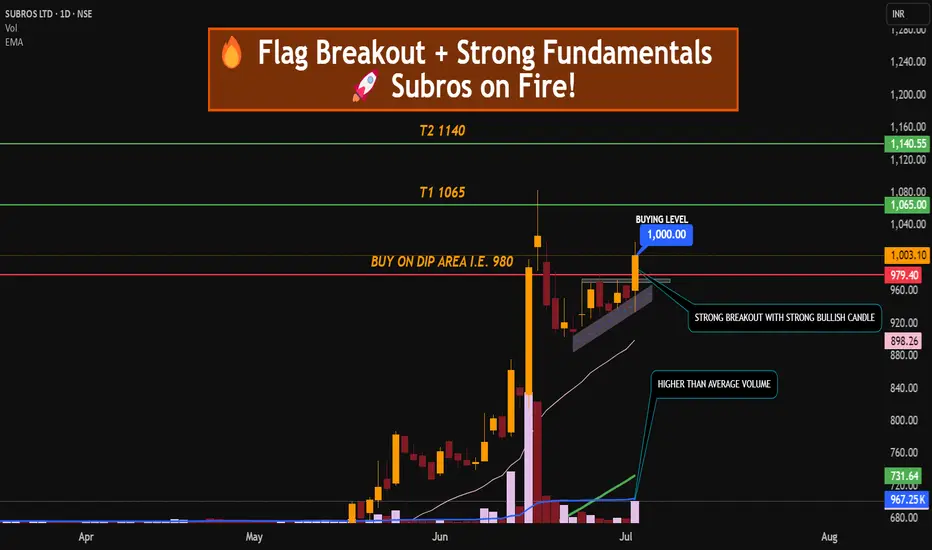
Subros Ltd has formed and broken out of a bullish flag pattern on the daily chart, supported by strong volume, indicating continuation of its upward trend.
🔍 Technical Analysis:
Pattern: Bullish flag breakout
Breakout Confirmation: Strong bullish candle above consolidation (flag zone) with volume
Strong uptrend, supported by both EMA 20 and EMA 50
Support Zone: ₹950–₹960 (previous flag top)
Volume Spike: Confirms bullish momentum on breakout
QUIK FUNDAMENTAL KEYS WHICH CONFIRM ITS BULLISHNESS.
📈 Price Strength: Strong momentum with recent 52-week high
💰 ROCE: ~17.3% (efficient capital usage)
🏦 ROE: ~12.5% (shareholder return strength)
📉 Debt to Equity: ~0.2 (low debt = financially stable)
📊 Net Sales Growth: ~20% YoY (consistent top-line growth)
🔧 Sector: Auto Ancillary – strong demand recovery cycle
💡 Trade Rationale:
Subros is technically strong with a clean flag breakout and volume confirmation. Fundamentals support this move, with consistent revenue growth, efficient capital usage, and a low-debt structure.
TRADE PLAN :
Entry: Around ₹1000 (CMP) or on dip near ₹960–₹970 (retest)
Stop Loss: ₹940 (below consolidation)
Target 1: ₹1065
Target 2: ₹1120–₹1140
Risk-Reward: ~1:2.5+
Flagpatterns
Hindustan Food Stock - Bullish Flag Pattern
Hindustan Food (HINDUNILVR) is exhibiting a classic bullish flag pattern on the daily chart, indicating a potential continuation of the upward trend. Here’s a detailed analysis and structured description for trading targets once the pattern is broken with significant volume.
Key Points:
Pattern Identification:
Hindustan Food stock is currently forming a bullish flag pattern, characterized by a sharp price rise (flagpole) followed by a consolidation phase (flag) with downward sloping trendlines.
Volume Confirmation:
A breakout from the flag pattern should be accompanied by high trading volumes to confirm the bullish momentum. Watch for volume spikes at the breakout point.
Entry Point:
Enter the trade when the stock price closes above the upper resistance trendline of the flag pattern with significant volume. This confirms the breakout.
Target Levels:
T1 - 739: The first target is set at 739, derived from the height of the flagpole added to the breakout point.
T2 - 1000: The second target is set at 1000, a psychological level and an extension of the initial flagpole projection.
SL - 436: The stop-loss is placed at 436, below the lower support trendline of the flag pattern to manage risk.
Trade Management:
Monitor the trade actively and consider trailing the stop-loss to lock in profits as the stock moves towards the target levels.
If the stock shows signs of reversal or fails to sustain above the breakout level, reassess the position to minimize losses.
