Force Motors Ltd - Breakout Setup, Move is ON...#FORCEMOT trading above Resistance of 21123
Next Resistance is at 30646
Support is at 14435
Here are previous charts:
Chart is self explanatory. Levels of breakout, possible up-moves (where stock may find resistances) and support (close below which, setup will be invalidated) are clearly defined.
Disclaimer: This is for demonstration and educational purpose only. This is not buying or selling recommendations. I am not SEBI registered. Please consult your financial advisor before taking any trade.
FORCEMOT

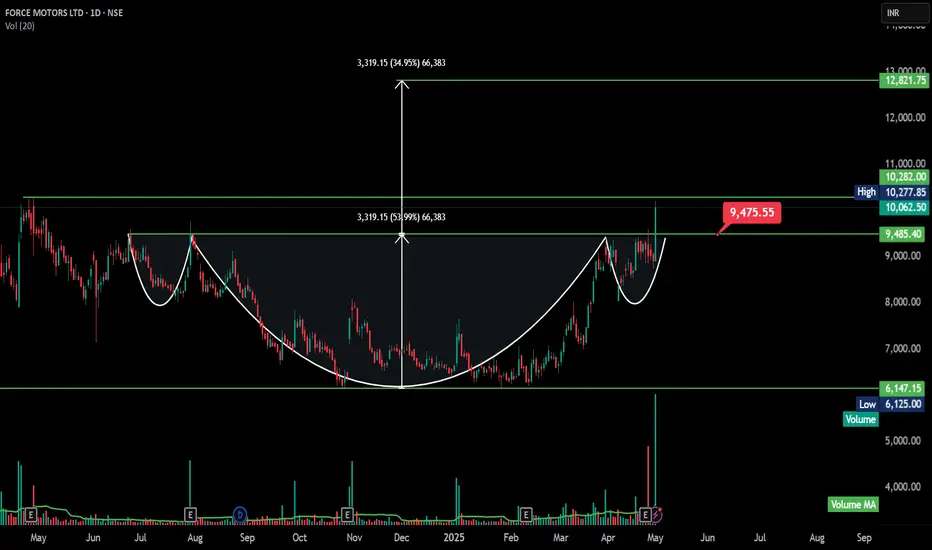
FORCEMOT - Inverted Head and Shoulder - BreakoutThe chart technical analysis of Force Motors Ltd (NSE)**, showing a **cup and handle breakout pattern**—a bullish continuation formation. Here's a breakdown of the key insights:
---
# Pattern: Inverted Head and Shoulders (Bullish Reversal)
Left Shoulder: Formed around July–August 2023.
Head: Formed in December 2023, with a deeper low.
Right Shoulder: Formed in April 2025, with a higher low.
Neckline: Drawn across the resistance zone around ₹9,475.55 — now broken.
💥 Breakout Confirmation
Price has broken above the neckline at ₹9,475.55, closing at ₹10,062.50 with a strong 12.88% gain and high volume, confirming the bullish breakout.
📊 Measured Move Target
Height (Head to Neckline) ≈ ₹3,319.15
Breakout Target = ₹9,475.55 + ₹3,319.15 = ₹12,821.75
→ This matches the projection shown on the chart (~35% upside from breakout)
🔍 Volume Analysis
Breakout is accompanied by a large volume spike (~810K vs avg), which is critical for validating an inverted head & shoulders breakout.
📏 Key Technical Levels
Breakout Point / Neckline: ₹9,475.55 (Now Support)
Resistance: ₹10,277.85 (intraday high on breakout day)
Target: ₹12,821.75
Stop-loss: Below ₹9,475 (e.g., ₹9,200–9,300 zone), depending on risk tolerance
🧭 Strategic Takeaway
This breakout from an inverted H&S pattern suggests a bullish trend reversal after a prolonged downtrend, and the volume confirmation adds strength to the setup.
FORCEMOT - Long Setup, Move is ON..NSE:FORCEMOT
✅ #FORCEMOT trading above Resistance of 2131
✅ Next Resistance is at 2840
Related charts:
Charts are self-explanatory. Levels of breakout, possible up-moves (where stock may find resistances) and support (close below which, setup will be invalidated) are clearly defined.
Disclaimer: This is for demonstration and educational purpose only. This is not buying or selling recommendations. I am not SEBI registered. Please consult your financial advisor before taking any trade.

FORCEMOT - Ichimoku Bullish Breakout Stock Name - Force Motors Ltd
Ichimoku Cloud Setup :
1). Today's close is above the Conversion Line
2). Future Kumo is Turning Bullish
3). Chikou span is slanting upwards
All these parameters are showing bullishness at Current Market Price
and more bullishness AFTER crossing 1328
#This is not Buy and Sell recommendation to any one. This is for education purpose and a helping hand to learn trading in Market.
# Cloud Trading
# Ichimoku Cloud
# Ichimoku Followers
I hope you all like my analysis.
Please do share your thoughts into comment section.
Please give a like, it motivates me to do analysis.

Breakout in Force Motors...Chart is self explanatory. Entry, Targets and Stop Loss are mentioned on the chart.
Disclaimer: This is for demonstration and educational purpose only. This is not buying or selling recommendations. I am not SEBI registered. Please consult your financial advisor before taking any trade.


FORCE MOTORS buy setupBuy FORCEMOT after a bounce above 3330
T1: 3500
T2: 3800
T3: 4200
T4: 4700
SL: 3080
