Institutional Objectives in Options Trading🎯 1. Hedging Large Portfolios
One of the primary institutional goals is to protect investments from unfavorable market movements. Since institutions hold large quantities of stocks, they face massive risk if the market turns against them.
✅ Example:
A mutual fund holding ₹100 crore worth of Nifty 50 stocks might buy Put Options on Nifty to protect against a market crash.
This acts like insurance — a small premium is paid to avoid a huge loss.
🔹 This is called a protective put strategy.
📈 2. Generating Additional Income
Institutions also use options to generate consistent income. Since they often hold large amounts of shares, they can write (sell) options against these positions.
✅ Example:
Selling Covered Calls against stock holdings generates premium income, especially when expecting the market to remain sideways.
Writing Cash-Secured Puts allows them to earn premium while preparing to buy a stock at a lower price.
🔹 This enhances portfolio returns without needing to sell the core holdings.
📉 3. Managing Volatility Exposure
Volatility is a double-edged sword. Institutions analyze and trade implied volatility (IV) rather than just direction. They adjust their portfolios using options to profit from volatility changes or to reduce risk when volatility spikes.
✅ Common practices:
Use straddles and strangles before major events like earnings or elections.
Buy options when IV is low (expecting a spike) and sell options when IV is high (expecting it to drop).
🔹 This is called volatility arbitrage or vega trading.
🔁 4. Portfolio Adjustment and Rebalancing
Institutions use options to rebalance exposure without triggering capital gains taxes or disturbing existing stock positions.
✅ Example:
Instead of selling shares, an institution might:
Buy puts to reduce downside risk.
Sell calls to lock in profits.
Use spreads or collars to control price bands of risk/reward.
🔹 This helps in making tactical moves without liquidating long-term holdings.
💡 5. Directional Bets With Limited Risk
Though not their primary objective, institutions sometimes make directional bets using options for leveraged exposure, with defined risk.
✅ Example:
If a fund expects a strong upside in a stock, it might buy call options instead of the stock itself.
This reduces capital requirement and limits downside to the premium paid.
🔹 This is common in event-driven trading, such as earnings, mergers, or regulatory announcements.
🔄 6. Capital Efficiency
Institutions are under constant pressure to manage capital efficiently. Buying or selling options allows them to control larger positions with less money, keeping more capital available for other trades.
✅ Example:
Instead of buying 1,00,000 shares of a company, they might buy deep ITM call options to replicate stock movement with lower capital.
🔹 This is known as synthetic long exposure.
⚖️ 7. Risk Transfer and Insurance
Options allow institutions to transfer market risk to willing counterparties. They use customized derivatives or listed options to insure specific risks, such as:
Currency risk
Interest rate risk
Commodity price risk
Equity drawdowns
🔹 Large institutions like banks and insurance firms use over-the-counter (OTC) options for complex hedging.
🛠️ 8. Complex Strategy Execution
Institutions often use multi-leg strategies for market-neutral setups or for fine-tuned payoff structures. These include:
Iron Condors
Butterfly Spreads
Calendar/Diagonal Spreads
Box Spreads
Delta-neutral gamma scalping
🔹 These allow fine control over expected profits and losses, based on volatility, time decay, and price movement.
Fore

Institutional Trading StrategiesWhat is Institutional Trading?
Institutional trading means the buying and selling of stocks, futures, options, and other financial instruments by large organizations. These organizations are often:
Mutual Funds
Pension Funds
Hedge Funds
Banks and Insurance Companies
Foreign Institutional Investors (FII)
Domestic Institutional Investors (DII)
Unlike retail traders who trade with small amounts of capital, institutional players move huge sums of money, sometimes trading in crores or billions in a single day.
Why Do Institutions Trade Differently?
Institutions have massive capital, so their approach is completely different:
They can’t enter or exit a stock quickly without moving its price.
They focus more on long-term positions or large short-term trades.
They use advanced tools like algorithms, high-frequency trading, and exclusive market data.
In simple words: they trade like whales in the ocean, while retail traders are like small fish.
Core Institutional Trading Strategies Explained
1. Order Flow and Volume Analysis
Institutions often leave their footprint in the market by how much they buy or sell. This is visible through volume spikes and order flow. Retail traders can track this by:
Watching unusual volume on a stock
Monitoring delivery percentage (for cash segment)
Using indicators like VWAP (Volume Weighted Average Price) to see where large trades are happening
Institutions use volume as a key indicator because when big money flows in, prices generally follow.
2. Order Block and Supply-Demand Zones
Institutions don’t buy stocks in one go. They accumulate positions slowly within certain price ranges. These areas are called:
Order Blocks – zones where large buying or selling has happened in the past.
Supply-Demand Zones – areas where the market reacts due to prior institutional activity.
When price comes back to these zones, you will often see a strong bounce (demand) or rejection (supply).
3. Breakout and False Breakout Manipulation
Institutions are masters of manipulation. They often cause:
False Breakouts to trap retail traders.
Breakdown traps to collect positions cheaply.
You will see prices breaking key levels (like support or resistance), triggering retail stop losses, and then reversing sharply. Institutions use liquidity from these retail stop losses to enter or exit positions.
4. Volume Weighted Average Price (VWAP) Strategy
Most institutions benchmark their trades around VWAP.
When prices are above VWAP, the bias is bullish.
When prices are below VWAP, the bias is bearish.
Institutions often buy when price retraces to VWAP after a breakout and sell when it tests VWAP after a breakdown. VWAP acts like a fair value line for many large traders.
5. Liquidity Hunting and Stop Loss Fishing
Institutions need liquidity to place large orders. So they create fake moves:
Push prices higher to make retail buy, then sell into it.
Push prices lower to trigger retail stop-losses and then reverse the price upwards.
This is why retail traders often feel the market is “hitting my stop-loss and then moving in my direction”.
6. Options Data Analysis
Institutions hedge their cash and futures positions using options:
High Open Interest (OI) at certain strike prices indicates important levels.
Sudden OI build-up can show institutional call writing (bearish) or put writing (bullish).
Institutions use Option Selling strategies because time decay (theta) works in their favor.
Retail traders can track option data to understand institutional bias, especially around expiry.
7. Algorithmic Trading (Algo Trading)
Institutions use computers (algos) to execute trades based on pre-defined rules:
Speed: Algos trade in microseconds.
Precision: No emotions, just system-based entries and exits.
Scalability: Handles thousands of orders simultaneously.
You can’t compete with algos on speed, but you can follow the flow by watching patterns like sudden large candles without news or price bouncing off VWAP repeatedly.
8. Fundamental Catalysts Trading
Institutions also trade based on news, earnings, and economic data:
Positive quarterly results → gradual accumulation before the news
Interest rate changes → repositioning in banking stocks
Government policy changes → entering sectors like infrastructure or defense
They often buy early before the public knows and sell after retail traders start entering.
9. Sector Rotation Strategy
Institutions rotate money between sectors:
Moving from IT to Banks
From FMCG to Auto
From Metal to Pharma
Retail traders get stuck chasing one stock, while institutions follow where big sector money is flowing. You can track sector indices (like Nifty Bank, Nifty Auto) to ride these moves.
10. Index Balancing Strategy
In indices like Nifty 50 or Sensex, institutions adjust portfolios based on:
Index addition/removal
Rebalancing due to quarterly reviews
Passive fund flows
Stock prices often jump or fall sharply around these events, giving smart traders easy trading opportunities.
How to Identify Institutional Activity as a Retail Trader
Look for unusual volume spikes
Watch for rejection or breakout around order blocks
Use VWAP as a guidance tool
Track option chain data before key events
Follow sector rotation via index charts
Watch price-action near important news events
Practical Tips for Retail Traders
Trade less, trade better: Institutions don’t chase every small move, neither should you.
Wait for confirmation: Let institutions show their hand through volume before entering.
Avoid emotional trades: The market is designed to make you emotional — don’t fall for it.
Risk management is king: Institutions have risk teams; you must use stop-loss.
Never blindly follow tips: By the time you hear news, institutions are already in or out.
Why Institutional Strategies Work Better
Institutions follow a data-driven approach backed by:
Risk management policies
Trained analysts
Large capital to manage volatility
No emotional trading
Use of technology (Algos)
Retail traders who respect market structure and trade alongside institutions improve their win rate dramatically.
Final Thoughts
Institutional Trading is all about structure, discipline, and patience. It’s not about guessing but about observing market behavior — where are the big players active? Why is volume rising? Where is liquidity flowing?
You don’t need huge capital to benefit from institutional strategies. You simply need to follow the footprints, avoid traps, and focus on high-probability trades.
Learn Institutional Trading Part-8✅ What is the Trading Master Class?
The Trading Master Class with Experts is a comprehensive and interactive program where seasoned market professionals share their knowledge, trading systems, and live market experience. It’s not just about theory — it's about real techniques that work in today’s volatile and highly manipulated markets.
You’ll learn:
How institutions really move the markets
When and why price reverses (not just where)
How to build your own strategy with risk management
Live chart reading and trade planning with expert commentary
🧠 What You’ll Learn in the Master Class
1. Market Basics to Advanced Concepts
Understand price action, market structure, order flow, and key indicators. Move from beginner to strategic thinker.
2. Smart Money Concepts
Learn how hedge funds and institutions trade. Understand concepts like:
Order Blocks
Liquidity Zones
Fair Value Gaps
Trap Moves & Stop Hunts
3. Live Market Analysis
Watch experts break down charts in real-time. Learn how they spot opportunities, manage risk, and plan entries/exits.
4. Risk Management & Trading Psychology
Know how much to risk, where to place stop-losses, and how to stay disciplined. Learn how pros control emotions and trade with confidence.
5. Strategy Building
You won’t just follow someone else’s setup — you’ll learn how to build your own based on logic and data, not guesswork.
👨🏫 Why Learn From Experts?
Books and free videos can only take you so far. Expert traders bring:
Years of market experience
Real trade breakdowns with proof
Live Q&A support
Mentorship that corrects your mistakes
You get access to tested methods, real examples, and market insight that’s hard to find elsewhere.
🚀 Who Should Join?
New traders wanting proper guidance
Retail traders tired of inconsistent results
Intermediate traders wanting to go pro
Investors looking to add short-term income through trading
🎯 Final Thought
Success in trading doesn’t come from signals, hype, or luck — it comes from education, mentorship, and practice. The Trading Master Class with Experts gives you a shortcut to years of trial-and-error by putting you in direct contact with those who have already mastered the craft.
Join the master class, learn from the best, and take your trading journey to the next level.

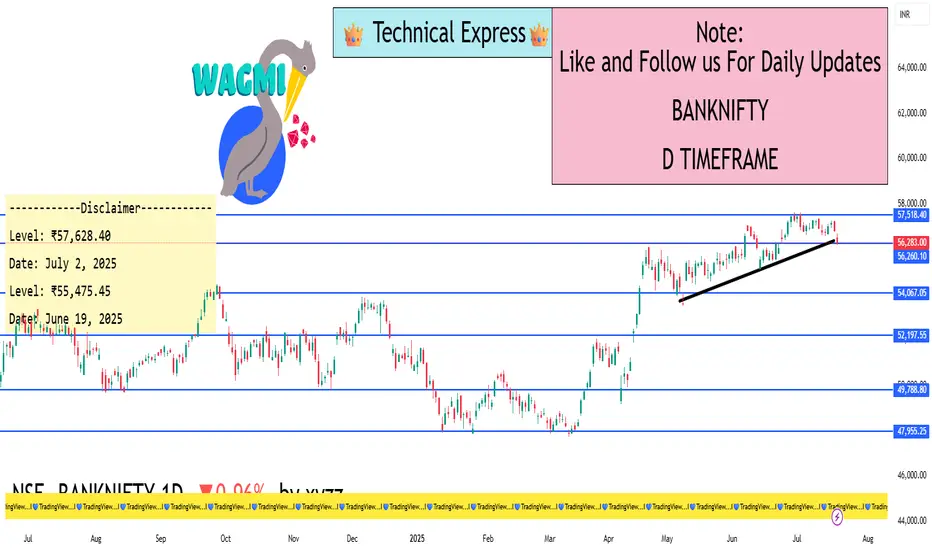
BANKNIFTY - 1D Timeframe📅 Current Market Status (as of July 18, 2025)
Closing Price: ₹56,283
Fall Today: –547 points (–0.96%)
Intraday Range: ₹56,205 (Low) to ₹56,849 (High)
52-Week Range: ₹43,199 (Low) to ₹57,817 (High)
2025 Performance So Far: Up around 9.5%
🧮 Moving Averages – All Are Negative
From 5-day to 200-day, all moving averages are giving SELL signals.
This confirms a strong downtrend.
Price is below every major moving average → means no strength for recovery yet.
📉 Support and Resistance Levels
Type Price Range
Support ₹55,800 – ₹56,000
Resistance ₹56,700 – ₹57,200
If the price falls below ₹55,800, we may see further fall toward ₹55,000.
For any upward trend to begin, Bank Nifty must close above ₹57,200.
⚠️ Market Mood – What’s Going On?
Strong Downtrend: Bears are in control; market is falling continuously.
High Volume on red candles: Big traders are selling heavily.
Oversold Condition: Market has fallen too much, may bounce a little.
High Volatility: Big movements (500–600+ points) can happen daily.
✅ Easy Summary
Overall Trend: Bearish (Downtrend)
Short-Term Possibility: Small upward bounce may come due to oversold indicators
But: No proper recovery signal until Bank Nifty moves above ₹57,200
Traders should be cautious – trend is still weak and selling pressure is high.
🔮 What to Watch Next?
RSI Above 35: Could be an early sign of recovery.
MACD Crossover: Needed for trend reversal.
Low Red Candle Volume: Means selling may be ending.
₹55,800 Support: If this breaks, further downside likely
USDXprice shows nice rejection from the daily level and the lower timeframes shifted structures which looks like a bullish move lets wait for the market open on Monday and will flow with the market

Ascending Triangle in USDCAD - "Learn More Earn More" With USUSDCAD is coiling for its next move.
The higher lows suggest strength, but USDCAD needs to secure a close above 1.34200 to open the door to the 1.35000 area.
Keep an eye on 1.33720 in the event of a pullback.
❤️ If you find this helpful and want more FREE forecasts in TradingView
. . . . . Please show your support back,
. . . . . . . . Hit the 👍 LIKE button,
. . . . . . . . . . Drop some feedback below in the comment!
❤️ Your Support is very much 🙏 appreciated!❤️
💎 Want us to help you become a better Forex trader?
Now, It's your turn!
Be sure to leave a comment let us know how do you see this opportunity and forecast.
Trade well, ❤️
ForecastCity English Support Team ❤️

