Option Trading✅ Why Trade Options?
📊 Profit in All Market Conditions — Whether markets go up, down, or stay flat, options allow you to build strategies for every scenario.
💰 Limited Risk, High Reward — With proper strategies like buying options, you can limit your risk to the premium paid but enjoy unlimited upside.
🔒 Hedge Existing Investments — Investors use options to protect their portfolios from market crashes.
🧩 Flexibility — Options allow for creative trade setups such as income generation, speculation, and hedging.
📉 Leverage — Control larger positions with less capital.
✅ Key Concepts in Option Trading
1. Call Option (Buy Side):
Gives the buyer the right to buy an asset at a certain price before expiry.
✅ Call Buyer profits when price goes up.
✅ Call Seller (Writer) profits when price stays flat or falls.
2. Put Option (Sell Side):
Gives the buyer the right to sell an asset at a certain price before expiry.
✅ Put Buyer profits when price goes down.
✅ Put Seller profits when price stays flat or rises.
✅ Important Terms to Know
Strike Price – The fixed price at which you can buy or sell the underlying asset.
Premium – The cost paid by the option buyer to the seller for the right to exercise.
Expiry Date – The date when the option contract becomes void.
In-the-Money (ITM) – Option has intrinsic value (profitable if exercised).
Out-of-the-Money (OTM) – Option has no intrinsic value (unprofitable if exercised).
At-the-Money (ATM) – Option strike is closest to the current market price.
✅ Popular Option Trading Strategies
1. Directional Strategies:
Long Call – Profit from rising markets.
Long Put – Profit from falling markets.
2. Non-Directional Strategies:
Iron Condor – Profit from range-bound markets.
Straddle/Strangle – Profit from big movements in either direction.
Butterfly Spread – Low-cost strategy for limited movement with high reward potential.
3. Income Strategies:
Covered Call – Selling calls on owned stocks for premium income.
Cash-Secured Put – Selling puts on stocks you want to own at a lower price.
✅ Advanced Concepts for Institutional-Level Trading
📌 Implied Volatility (IV): Measures expected future volatility; options become expensive when IV rises.
📌 Theta Decay: Time decay that eats away premium, favoring option sellers.
📌 Delta, Gamma, Vega, Theta (Greeks): Quantify how option prices react to changes in market conditions.
📌 Hedging with Options: Professionals hedge large portfolios using protective puts or collars.
📌 Liquidity and Open Interest: High open interest means better liquidity, tighter spreads, and easier trade execution.
✅ Why Institutions Prefer Option Trading
Institutions, banks, and hedge funds use options to:
Hedge large stock portfolios.
Generate steady returns through premium collection.
Manage volatility exposures.
Create complex structured products.
They use strategic adjustments, rollovers, and risk-defined positions to control large portfolios with precision.
✅ Common Mistakes to Avoid in Options
❌ Trading without understanding volatility impact.
❌ Ignoring time decay when buying options.
❌ Going all-in on OTM options with low probabilities.
❌ Not managing trades near expiry.
❌ Trading without considering the Greeks.
✅ Final Thoughts
Option Trading is not gambling — it’s a professional tool for risk management, income generation, and speculation. When used correctly, options offer high flexibility, controlled risk, and diverse profit opportunities. However, success requires education, discipline, and strategy.
Learn the true power of Option Trading, master market behavior, and you will have one of the most versatile weapons in your financial toolkit
Forex

Divergence Secrets✅ What is Divergence?
Divergence occurs when price action and an indicator (usually a momentum oscillator) move in opposite directions. This signals a disconnection between price and momentum, often happening before significant reversals.
Most Common Indicators Used:
RSI (Relative Strength Index)
MACD (Moving Average Convergence Divergence)
Stochastic Oscillator
CCI (Commodity Channel Index)
✅ Types of Divergence
1. Regular Divergence (Classic Divergence)
Bullish Divergence: Price makes lower lows, but the indicator makes higher lows → Suggests potential upward reversal.
Bearish Divergence: Price makes higher highs, but the indicator makes lower highs → Suggests potential downward reversal.
📌 Use Case: Best applied during downtrends (bullish divergence) or uptrends (bearish divergence) to catch reversals.
2. Hidden Divergence (The Professional’s Favorite)
Bullish Hidden Divergence: Price makes higher lows, but indicator makes lower lows → Signals trend continuation upwards.
Bearish Hidden Divergence: Price makes lower highs, but indicator makes higher highs → Signals trend continuation downwards.
📌 Use Case: Hidden divergence is used to confirm trend continuation after pullbacks, ideal for trend traders.
3. Exaggerated (Extended) Divergence
Price forms equal highs/lows, but the indicator shows higher lows/lower highs → Signals momentum build-up for reversal.
📌 Use Case: Seen at range breakouts or market tops/bottoms.
✅ Why Divergence Works (Institutional View)
Liquidity Manipulation: Institutions push price to make new highs/lows to grab liquidity, but momentum slows because real volume decreases.
Momentum Imbalance: Even as price extends, internal market strength weakens, revealed through divergence.
Smart Money Accumulation/Distribution: Divergence often appears when institutions quietly build or offload positions, creating momentum shifts.
✅ Advanced Divergence Trading Secrets
🔥 Secret #1: Multi-Timeframe Divergence
Always check divergence on higher timeframes (H4, Daily), then execute entries on lower timeframes (M15, H1).
A daily divergence holds more power than M15 divergence.
🔥 Secret #2: Confluence with Support/Resistance or Order Blocks
Divergence is strongest when it happens at a key structure level (support, resistance, order block, or imbalance zone).
Don’t trade divergence alone — combine it with price reaction at major zones.
🔥 Secret #3: Wait for Structure Break Confirmation
After divergence, wait for Break of Structure (BOS) or Change of Character (CHoCH) to confirm reversal.
This filters out many false divergence signals.
🔥 Secret #4: Volume Confirmation
Confirm divergence with volume drop or volume spike reversal.
Divergence with low participation increases reversal probability.
✅ Pro Divergence Entry Method
✅ Spot Divergence at key levels.
✅ Wait for candlestick confirmation (engulfing candle, pin bar, inside bar).
✅ Look for Break of Minor Structure.
✅ Enter on retest of BOS/CHoCH zone or order block.
✅ Stop loss below swing low/high, target next liquidity pool or imbalance zone.
✅ Common Mistakes to Avoid
❌ Trading divergence without context (e.g., countering a strong trend blindly).
❌ Ignoring higher timeframe trend direction.
❌ Entering without confirmation candle or structure break.
❌ Using lagging indicators without understanding price action.
✅ Final Thoughts
Divergence is a leading indicator, but it must be combined with market structure, key levels, and confirmation price action. Professionals use divergence as a warning sign, not an instant entry trigger. By mastering divergence, you can predict market exhaustion, capture high-reward reversals, and avoid common retail traps.
Divergence is one of the hidden secrets of market timing — master it, and your trading accuracy will improve dramatically

Learn Institutional TradingWhy Learn Institutional Trading?
The financial markets are not random; they are highly structured environments controlled by large financial players who leave visible footprints on the chart. Most retail traders don’t see these footprints and end up on the wrong side of the market. By learning institutional trading, you will finally understand:
Why the market moves the way it does.
How to spot liquidity traps and avoid stop-loss hunting.
Where smart money enters and exits trades.
How to trade with confidence instead of fear and guesswork.
This course focuses on the real mechanics of price movement, not on unreliable indicators or random trade signals.
What You Will Learn in Institutional Trading
✅ Smart Money Concepts (SMC):
Learn how institutional traders accumulate and distribute orders, using liquidity to their advantage. Understand the true story behind price action.
✅ Liquidity and Order Blocks:
Master the art of identifying liquidity pools, order blocks, and market manipulation zones. Understand where smart money enters the market and how you can follow their lead.
✅ Market Structure Mastery:
Learn to read market structures with precision, identify internal and external structures, and capitalize on market shifts with high-probability trade setups.
✅ Entry and Exit Strategies:
Get access to professional-grade entry methods, including refined confirmation entries, break-of-structure (BOS) trades, and optimal risk-reward setups.
✅ Risk Management Techniques:
Understand how institutions manage risks and protect their capital. Implement strong risk management rules to protect your trading account from unnecessary losses.
✅ Live Market Sessions and Mentorship:
Participate in live market discussions, chart breakdowns, and Q&A sessions with expert traders who trade institutional concepts every day.
Who Can Learn Institutional Trading?
This course is suitable for:
📌 Beginners who want to start with professional strategies from day one.
📌 Intermediate traders who are tired of inconsistent results.
📌 Advanced traders who want to refine their understanding of market manipulation.
📌 Investors who wish to add active trading as an income source.
📌 Aspiring professionals who aim to make trading a serious career path.
Benefits of Learning Institutional Trading
✅ Trade with clarity and confidence, knowing you are on the side of smart money.
✅ Stop chasing trades and start trading with high-probability setups.
✅ Learn to avoid retail traps and false breakouts.
✅ Build a sustainable trading career with proper risk management and psychological discipline.
✅ Apply your skills to any market: stocks, forex, crypto, indices, or commodities.
✅ Experience real growth as a professional trader, thinking several steps ahead of the market.
Learn Institutional Trading is more than just a course — it’s a complete professional transformation. It equips you with the skills, mindset, and strategies to succeed in modern financial markets. Stop trading blindly and start trading with purpose, accuracy, and confidence.

Master Institutional TradingWhy Master Institutional Trading?
The stock market, forex, and other financial markets are highly manipulated environments, driven by the decisions of institutional traders, banks, hedge funds, and large players. Learning how these institutions trade gives you the clarity and confidence to trade in the direction of smart money rather than becoming a victim of market traps.
With this program, you will not only learn how the markets operate but also how to read price movements like an institutional trader. You’ll master advanced techniques that allow you to identify high-probability trade setups, manage your risks like a professional, and trade with patience and precision.
Key Features of Master Institutional Trading
Smart Money Concept (SMC): Understand the core principles of smart money trading, including how large institutions accumulate and distribute assets.
Liquidity Hunting Strategies: Learn how institutions use liquidity zones, stop loss hunting, and false breakouts to trap retail traders — and how you can profit by following their footprint.
Order Block Mastery: Master the identification of order blocks, breaker blocks, and mitigation blocks — key areas where institutional orders are placed.
Market Structure & Price Action: Analyze clean price action without relying on lagging indicators. Understand market structure shifts, internal and external liquidity, and premium/discount zones.
Advanced Risk Management: Learn professional risk management techniques to control drawdowns and maximize returns, including how institutions scale in and out of positions.
Live Market Analysis: Get exposure to live trading sessions where experts explain the logic behind every trade entry and exit, based on institutional concepts.
Psychological Discipline: Develop a winning mindset focused on discipline, patience, and long-term profitability, just like professional traders working in financial firms.
Who Is This Course For?
This program is ideal for:
Traders who want to stop following retail strategies and learn real market mechanics.
Beginners who want to build a solid institutional foundation from the start.
Intermediate traders who are struggling with inconsistent results and want to level up their skills.
Experienced traders who wish to refine their market reading abilities and trade with greater precision.
Full-time or part-time traders seeking to understand price manipulation and liquidity traps.
What You’ll Gain from This Master Class
✅ The ability to track institutional footprints and predict market movements more accurately.
✅ A complete system based on price action, market structure, and liquidity analysis.
✅ Tools and strategies to avoid false signals and stop-loss hunts.
✅ Improved risk-reward ratios by trading in the direction of smart money.
✅ A professional, emotion-free approach to trading that focuses on long-term profitability.
✅ Real-world practical skills that you can apply in any market — stocks, forex, crypto, or commodities.
This is not a basic or theoretical course. The Master Institutional Trading program delivers real, professional-level trading knowledge, breaking down the hidden market mechanics that drive price action. By the end of this program, you will no longer trade like the crowd — you will trade like the institutions that move the markets

Trading Master Class With ExpertsWhy Choose the Trading Master Class With Experts?
In the world of trading, there’s a fine line between success and failure. The financial markets are full of opportunities but also come with significant risks. The key difference between winning traders and losing traders is education, discipline, and strategy. This masterclass is not just about learning how to trade; it’s about developing a professional trading mindset, learning proven techniques, and practicing high-probability setups under the guidance of industry experts.
This is a result-oriented program designed to give you a complete transformation from a confused trader to a disciplined market participant.
Key Highlights of the Master Class
In-Depth Market Knowledge: Learn the complete fundamentals of financial markets, including market structure, how different asset classes work, and what drives market movements.
Technical Analysis Mastery: From candlestick patterns to advanced indicators, understand how to read charts like a pro. Learn key technical tools like moving averages, RSI, MACD, Fibonacci retracements, and more.
Professional Trading Strategies: Master multiple trading styles including day trading, swing trading, scalping, and positional trading. Get access to expert-verified strategies used by institutional traders.
Options and Derivatives Trading: Understand the power of options trading, futures contracts, hedging techniques, and options strategies like iron condor, spreads, straddles, and strangles.
Institutional Trading Insights: Discover how big players operate in the market. Learn about smart money concepts, liquidity traps, stop loss hunting, and how to trade in alignment with market movers.
Risk Management and Trading Psychology: Learn how to protect your capital using strict risk management rules. Understand the psychological side of trading and how to build emotional discipline for consistent success.
Live Trading Sessions: Participate in live market analysis and live trading sessions with experts who explain their trades in real-time, helping you understand their decision-making process.
Community and Mentorship: Join a supportive community of traders where you can share ideas, discuss setups, and receive continuous guidance from mentors.
Who Should Attend This Master Class?
This masterclass is suitable for:
Aspiring traders who are looking for a solid foundation to start their trading journey.
Intermediate traders who are struggling with consistency and need structured guidance.
Investors who want to learn active trading techniques to multiply their returns.
Working professionals who want to trade part-time with smart strategies.
Full-time traders who want to sharpen their skills and expand their market knowledge.
What You Will Achieve After This Master Class
✅ You will be able to independently analyze charts and identify profitable trading opportunities.
✅ You will develop professional risk management habits that protect you from heavy losses.
✅ You will gain the confidence to trade any market condition — bullish, bearish, or sideways.
✅ You will have clear strategies to trade with discipline, eliminating guesswork and emotional mistakes.
✅ You will build a trader’s mindset focused on growth, patience, and long-term profitability.
This is not just another trading course. It is a complete transformation program that helps you think, act, and succeed like a professional trader. Step into the world of high-probability trading and change your financial future with the Trading Master Class With Experts.

Master Candle Sticks✅ Why Candlesticks Are So Powerful
Candlesticks visually represent real-time market sentiment. Every single candlestick shows you:
Who is in control (buyers or sellers).
The strength of momentum.
Potential exhaustion or continuation.
The battle between retail traders and smart money.
Unlike indicators, which lag, candlesticks are real-time market footprints, helping traders make quick, informed decisions based on pure price action.
✅ Structure of a Candlestick
Every candlestick consists of:
Body: The range between open and close prices — shows strength or weakness.
Wick/Shadow: High and low of the session — shows rejection, liquidity grabs, or manipulation.
Color: Bullish (green/white) vs. Bearish (red/black).
The size of the body and wicks tells a story about market strength or indecision.
✅ Essential Candlestick Patterns
🔵 Reversal Patterns:
Pin Bar (Hammer/Inverted Hammer): Long wick shows rejection of price and potential reversal.
Engulfing Candles: Bullish or bearish candles fully engulf previous candle → momentum shift.
Morning Star / Evening Star: Three-candle reversal at key levels → trend change confirmation.
Doji: Indecision candle, often seen before reversals or breakouts.
🔵 Continuation Patterns:
Inside Bar: Consolidation, often leading to breakouts in the direction of trend.
Bullish/Bearish Flag: Continuation after a sharp move.
Three White Soldiers / Three Black Crows: Strong multi-candle trend confirmation.
✅ Advanced Institutional Candlestick Secrets
🔥 Secret 1: Candlesticks at Key Market Levels
Candlestick signals are most reliable at:
Order Blocks
Support & Resistance Zones
Liquidity Pools
Imbalance/Fair Value Gaps
Always combine candlestick signals with higher timeframe zones for high-probability setups.
🔥 Secret 2: Wick Rejections & Stop Loss Hunts
Institutions often push price to grab liquidity beyond a support/resistance level, shown by long wicks. Wick rejections = liquidity grab = high reversal probability.
🔥 Secret 3: Multi-Timeframe Candlestick Reading
A single higher timeframe candle (Daily, 4H) is built from multiple smaller timeframe candles. Professionals:
Use HTF direction and LTF entry.
For example, Daily bullish engulfing + M15 break of structure = precise sniper entry.
✅ How to Master Candlestick Trading
✅ Focus on clean price action, avoid overcrowding charts with indicators.
✅ Study reaction at key levels, not random patterns.
✅ Always confirm with market structure (trend direction, higher highs/lows, BOS/CHoCH).
✅ Use candlestick confluence, combining patterns with liquidity zones, order blocks, or supply/demand.
✅ Avoid low-quality signals in choppy or low-volume markets.
✅ How Institutions Use Candlesticks
Institutions manipulate candles during low liquidity periods (fakeouts).
They use time-based traps, creating bullish/bearish patterns before reversing direction.
Volume + Candlestick Analysis shows true institutional intent — e.g., high volume bullish pin bars after liquidity grab = strong upside signal.
✅ Pro Tips for Candlestick Mastery
💡 Best signals occur after liquidity grabs — false breakout + rejection wick.
💡 Always combine candlesticks with market structure shifts — don’t take isolated signals.
💡 Trade in the direction of higher timeframe momentum, even if lower timeframe gives opposite signals.
💡 In sideways markets, avoid reversal signals, favor range trades.
✅ Final Thoughts
Candlesticks are the true language of the market. By mastering candlestick trading, you’ll gain the ability to predict market moves before they happen, trade with confidence, and avoid the common mistakes of indicator-dependent retail traders.
Master Candlestick Trading is your first step to becoming a consistently profitable trader, whether in forex, stocks, crypto, or commodities

EURUSD on the verge – a trap waiting for the carelessThis pair has just completed a classic rounding top, with a sharp rejection near 1.16500. Buying momentum is fading, RSI is dropping, and the recent retest of the broken trendline might have been the final warning – the “kiss of death” could already be in play.
On the fundamental side, the U.S. keeps fueling the dollar: consumer spending is rising, jobless claims are falling, and the Fed shows no sign of easing up. Meanwhile, the ECB is still searching for direction, leaving the euro exposed and vulnerable.
If the current support level breaks, EURUSD could slide quickly to lower zones. This is no longer a time for hope – it’s time to choose a side and act.

XAUUSD: breakout risk is approachingXAUUSD has been consolidating in a tight range since early July. Despite multiple bounces from support, price has failed to deliver a clear breakout, signaling weakening buying pressure. The current structure leans bearish, with momentum turning increasingly negative.
On the news front, the U.S. economy continues to show strong recovery: rising consumer demand, falling unemployment, and surging USD and bond yields. This puts significant pressure on gold – a non-yielding asset in a high-interest environment.
If price breaks below the bottom of the range, the downside could accelerate sharply in the near term. Buyers should remain extremely cautious in this setup.

EURUSD under pressureEURUSD is moving within a well-defined descending channel, forming consistent lower highs and lower lows. The price has recently rejected the resistance zone near 1.16100, showing signs of continued bearish momentum.
On the fundamental side, stronger-than-expected U.S. retail sales—especially in the core figure—have boosted the U.S. dollar, putting downward pressure on the euro. Coupled with ongoing concerns about Eurozone economic growth, the pair is likely to continue its decline toward the 1.15400 support area. RSI remains below the neutral zone, confirming short-term bearish bias.
Traders should watch closely for reactions at support to assess further short opportunities.

Gold wavers under pressure from strong U.S. retail dataXAUUSD is currently fluctuating within a price box, showing weaker bullish attempts and failing to break above the nearest resistance zone. Selling pressure is mounting as price continues to be rejected at the top and is approaching the medium-term ascending trendline — a key support level.
On the news front, U.S. core retail sales surged, boosting expectations for a stronger USD, which in turn weighs on gold prices. However, a slight uptick in unemployment claims may help slow the dollar’s momentum.
If buyers fail to defend this critical support, the bullish structure risks being broken, potentially signaling a shift toward a clearer downtrend. On the flip side, the price box could still act as a consolidation phase before another bullish leg.

XAUUSD 1H – Watching for a Bounce Inside the ChannelGold is still moving nicely inside this big ascending channel. After hitting resistance, price is pulling back toward the lower support area and trendline.
👉 My Plan:
Waiting to see if price holds around $3,310–$3,320 zone.
If we get bullish signs (strong candle, rejection wick), I’ll look for longs back up toward $3,350–$3,370 and maybe higher.
✅ Key Levels:
Support: $3,310 area
Resistance: $3,345 – $3,370
Break below support could invalidate this idea.
Just being patient and letting price action confirm the next move. Let’s see how it plays out!

XAUUSD – The Bullish Wave Emerges, Target Closer Than Ever!Gold has broken out of its previous descending channel, confirming a trend reversal. Current price action is forming higher lows while consistently filling Fair Value Gaps (FVGs) – a clear sign that institutional money is flowing back in.
The next key target is the previous high near 3,399, where some short-term profit-taking may occur. However, if buyers can defend the support zone around 3,348, the chances of breaking above resistance will increase significantly.
On the news front, the U.S. dollar is weakening as housing and industrial production data show signs of slowing, fueling speculation that the Fed may pause further rate hikes this year.

EUR/USD: Continuing Downtrend and Key Levels to WatchHello traders, what are your thoughts on EUR/USD?
Today, EUR/USD continues its strong downtrend, currently trading around 1.161. One of the key factors driving this decline is the strong recovery of the USD. Following the release of positive data from the US, especially the unemployment report, the market has reinforced expectations that the Fed will maintain high interest rates for a longer period. This has reduced the appeal of the euro, putting significant pressure on EUR/USD.
From a technical perspective, the price is approaching the trendline's lower limit, and a breakout at this point could push EUR/USD further down. Personally, I expect the EMA 89 area to be an ideal target for this strategy.
What about you, do you agree with my outlook? Feel free to share your thoughts, and let’s discuss!

Geopolitical & US Macro WatchWhat Is Geopolitical & US Macro Watch?
This is a two-part term:
1. Geopolitical Watch
This refers to tracking and analyzing global political situations that can impact trade, oil, currency, defense, or investor confidence. Examples include:
Wars or conflicts (Ukraine-Russia, Israel-Gaza, China-Taiwan)
Global oil sanctions
Strategic alliances (e.g., BRICS+ expansion, NATO decisions)
Diplomatic tensions between countries
These events influence:
Crude oil prices
Foreign exchange rates
FII flows (Foreign Institutional Investment)
Global demand-supply outlooks
2. US Macro Watch
This focuses on tracking economic developments in the United States, the world's largest economy. Key areas to watch include:
Inflation reports (CPI, PCE)
US Federal Reserve interest rate decisions
Jobs data (non-farm payrolls, unemployment rate)
Retail sales, housing starts
US GDP growth
U.S. debt levels and political decisions on trade/tariffs
Because the US dollar is the world's reserve currency, and because Wall Street often sets the tone for global markets, these macro signals directly affect India’s equity market, bond yields, and rupee valuation.
🧠 Why Does This Matter to Indian Traders & Investors?
You may ask—“Why should I care about some news in the U.S. or Europe when I’m only buying shares of Indian companies?”
Here’s the reality:
Over 50% of the daily movement in Indian indices like Nifty and Sensex is now influenced by global cues.
Foreign investors (FIIs), who own a huge portion of Indian stocks, take buy/sell decisions based on global trends, not just local stories.
US interest rates affect where FIIs want to put their money—if US bonds are yielding more, they might pull out of India.
Crude oil, which India imports heavily, is priced globally—if a war breaks out, oil shoots up and hits inflation in India.
In short: What happens outside India often decides how India trades.
🔥 Major Geopolitical Risks in 2025
Let’s look at some real-world developments that have been shaking or supporting markets this year:
1. Russia-Ukraine Conflict (Still Ongoing)
Even in 2025, the war isn’t over.
It affects wheat prices, natural gas, and military spending globally.
India has been balancing ties with both Russia and the West, but disruptions affect commodity markets, logistics, and inflation.
2. Middle East Tensions (Gaza, Iran, Red Sea Attacks)
Ongoing conflicts have kept crude oil prices elevated.
Shipping through the Suez Canal and Red Sea has become riskier, increasing global logistics costs.
This directly affects India’s import bill, trade deficit, and rupee stability.
3. US–China Trade Friction
The US has imposed tech restrictions on China; China is retaliating.
If tensions escalate further, it will impact the global supply chain, especially for semiconductors, electronics, and electric vehicles.
Indian tech companies (like TCS, Wipro) may see ripple effects due to changes in global outsourcing dynamics.
4. Taiwan Risk
Any Chinese military action on Taiwan could be catastrophic for markets, especially in electronics and semiconductors.
Since semiconductors power everything from phones to EVs, even a threat here affects stocks globally.
📊 Key US Macro Trends Impacting Markets in 2025
1. US Inflation is Cooling, But Not Gone
After peaking in 2022, inflation has come down, but in 2025, it’s still sticky.
That means the Federal Reserve (US central bank) is not cutting rates as aggressively as markets hoped.
➡️ When the Fed keeps rates high:
US bond yields rise
FIIs pull money out of emerging markets like India
Nifty and Sensex feel the pressure
2. US Job Market Is Strong
A robust job market signals continued economic expansion, good for global demand.
This is why metals, IT, and manufacturing stocks in India rally when US jobs data is good.
3. The Fed’s Interest Rate Policy
The biggest global event each month is the Fed meeting.
If they cut rates, stocks rally globally.
If they pause or raise rates, money flows into safe assets like gold or the US dollar—hurting Indian equities.
Real-Time Example: July 2025
In July 2025, Indian markets have been:
Rallying due to strong US jobs data and earnings
Cautious due to potential Trump-era tariffs on countries buying Russian oil
Watching closely for US inflation print and Fed meeting signals
GIFT Nifty shows bullish strength in pre-market hours when the US ends green. But we’ve also seen sell-offs on days of oil spikes or war-related news.
🧭 How to Track These Developments (Even If You’re Busy)
Here’s a simple checklist for staying informed:
✅ Every Morning
Check GIFT Nifty
Read major global headlines (US data, oil prices, geopolitics)
Note the USDINR trend
Watch India VIX
✅ Every Week
Look at US job reports, inflation (CPI), and Fed speeches
Follow crude oil and gold charts
Track FII/DII activity
Keep an eye on shipping, metals, and defense-related stocks
✅ Final Thoughts
"Geopolitical & US Macro Watch" is not just a fancy term—it's a crucial lens for today’s markets. The biggest stock market moves often come not from company news but from macroeconomic surprises or global tensions.
In 2025, being globally aware gives you an edge:
You’ll avoid panic on news-driven crashes
You’ll better understand why your portfolio is up or down
You’ll identify trade setups ahead of others
👉 Think global, act local—that’s the new mantra for smart Indian investors.
If you want daily or weekly updates summarizing these events and their impact on Indian markets, let me know—I’ll be happy to prepare a custom watchlist or dashboard for you
Earnings in Focus Companies in the Spotlight
Reliance Industries (RIL)
Reliance’s results are among the most awaited in the Indian market. It touches almost every Indian household through its telecom (Jio), retail, and oil-to-chemicals arms.
In Q1, analysts expected strong year-on-year growth in profit, partly helped by a one-time gain from a stake sale.
Retail and digital segments were projected to post steady growth.
Oil-to-chemicals margins were expected to remain stable due to global energy price stabilization.
Since Reliance has a significant weight in both Nifty and Sensex, even a 2–3% move can swing the broader indices.
JSW Steel
JSW Steel posted stronger-than-expected operating profits. The volume growth was robust and pricing held steady despite global uncertainties.
Steel performance is considered a proxy for infrastructure and housing demand.
Better margins mean improved profitability outlook, which often lifts peer stocks like Tata Steel and SAIL too.
Wipro
Wipro surprised the street with a better-than-expected net profit growth and steady revenue.
This came after a few muted quarters, giving confidence to IT investors.
The firm also secured some large deals, which improved guidance.
When a Tier-1 IT company beats expectations, it often leads to a short-term sector-wide rally.
Axis Bank
Axis Bank reported a small decline in net profit due to an increase in provisions and asset quality slippage.
Markets reacted negatively, with the stock dropping more than 5%.
This raised some concerns for the entire banking sector, especially around retail loan delinquencies.
Bank earnings are carefully tracked for signs of economic health since they’re the first to show stress in the system.
Hindustan Zinc
Despite a year-on-year drop in profit, Hindustan Zinc beat market expectations.
The metal segment held up well.
Higher cost efficiency offset pricing pressure.
It shows that even in commodity-heavy businesses, efficiency and scale can drive earnings resilience.
3. 📈 How Markets React During Earnings
Earnings are one of the biggest catalysts for short-term market movements. Here’s how different market participants respond:
Retail Traders: Look for quick intraday or swing opportunities based on the reaction to earnings.
Institutional Investors: Focus more on guidance, margin outlook, and strategic plans.
FIIs & DIIs: Use results to rebalance portfolios across sectors.
This week, markets opened flat with mixed sector movements. Financials remained under pressure due to Axis Bank, while energy and metals were relatively stronger.
4. 🎯 Trading Strategies During Earnings Season
🔹 Intraday Traders:
Monitor stock-specific results.
A strong beat often results in gap-up opens, followed by either a continuation rally or profit-booking.
Misses often result in sharp selling pressure.
🔹 Swing Traders:
Look for strong earnings + bullish technical setup for 3–5 day momentum trades.
Weak earnings can be played with bearish options like puts or bear spreads.
🔹 Investors:
Focus on long-term stories where earnings confirm improving fundamentals.
Use dips in strong businesses as buying opportunities.
5. 💼 Sectoral Trends from Current Earnings
✅ IT Sector:
Wipro’s good performance and deal wins have created optimism.
If the rest of the IT majors follow suit, it may indicate a bottom in the tech cycle.
✅ Metals:
JSW Steel’s strong numbers confirm ongoing industrial demand.
Infra push and China’s restocking are adding tailwinds to global metal prices.
❌ Financials:
Axis Bank’s weaker asset quality is a concern.
Market will now look toward HDFC Bank, SBI, and ICICI Bank to see if this is a one-off or an emerging trend.
⚖️ FMCG & Consumer:
Awaited earnings from major players like HUL, Dabur, and Nestlé will show how rural and urban consumption are shaping up.
Margin expansion through easing input costs will be closely monitored.
6. 📊 Impact on Broader Indices
Nifty:
Reliance alone has over 10% weight in the index. A positive surprise there can lift Nifty meaningfully.
IT and metals also have significant representation, so results from Wipro and JSW Steel are important.
Bank Nifty:
Axis Bank’s fall dragged the index.
A recovery depends on upcoming results from ICICI Bank and HDFC Bank.
Sector Indices:
Nifty Metal may outperform if positive surprises continue.
Nifty IT needs more broad-based strength to reverse the downtrend.
7. 🧠 What Smart Money Is Watching
Institutional investors are focusing on:
Guidance for the rest of FY25
Cost management: Are companies protecting or growing their margins?
Volume growth: Are revenues rising due to real demand or just price hikes?
Loan growth and credit quality: Especially in the banking space
These insights help long-term investors identify early winners and avoid laggards.
8. 🧾 Key Takeaways for Traders & Investors
Earnings are the strongest short-term trigger in markets.
Reliance results can tilt the entire Nifty one way or the other.
IT is stabilizing, Metals are strong, Financials are shaky—sector rotation is visible.
Stay stock- and sector-specific rather than going fully index-based during earnings season.
9. ✅ Final Words
“Earnings in Focus” isn’t just a headline—it’s the heartbeat of market sentiment right now.
In a market driven by uncertainty (inflation, interest rates, global slowdown), real numbers from real companies matter more than ever. This is the time when:
Traders can catch powerful moves based on short-term surprises
Investors can spot trends and leaders early
Portfolio rebalancing decisions can be guided by facts, not emotions
Whether you’re in for a quick trade or a long-term position, understanding earnings and their market impact is essential.
GIFT Nifty Signals Bullish Start🏛️ What is GIFT Nifty?
Let’s start with the basics.
GIFT Nifty is the new name for what used to be known as the SGX Nifty—a derivative contract that mirrors the Nifty 50, but is traded outside India.
It now runs on the GIFT City platform (Gujarat International Finance Tec-City).
It gives traders, especially foreign institutional investors (FIIs), the ability to trade in Nifty futures even before the Indian market opens.
Think of it as an early indicator of how the Nifty 50 might perform when the Indian market opens at 9:15 am.
✅ Important: GIFT Nifty is NOT a separate index.
It simply reflects the expected movement of the Nifty 50 index, based on global market cues and overnight developments.
🧠 Why Did SGX Nifty Become GIFT Nifty?
Until July 2023, the Nifty futures were traded on the Singapore Exchange (SGX).
But to bring more liquidity and volume back to Indian shores and to establish India as a global financial hub, the trading of Nifty derivatives was moved from Singapore to the GIFT IFSC platform.
Thus, SGX Nifty became GIFT Nifty.
📈 Why GIFT Nifty’s Morning Move Matters
Each morning, traders, analysts, media houses, and even retail investors check GIFT Nifty levels.
Why?
Because it acts as a directional clue. Here’s how:
If GIFT Nifty is up by 100 points, it’s a sign that Nifty 50 is likely to open higher.
If it’s down by 75 points, it hints at a gap-down opening.
It reflects the sentiment of global markets, overnight US cues, geopolitical risks, and FII mood.
📊 Example:
GIFT Nifty trading at 22,450 (up 80 points)
Yesterday’s Nifty close: 22,370
→ Bullish sign → Indian markets may open with a gap-up of 70–100 points.
📌 What Does “Bullish Start” Mean?
A bullish start means the market is expected to open on a positive note—meaning, the index (like Nifty or Sensex) may start the day higher than the previous day’s closing.
This can happen due to:
Strong global cues (e.g., Dow Jones, Nasdaq closing higher)
Positive FII activity
Good earnings announcements
Supportive macroeconomic data
Favorable government or budget policy
Cooling of global tensions or crude oil prices
So, when GIFT Nifty shows a positive movement before 9 am, traders call it a bullish pre-market setup.
🔍 Real-World Example – July 18, 2025
On July 18, 2025:
GIFT Nifty was up by 55 points, indicating a positive start.
This came after a volatile weekly expiry on Thursday.
Strong earnings expected from companies like Reliance, JSW Steel, L&T Finance added to positive sentiment.
US markets closed flat, but no major negative surprise.
FIIs were net sellers, but DIIs absorbed selling pressure.
→ All this combined gave a green signal from GIFT Nifty to the domestic market.
💼 How Traders Use GIFT Nifty in Strategy
✅ 1. Pre-Market Planning
GIFT Nifty gives early clues, so:
Intraday traders plan opening range setups
Option traders adjust straddles/strangles based on expected gap
F&O traders look at overnight position rollover
✅ 2. Risk Management
A weak GIFT Nifty warns of gap-downs due to global negativity.
This allows traders to:
Hedge long positions
Tighten stop-losses
Avoid aggressive morning trades
✅ 3. Sectoral Rotation
If GIFT Nifty is up, focus shifts to high-beta stocks like Bank Nifty, Reliance, Adani Group, etc.
If it's down, defensive plays like FMCG and Pharma may perform better.
🧮 How to Read GIFT Nifty Properly?
Here are 3 simple tips:
✔️ Tip 1: Compare with Previous Day’s Nifty Close
If GIFT Nifty > Last close → Gap-up expected
If GIFT Nifty < Last close → Gap-down likely
✔️ Tip 2: Watch Global Cues
Dow/Nasdaq closing + crude oil + USD/INR = impact GIFT Nifty
If all show strength, GIFT Nifty usually reacts positively
✔️ Tip 3: Use With FII/DII Data
Bullish GIFT Nifty + FII Buying = Strong setup
Bullish GIFT Nifty + FII Selling = Weak opening might reverse later
🌎 GIFT Nifty & Global Linkage
India is now deeply linked with:
US markets (Nasdaq, S&P 500)
Crude oil
Dollar Index
Global interest rate policies (Fed, ECB)
So if:
US markets crash overnight → GIFT Nifty reacts instantly
Crude oil falls sharply → Positive for India → GIFT Nifty turns green
📍 Important: GIFT Nifty Is Not Always Accurate
Sometimes GIFT Nifty shows bullish signs, but:
Domestic news (politics, budget) pulls market down
FII/DII data surprises post-opening
Index gaps up but then reverses during the day
That’s why traders use GIFT Nifty as a clue, not a guarantee
🚦 Final Thoughts – Why You Should Watch GIFT Nifty
GIFT Nifty is like the morning alarm for the market:
It tells you what’s likely to happen before the bell rings.
Gives you a head start to plan your trades.
Helps spot sectoral strength, F&O positioning, and market mood.
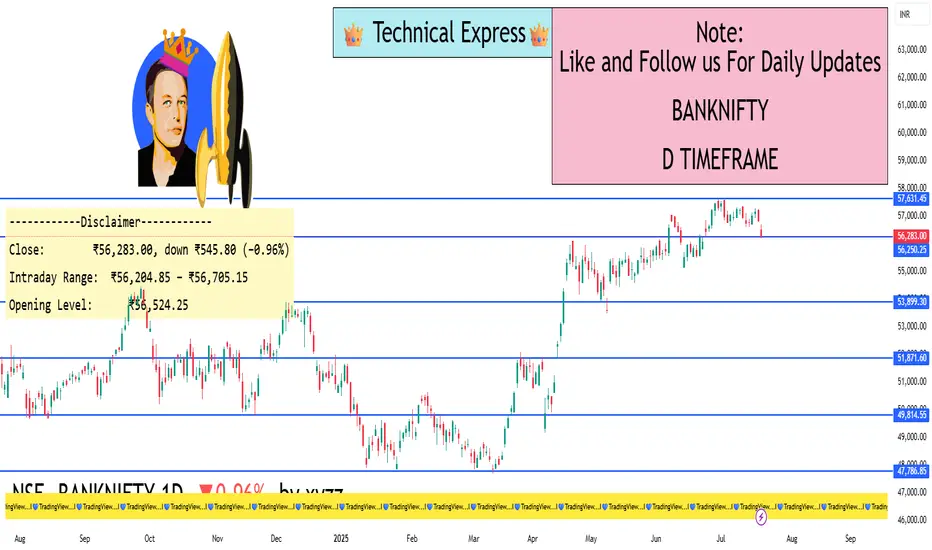
Bank Nifty – 1 Day Timeframe✅ Closing Summary:
Closing Price: ₹56,283.00
Change: −₹545.80 (−0.96%)
Opening Price: ₹56,524.25
Intraday High: ₹56,705.15
Intraday Low: ₹56,204.85
Bank Nifty showed broad weakness throughout the session, closing nearly 1% lower as major banking stocks came under pressure due to weak earnings and cautious sentiment in the financial sector.
🔍 Key Reasons for the Decline:
Earnings Pressure:
Axis Bank posted disappointing Q1 earnings, with higher non-performing assets and weaker loan growth.
This spooked investors, leading to sell-offs in other major banks like HDFC Bank, ICICI Bank, and Kotak Bank.
FIIs Turn Net Sellers:
Foreign Institutional Investors have been consistently selling financial stocks amid global uncertainty, which accelerated the downtrend.
Domestic buying was not strong enough to offset the outflows.
Global Economic Concerns:
Concerns about U.S. Fed interest rate hikes, inflation, and trade tensions globally made investors risk-averse.
Financials, being interest-rate sensitive, felt the brunt of the negative sentiment.
Technical Breakdown:
The index failed to hold above the crucial ₹56,500–₹56,700 range, which acted as a support in the previous few sessions.
This triggered technical selling and stop-loss hits.
📈 Technical Outlook (Short-Term):
Support Zone: ₹56,200 to ₹56,000
If this range is broken convincingly, the index could head toward ₹55,500.
Resistance Zone: ₹56,700 to ₹57,000
A move above this zone is needed for short-term recovery and renewed bullishness.
Indicators:
RSI (Relative Strength Index): Trending below 45, indicating growing bearish momentum.
MACD: Bearish crossover visible, confirming weakness.
Volume: Heavy selling pressure with above-average volumes shows institutional exit.
📆 Recent Trend Performance:
1-Day Return: −0.96%
1-Week Return: −1.12%
1-Month Return: +2.4%
6-Month Return: +14.8%
1-Year Return: +11.3%
Despite the day’s drop, medium- and long-term performance remains strong, backed by sector fundamentals and banking credit growth.
🧠 What Traders & Investors Should Know:
Intraday Traders: Can watch for bounce plays near the ₹56,200 zone, or short positions if ₹56,000 is broken with momentum.
Swing Traders: May wait for confirmation of reversal candles or bullish divergence in RSI before entering new long positions.
Long-Term Investors: Today’s fall could offer buy-on-dip opportunities, especially in quality private banks, provided fundamentals stay strong.
💬 Conclusion:
Bank Nifty faced strong bearish pressure in today’s session, largely due to disappointing bank earnings and negative institutional flows. With key support at ₹56,200 and resistance at ₹56,700–57,000, the next few days will be crucial to determine the short-term direction. If support holds, a technical bounce is possible. However, a breakdown below ₹56,000 could lead to deeper corrections
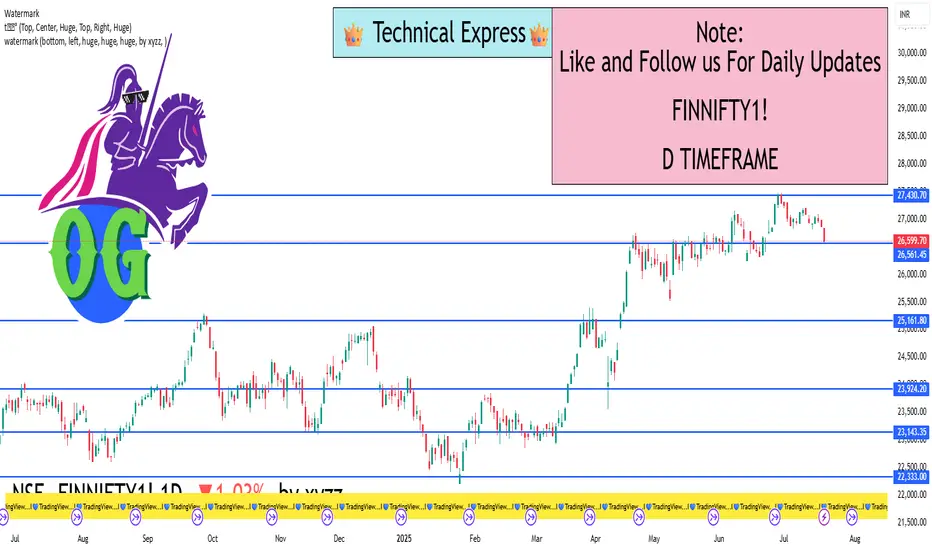
FinNifty – 1 Day Timeframe✅ Closing Summary:
Closing Price: ₹26,556.15
Change: −₹253.30 (−0.94%)
Opening Price: ₹26,809.45
Intraday High: ₹26,785.35
Intraday Low: ₹26,513.80
The FinNifty index saw a sharp drop today, primarily driven by weakness in key financial stocks and negative investor sentiment.
🔍 Key Reasons for the Decline:
Banking Sector Weakness:
One of the biggest drags was a major bank (e.g., Axis Bank) that reported weaker-than-expected quarterly earnings.
This led to panic selling in other banking and financial institutions as well.
Foreign Institutional Investors (FII) Selling:
Significant outflows from FIIs contributed to the negative sentiment.
Investors remained cautious ahead of upcoming major earnings reports and global cues.
Global Market Pressure:
Concerns about U.S. interest rate policies, inflation data, and global recessionary fears kept the broader financial market under pressure.
Psychological Level Break:
The index broke key psychological support around ₹26,600, triggering technical selling and increased volatility.
📈 Technical Outlook (Short-Term):
Support Zone: ₹26,500 to ₹26,400
This area provided some buying interest during the day, but a break below could open doors to ₹26,200 or lower.
Resistance Zone: ₹26,750 to ₹26,900
This region needs to be reclaimed for any positive momentum to sustain.
Momentum Indicators:
RSI (Relative Strength Index): Trending downward, approaching oversold conditions (~38–42).
MACD (Moving Average Convergence Divergence): Showing bearish crossover, confirming short-term weakness.
Volume: Above average during the sell-off, suggesting institutional participation in the decline.
📆 Recent Trend Performance:
1-Day Return: −0.94%
1-Week Return: −0.65%
1-Month Return: +1.35%
6-Month Return: +18.6%
1-Year Return: +13.4%
Despite the daily fall, the medium-to-long-term trend remains bullish, supported by overall strong fundamentals and earnings growth expectations.
🧠 What Traders & Investors Should Know:
Short-Term Traders: Should be cautious. Look for a bounce near the support zone for short-covering opportunities or fresh entries with tight stop-losses.
Swing Traders: May wait for confirmation of support holding at ₹26,500 before considering long trades.
Long-Term Investors: The decline could be seen as a healthy correction in an otherwise strong uptrend. Ideal for staggered buying in quality financial stocks.
💬 Conclusion:
FinNifty is currently experiencing short-term pressure due to earnings misses, global uncertainty, and FII outflows. However, its long-term chart remains constructive. Today’s 1-day candle represents a bearish move, but unless ₹26,400 breaks decisively, a recovery is possible in the coming sessions—especially if upcoming results from top banks like HDFC and ICICI meet or exceed expectations
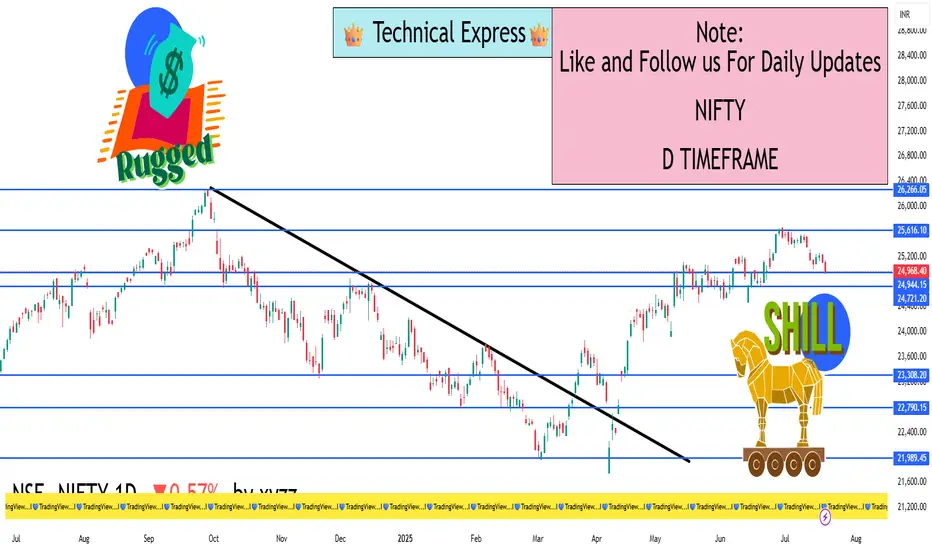
Nifty 50 – 1 Day Timeframe✅ Closing Summary:
Closing Price: ₹24,968.30
Change: −₹143.55 (−0.57%)
Opening Price: ₹25,108.55
Intraday High: ₹25,144.20
Intraday Low: ₹24,919.10
Nifty 50 traded in a narrow but bearish range throughout the session, losing nearly 0.6%, as market sentiment remained weak due to earnings pressure and global cues.
🔍 Key Reasons for the Decline:
Banking Sector Drag:
Major private sector banks like Axis Bank reported weaker-than-expected earnings, sparking a broad sell-off in financials.
Financial stocks make up a large portion of Nifty 50, pulling the entire index lower.
Cautious Investor Sentiment:
Global uncertainty regarding U.S. Federal Reserve interest rate decisions and economic slowdown concerns weighed on overall risk appetite.
Investors are also being cautious ahead of major Indian corporate earnings from companies like HDFC Bank, ICICI Bank, Reliance Industries, and others.
Foreign Institutional Selling (FII):
FIIs continued to sell Indian equities, especially large-cap financials and IT stocks.
This added selling pressure even as some domestic institutional investors tried to buy the dips.
Technical Weakness:
The index slipped below the 25,000 psychological support level, a sign of short-term technical weakness.
Intraday recoveries were capped near resistance, confirming the bearish tone.
📈 Technical Outlook (Short-Term):
Support Zone: ₹24,900 to ₹24,850
This is the next critical area. If broken, further decline toward ₹24,600 is likely.
Resistance Zone: ₹25,150 to ₹25,300
Bulls need to reclaim this zone for the trend to turn positive again.
Momentum Indicators:
RSI: Slipping below 45, showing weakening momentum.
MACD: Bearish crossover; trend remains under pressure.
Volume: Slightly above average, indicating serious selling interest at the top.
📆 Recent Trend Performance:
1-Day Return: −0.57%
1-Week Return: −0.35%
1-Month Return: +2.10%
6-Month Return: +12.8%
1-Year Return: +10.9%
Nifty 50 remains in a medium- to long-term uptrend, but short-term correction is underway, largely due to sector-specific drag and earnings volatility.
🧠 What Traders & Investors Should Know:
Day Traders: Watch for quick reversals near support at ₹24,900; consider shorting near resistance if recovery fails.
Swing Traders: Wait for either a bullish reversal candle or RSI bounce before entering fresh long positions.
Long-Term Investors: Despite the dip, the market remains healthy. This could be a buy-on-dip opportunity, especially in sectors like auto, pharma, and capital goods that are holding well.
💬 Conclusion:
Nifty 50 showed weakness on July 18 due to negative earnings surprises and bearish sentiment in financials. While technical indicators suggest short-term downside pressure, the broader long-term trend remains intact. Key support at ₹24,900 is crucial. A bounce from that zone can trigger a recovery, but a sustained break below it could accelerate the decline
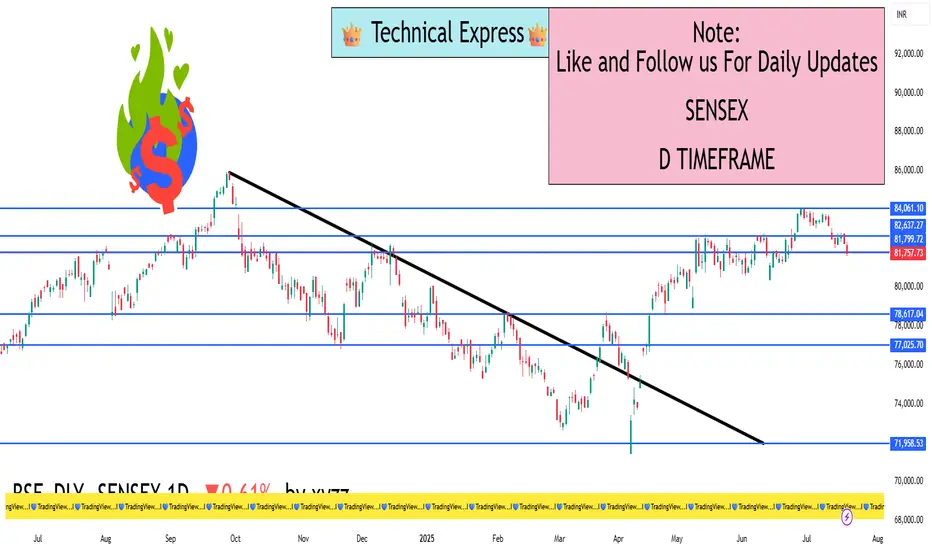
Sensex – 1 Day Timeframe✅ Closing Summary:
Closing Price: ₹82,540.65
Change: −₹501.34 (−0.60%)
Opening Price: ₹83,081.80
Intraday High: ₹83,114.95
Intraday Low: ₹82,488.25
The Sensex fell over 500 points, reflecting broad-based selling across banking, IT, and financial services. The index struggled to hold gains and faced resistance at higher levels throughout the day.
🔍 Key Reasons for the Decline:
Weak Earnings from Financials:
Axis Bank and other financial stocks reported disappointing quarterly results.
As financial stocks hold significant weight in the Sensex, this created negative sentiment across the board.
IT and Tech Sector Pressure:
Global uncertainty, U.S. Fed rate concerns, and weak guidance from global tech firms contributed to a fall in Indian IT stocks like Infosys and TCS, dragging the index.
Foreign Institutional Investor (FII) Selling:
FIIs were net sellers in July, putting pressure on large-cap blue-chip stocks.
Persistent outflows created downward pressure on the index despite support from domestic institutional buyers.
Global Market Cues:
Mixed global signals, rising oil prices, and uncertain interest rate outlooks kept risk sentiment subdued.
Caution ahead of major global economic data further prevented buying enthusiasm.
📈 Technical Outlook (Short-Term):
Support Zone: ₹82,300 to ₹82,000
This is a key demand zone. A breakdown below could lead to further downside towards ₹81,500.
Resistance Zone: ₹83,150 to ₹83,500
Any bounce-back will face selling near this region unless backed by strong buying volume.
Indicators:
RSI: Dropped below 45, indicating weakening strength.
MACD: Shows a bearish crossover, confirming short-term negative momentum.
Volume: Heavier than average, signaling increased institutional activity on the sell side.
📆 Recent Trend Performance:
1-Day Return: −0.60%
1-Week Return: −0.45%
1-Month Return: +1.85%
6-Month Return: +12.3%
1-Year Return: +11.7%
The index remains strong over the long term, but the short-term chart reflects a corrective phase amid sectoral weakness.
🧠 What Traders & Investors Should Know:
Short-Term Traders: Monitor the 82,300 level for signs of bounce or breakdown. Potential intraday setups are forming, but caution is advised.
Swing Traders: Wait for a confirmation candle—like a bullish engulfing or hammer—near the support before entering long positions.
Long-Term Investors: This correction may offer a healthy buy-on-dip opportunity, particularly in stocks with strong fundamentals in auto, capital goods, and FMCG sectors.
💬 Conclusion:
The Sensex declined nearly 0.60% due to earnings pressure from major financials and global uncertainty impacting IT and large-cap stocks. While the market sentiment remains weak in the short term, the long-term uptrend is still intact. Key support around ₹82,300 will determine the near-term direction. If held, a rebound may follow next week, especially if major earnings turn out better than expected.
Bitcoin (BTC/USD) – 1D Timeframe✅ Closing Summary:
Closing Price: ~$119,138 USD
Change: +$836 (+0.7%)
Opening Price: ~$118,302
Intraday High: ~$120,714
Intraday Low: ~$117,715
Bitcoin continued to show resilience by holding above the crucial $118,000 support level, despite facing overhead resistance near its previous high. The price action reflects bullish consolidation following recent surges above $120,000.
🔍 Key Reasons Behind the Price Action:
Institutional Demand Strengthening:
Bitcoin ETFs in the U.S. are witnessing rising inflows.
Hedge funds and family offices are seen increasing allocations, especially as digital assets gain legitimacy post-regulation discussions.
Regulatory Momentum:
U.S. Congress is pushing clearer frameworks around crypto taxation and stablecoins.
Global regulatory certainty (from EU & Japan) boosts confidence among investors and traders.
Weakening U.S. Dollar Index (DXY):
The DXY declined slightly, indirectly aiding BTC’s upward momentum.
Bitcoin remains a favored alternative store of value during fiat uncertainty.
Limited Miner Selling:
On-chain data shows a decline in miner distribution, meaning less sell-side pressure.
Miners seem optimistic about long-term prices and are holding reserves.
📈 Technical Outlook (Short-Term):
Support Zone: $117,500 to $118,000
Price found strong buyers in this range. It’s crucial that Bitcoin holds this level to maintain bullish structure.
Resistance Zone: $120,700 to $122,500
Previous highs around $122K serve as the next resistance. A daily candle close above this may trigger momentum buying.
Indicators:
RSI (Relative Strength Index): ~62 (bullish but not overbought)
MACD: Bullish crossover confirmed
Volume: Moderate, but above 20-day average
📆 Recent Trend Performance:
1-Day Return: +0.7%
1-Week Return: +2.1%
1-Month Return: +12.8%
3-Month Return: +35.4%
YTD Return: +61.2%
Bitcoin continues to outperform traditional asset classes, showing strong long-term growth despite short-term volatility.
🧠 What Traders & Investors Should Know:
Short-Term Traders: Consider range trading between $118K–$122K. Breakout above $122K may signal fresh upside potential.
Swing Traders: Watch for bullish continuation patterns (bull flags or cup-and-handle). Enter long if price closes above $121.5K on high volume.
Long-Term Investors: Accumulation at current levels could be ideal before the next halving cycle and broader adoption via ETFs and institutions.
🛠️ Chart Behavior and Candlestick Analysis:
Candle Type: Bullish candle with long lower wick, indicating buying pressure near support.
Pattern: Minor flag formation with potential breakout above $121K on next daily move.
🧭 Macro-Level Catalysts to Watch:
U.S. Bitcoin ETF weekly flows (Friday updates)
Fed interest rate guidance (next FOMC meeting)
Crypto regulation developments in U.S., EU, and APAC
On-chain metrics: exchange inflow/outflow, whale accumulation
💬 Conclusion:
BTC/USD is showing solid structure in the 1D chart. With strong institutional demand, improving global regulation, and technical support holding, Bitcoin is in a healthy uptrend. The short-term outlook remains bullish as long as BTC holds above $118K. A breakout above $122K could fuel the next leg towards $125,000–$130,000.

LEARN INSTITUTIONAL TRADING✅ What is Institutional Trading?
Institutional trading focuses on understanding how big money flows in the market. Institutions trade in huge quantities, and their strategies revolve around manipulating prices to collect liquidity, triggering stop-losses, and creating false breakouts. Retail traders often lose money because they follow trends without understanding the market structure set by these institutions.
✅ What You Will Learn in Institutional Trading
1. Smart Money Concepts (SMC):
Learn how smart money (institutions) traps retail traders using fake breakouts, stop hunts, and liquidity grabs.
2. Market Structure:
Higher Highs (HH), Higher Lows (HL), Lower Highs (LH), Lower Lows (LL)
Break of Structure (BOS) and Change of Character (CHOCH)
This helps you predict market direction with logic, not emotions.
3. Order Blocks:
These are zones where institutions place large orders. You’ll learn how to identify them and trade with the big players.
4. Liquidity Pools:
Find out where stop-losses and pending orders are sitting in the market so you can trade smartly by targeting liquidity zones.
5. Entry & Exit Strategies:
Master high-probability entry techniques and learn proper risk management like institutional traders.
✅ Why Learn Institutional Trading?
Retail Trading Institutional Trading
Random entries Planned entries based on logic
Easily manipulated Trades follow the footprint of big players
Low win rate Higher win rate with patience
Emotional trading Rule-based, stress-free trading
✅ Benefits of Mastering Institutional Trading
🎯 Accurate Trades – Follow the market makers.
💸 Better Risk-Reward – Small stop-loss, bigger targets.
⏰ Trade Less, Earn More – No overtrading, only quality setups.
🧠 No Indicators Needed – Pure price action and market reading.
✅ Who Can Learn Institutional Trading?
✅ Beginners who want to start right.
✅ Retail traders who keep losing.
✅ Part-time traders looking for consistency.
✅ Anyone serious about becoming a profitable trader.
✅ Final Words:
Institutional trading teaches you how to trade with the smart money instead of against it. Once you master these strategies, you will understand market moves like a professional and make more consistent profits

Technical Class✅ What You Learn in a Technical Class
1. Introduction to Technical Analysis
What is price action?
Difference between Technical and Fundamental Analysis
Basics of Candlestick Charts
2. Candlestick Patterns
Bullish and Bearish Patterns
Reversal Patterns (Doji, Hammer, Shooting Star)
Continuation Patterns (Flags, Pennants)
3. Chart Patterns
Double Top, Double Bottom
Head and Shoulders
Triangles (Ascending, Descending)
4. Indicators and Oscillators
Moving Averages (MA, EMA)
RSI (Relative Strength Index)
MACD (Moving Average Convergence Divergence)
Bollinger Bands
5. Support and Resistance
How to Identify Strong Support Zones
How to Use Resistance Levels for Entries/Exits
6. Trend Analysis
How to Spot a Trend (Uptrend, Downtrend, Sideways)
Trendlines and Channels
Breakouts and Fakeouts
7. Volume Analysis
Importance of Volume in Confirming Moves
Volume Spikes and Market Reversals
8. Risk Management
How to Protect Your Capital
Stop Loss and Take Profit Strategies
Risk-Reward Ratio
✅ Who Should Attend a Technical Class?
✅ Stock Market Beginners
✅ Intraday Traders
✅ Swing Traders
✅ Option Traders
✅ Anyone who wants practical market knowledge
