Institutional Option Trading, Investing, and TradingInstitutional trading and investing significantly differ from retail activities. Institutions trade in large volumes, use complex strategies, and have access to exclusive information and tools. This guide will provide a comprehensive overview of institutional option trading, investing, and general trading practices, detailing their methodologies, tools, and market impacts.
Understanding Institutional Investors
Institutional investors include mutual funds, hedge funds, pension funds, insurance companies, and large banks. These entities manage vast sums of money, often on behalf of others, and possess substantial market influence.
Key Characteristics:
Large Capital Base: Institutions trade in millions or billions.
Market Influence: Their trades can impact prices significantly.
Professional Resources: Access to cutting-edge research, proprietary algorithms, and high-speed trading platforms.
Forex

Gold at Make-or-Break Zone – Will Sellers Strike Back?Gold is staging a rebound, but don't let it fool you — the real battle is just ahead.
After last week's sharp drop, the price is now approaching a key resistance near 3,355, where the 34 and 89 EMAs meet a supply zone. This is not just any level — it's the perfect spot for sellers to step in.
Meanwhile, markets are bracing for high-impact US data this week, including Core PCE and Q1 GDP. If inflation runs hot, it could crush gold’s momentum and fuel another leg down.
If rejection happens here, gold could drop back toward the 3,265 zone. Bulls need a breakout to regain control — but right now, the edge leans bearish.
Are you ready for the next move?

EUR/USD Stuck in a Box – Breakout or Breakdown Ahead?EUR/USD is currently moving sideways within a narrow range around 1.1700–1.1750, as traders await key economic data from both the US and the Eurozone. The chart reflects a consolidation phase, with repeated resistance tests but no clear breakout yet.
This week, the euro remains under pressure after the ECB delivered a more dovish tone than expected, reinforcing the view that interest rates in the euro area may stay unchanged for longer. Although inflation data has stabilized, the euro’s recovery momentum has stalled.
Looking ahead, EUR/USD must break above the 1.1740 resistance zone to resume its longer-term bullish trend. Otherwise, the bearish pullback scenario, as outlined in the chart, could come into play.
What’s your take — will we see a breakout, or is a correction coming first? 📉📈
Share your view in the comments!

Update the latest gold price todayGold kicks off the new week with a sharp drop, sliding to around $3,258/oz, down more than $14 from Friday’s close. The primary driver behind this decline is the easing geopolitical tension in the Middle East, following a ceasefire agreement between Israel and Iran, which has significantly reduced demand for safe-haven assets.
In addition, stubborn inflation and weak global growth are forcing central banks — especially the Federal Reserve — to keep interest rates elevated for longer. This policy stance continues to pressure gold prices.
From my perspective, gold had surged too quickly in recent weeks due to geopolitical risks. Now that those tensions have calmed, capital is flowing out of gold and rotating into risk-on assets like stocks, bonds, and real estate.
Looking ahead, this week brings a wave of high-impact economic data from the US, Eurozone, China, and Japan — including the June PMIs from the US and China, and preliminary CPI from the Eurozone. These releases are likely to shape gold’s short-term direction.
For now, the bearish bias remains, with $3,300 acting as a key resistance level to watch.

Gold Weekly Analysis: Breaking Down After 3300 Support FailureCurrent Market Structure:
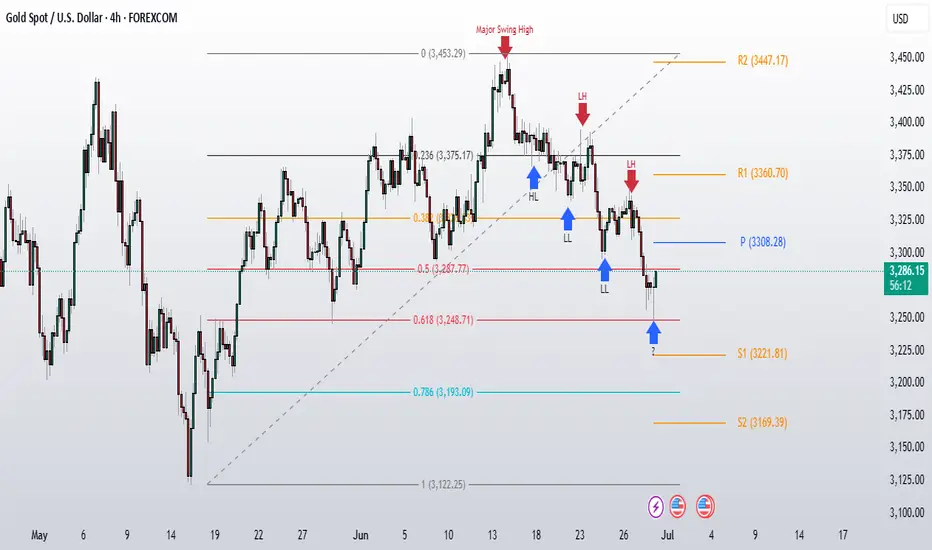
Gold breakdown below critical 3300 support level last Friday, and more importantly, we closed the week below this key psychological level. This breakdown has shifted the technical structure, and we're now seeing a clear pattern of lower highs (LH) and lower lows (LL) developing as gold enters a downside correction phase.
The weekly pivot has dropped to 3308, showing a descending formation compared to last week's pivot at 3386. This descending pivot structure confirms the bearish momentum that's been building.
Level to Watch:
3308 Weekly Pivot - This is our key reversal level for this week. For any meaningful bullish recovery, we need to see:
1. A convincing breakout above 3308 on higher timeframes
2. Price sustaining above this level
3. Breaking the current LH/LL bearish structure
Without these conditions being met, any rallies should be treated as counter-trend bounces rather than genuine reversals.
Support Zones:
Immediate Support: 3248-3287 (Fibonacci Golden Zone)
This is our primary support area to watch. It's a confluence zone that could provide a decent bounce opportunity if we get there.
Deeper Support Levels:
- 3221Weekly S1 support
- 3200 Major psychological level
If the golden zone fails to hold and we see a breakdown there, these lower levels become our next areas of interest.
The bears are in control of the weekly structure right now. Any recovery attempts need to prove themselves by reclaiming 3308 and holding it on higher timeframes. Until then, we're in correction mode with Fibonacci support levels as our key support area.
30/06: WILL WE SEE A RECOVERY ON THE LAST DAY OF THE MONTH? GOLD PLAN – 30/06: WILL WE SEE A RECOVERY ON THE LAST DAY OF THE MONTH? ☄️
✅ Macro Context – Focus on USD Debt and Political Pressure
As June comes to a close, the US faces a major $6 trillion debt maturity from COVID-era borrowings, creating potential stress on USD liquidity and overall market sentiment.
Gold saw a sharp dip to the 32xx range during the Asian session but has bounced back and is currently hovering near last week's closing levels.
While the medium-term outlook remains bearish, short-term signals are showing signs of a potential recovery.
✅ Political Catalyst:
Trump’s Pressure on Fed: Trump is pushing the Federal Reserve to cut interest rates to 1%-2%, saying he won’t appoint anyone unwilling to ease monetary policy.
This has sparked expectations for potential rate cuts, which could provide support for gold prices in the near term.
✅ Technical Outlook – Multi-timeframe Structure
Gold continues its downward correction on higher timeframes. However, short-term candles are indicating recovery momentum, with buying activity near the 327x zone.
Today's Strategy: Focus on short-term BUY setups that align with the recovery wave.
✔️ Key Resistance & Support Levels
🔺 Resistance: 3283 – 3291 – 3301 – 3322
🔻 Support: 3277 – 3271 – 3259 – 3247
🔖 Trade Scenarios
✅ Buy Scalping
🔺 Entry: 3272 – 3274
🔹 SL: 3268
✔️ TP: 3282 → 3288 → 3298
✅ Buy Zone
🔺 Entry: 3249 – 3251
🔹 SL: 3244
✔️ TP: 3265 → 3282 → 3295 → 3310
💠 Sell Scalping
🔺 Entry: 3298 – 3300
🔹 SL: 3304
✔️ TP: 3292 → 3282 → 3270
💠 Sell Zone
🔺 Entry: 3327 – 3329
🔹 SL: 3333
✔️ TP: 3322 → 3310 → 3298 → 3282
⚡️ Final Note
As we near the end of the month, expect possible volatility due to USD flows and institutional rebalancing, which could create further opportunities in the gold market.

XAUUSD – Bearish Momentum Builds Amid Risk-On MoodGold continues to trade within a clearly defined descending channel, forming lower highs and leaving several Fair Value Gaps unfilled. After rebounding from the 3,238 USD support, price is now approaching key resistance near 3,297 USD — aligning with the main descending trendline.
If price fails to break above this resistance, a drop back toward the 3,238 USD support is likely, with a deeper target around 3,200 USD at the lower boundary of the channel.
Fundamentals currently support the bearish bias: improving US–China trade relations and rare earth agreements have triggered “risk-on” sentiment, pulling capital away from gold. Meanwhile, strong USD momentum is driven by robust Core PCE data and the Fed’s hawkish stance, showing no rush to cut rates.
Strategy outlook: Watch for price reaction at 3,297 USD. If bearish rejection occurs, short setups toward 3,238 USD and below could be considered.

Gold in Free Fall – Is This Just the Beginning?Hey fellow traders!
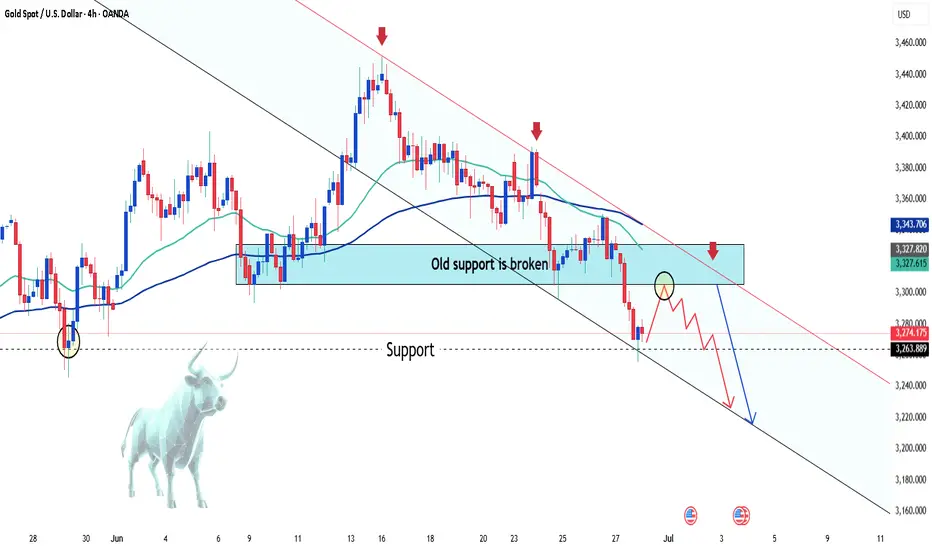
Today, gold is taking a serious dive — price has crashed below the critical $3,300 support, and things aren't looking great for the bulls. The chart says it all: the old support zone has been wiped out, and the recent minor bounce? Just the calm before a deeper selloff.
💣 What’s dragging gold down?
-The reasons are crystal clear:
-US Treasury yields are spiking, pulling capital away from gold.
-The US dollar is rebounding strongly, boosted by hawkish Fed commentary.
Global markets are optimistic, with geopolitical tensions easing — which means gold is losing its safe-haven appeal.
In short: there's not much left to keep gold afloat right now.
📉 Technical outlook – Breaking down and breaking lower?
On the H4 chart, gold has officially lost the EMA 34 (~$3,322) — a key dynamic support that's held multiple times in the past. With that breach, sellers rushed in. Price is now sliding toward the bottom of the descending channel, targeting $3,240, and possibly $3,200 if bearish momentum continues.
And if gold pulls back to retest the broken zone? Don’t celebrate too soon — it could be the perfect trap for sellers to reload.
So, what’s your take?
EURUSD – Bearish Pressure Resumes After Rejection at 1.17500EURUSD has rejected the 1.17500 resistance zone and is now forming lower highs on the H4 chart, signaling weakening bullish momentum within the ascending channel.
Stronger-than-expected Core PCE data from the US reinforces the Fed’s cautious stance, keeping the USD strong. Meanwhile, political rumors about Trump potentially replacing Powell have triggered market volatility but still support the dollar in the short term.
As long as price fails to break above 1.17500, EURUSD is likely to decline toward the 1.15900 zone. A bullish scenario would only be validated if price closes above 1.1760.
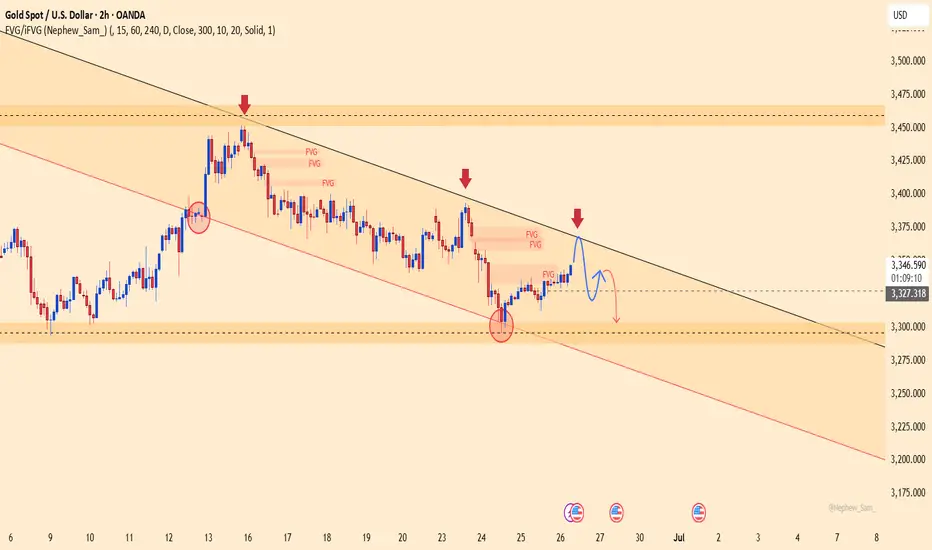
XAUUSD – Bearish Pressure Intensifies, New Lows in SightGold remains firmly within a well-defined descending channel, consistently forming lower highs and lower lows. After a breakout of the minor channel, price appears to be pulling back toward the 3,300 zone before potentially resuming its downtrend.
The temporary ceasefire between Iran and Israel and the US–China rare earth trade deal have dampened safe-haven demand, with capital rotating back into equities. At the same time, stable core PCE data supports the USD, adding further pressure on gold.
If price fails to hold above the 3,260 area, the next target lies near 3,218.

Gold at Crucial 325x Support – What's Next for the Yellow Metal?XAUUSD D1 Forecast: Gold at Crucial 325x Support – What's Next for the Yellow Metal?
Namaste, fellow traders!
Today, let's zoom out and look at the bigger picture for Gold (XAUUSD) on the Daily (D1) timeframe. Our analysis indicates that Gold has hit a very strong, hard support level around the 325x region. This is a pivotal point that could dictate Gold's medium to long-term direction!
🌍 Macroeconomic Context: The Forces at Play for Gold
While we've seen some USD weakness due to speculations surrounding the Fed (like the rumors about replacing Powell) and expectations of rate cuts, these factors haven't completely prevented Gold's recent decline on the daily chart. Also, the sustained ceasefire between Israel and Iran is reducing Gold's safe-haven appeal.
However, the current price action at the robust 325x support level is a significant technical signal. The influence of upcoming US macroeconomic data (especially the PCE Index on Friday) and speeches from FOMC members will be crucial in confirming or negating Gold's next moves. If positive news for Gold aligns with this support holding, it could act as a strong catalyst.
📊 XAUUSD Technical Analysis (D1): Predicting Gold's Next Move
Based on the fact that Gold has encountered strong support at 325x, we can anticipate the following scenarios:
Bounce from 325x (Potential Upside Phase):
If the 325x area (which reinforces the 3264.400 support from image_e9d325.png) holds firm, we expect a strong reaction and an upward move for Gold.
The initial target for this bounce would be the 332x region, which aligns with resistance levels 3313.737 - 3330.483 from our previous analysis. On a broader timeframe (as shown in image_83845c.png), this corresponds to the resistance zone around 3326.022. This 332x area could represent a continuation pattern, meaning it might be a corrective rise before the resumption of the larger trend.
Resumption of Downtrend (After Reaching 332x):
Once Gold reaches and tests the 332x zone (3313.737 - 3330.483 / 3326.022) and shows bearish confirmation signals (e.g., a strong bearish engulfing candle, a pin bar, or a clear top formation), we anticipate a resumption of the downward movement.
The next major target for this fall would be the 317x area, which correlates well with the strong support at 3173.052 on the larger timeframe (as depicted in image_83845c.png).
🎯 XAUUSD D1 Trading Plan: Your Long-Term Strategy Ahead!
Considering the current D1 analysis, here's our actionable plan:
1. BUY PHASE (Bounce from Support):
Entry: Observe price reaction in the 325x - 326x zone (especially 3264.400). Only buy if there are clear bullish confirmations (e.g., a confirmed bullish pattern on the daily or 4-hour candle, a strong bounce from the zone with volume).
SL: Just below the 325x support zone (e.g., 3245-3240, depending on confirmation).
TP: 3280 - 3290 - 3300 - 3313.737 - 3326.022 (key 332x zone). This will be our primary target for the bounce.
2. SELL PHASE (Downtrend Resumption):
Entry: After the price reaches the 332x zone (3313.737 - 3330.483 / 3326.022) and shows bearish confirmation signals (e.g., strong bearish engulfing, pin bar, or top formation).
SL: Slightly above the 332x zone (e.g., 3335-3340).
TP: 3300 - 3290 - 3280 - 3270 - 3260 - 3250 - 3200 - 3173.052 (final 317x target).

XAUUSD – Bull Trap Revealed, Drop Toward 3,304 Incoming?Gold is retesting the descending trendline around 3,366, but rejection signals are starting to emerge. The recent bounce only tapped into a Fair Value Gap – a hidden liquidity zone – and is now losing momentum.
The structure remains bearish with lower highs, and the downtrend channel continues to dominate price action. If 3,366 gets rejected again, a sharp move toward 3,304 could be triggered – or even lower.
Fresh news supports the bearish case:
U.S. jobless claims beat expectations → USD strengthens
Iran–Israel ceasefire → Gold loses safe-haven appeal
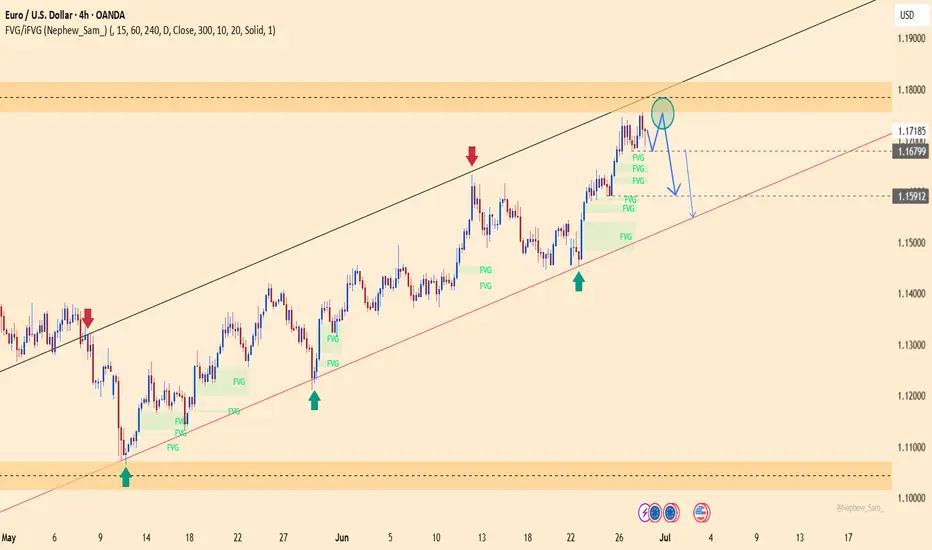
EURUSD Bulls in Charge – Can They Push Higher?EURUSD continues to demonstrate strength, maintaining a clear uptrend on the H4 timeframe. After breaking above the former resistance zone near 1.1600, price surged and is now consolidating around 1.1706. This breakout confirms strong bullish momentum, especially following a long period of consolidation.
That said, the area around 1.1730–1.1740 is showing signs of minor rejection, with a potential double-top pattern emerging. However, this appears to be a healthy pullback within the broader bullish trend.
The most reliable support is currently found at 1.1620, which also aligns with the EMA 34 — a dynamic level that has acted as a pivot throughout this rally.
As long as price remains above 1.1620, the bullish trend remains firmly intact.

Gold Pullback in Play – Will $3,300 Be Hit Today?Hello traders!
What’s your take on gold today?
OANDA:XAUUSD remains tilted to the downside, currently trading around $3,318, down over 100 pips on the day.
The bearish bias is still favored — and the reason is pretty clear. For short-term traders using pattern-based setups, gold has broken out of a flag pattern and successfully retested the breakout zone, confirming a potential reversal.
If this momentum holds, the next target could be $3,300 by the end of the day.
Do you agree with this scenario?

XAUUSD: Gold's Golden Glow Fades Below $3350 XAUUSD: Gold's Golden Glow Fades Below $3350 – Navigating Key Levels Amidst USD Weakness!
Let's dive into the fascinating world of Gold (XAUUSD) today. The yellow metal is showing subtle positive movement, primarily influenced by a weaker US Dollar, but a convincing bullish breakout above the $3350 mark remains elusive.
🌍 Macroeconomic Snapshot: USD's Woes & Gold's Mild Support
Gold has seen a slight positive bias for the second consecutive day, yet it's struggling to find significant follow-through, staying below the $3350 level in early European trading.
USD Under Pressure: Reports indicating that US President Donald Trump is considering replacing Fed Governor Jerome Powell have sparked concerns regarding the future independence of the US central bank.
Cautious Outlook: This mixed bag of news calls for caution before confirming a definitive bottom for Gold or positioning for a substantial recovery from levels below $3300 (or Tuesday's two-week low). Traders are currently focused on upcoming US macroeconomic data and speeches from FOMC members, which could influence XAU/USD ahead of Friday's crucial US Personal Consumption Expenditures (PCE) Price Index release.
📊 XAUUSD Technical Analysis & Intraday Trading Plan:
Current Trend: Gold has recently experienced a sharp decline and is now in a consolidation phase, trading around the $329X mark. Price is currently below shorter-term moving averages, indicating lingering bearish pressure or an accumulation phase.
Key Levels Identified:
Strong Support Zones (Potential BUY Areas): Levels around 3294.414, 3276.122, and particularly 3264.400 are crucial demand areas.
Key Resistance Zones (Potential SELL Areas): Levels at 3313.737, 3321.466, 3330.483, and 3341.947 are identified as significant supply zones.
🎯 XAUUSD Trading Plan (Based on your specified levels):
BUY ZONE (Strong Support - Long-Term Bias):
Entry: 3266 - 3264
SL: 3270
TP: 3280 - 3284 - 3290 - 3295 - 3300 - 3305 - 3310 - 3320
BUY SCALP (Quick Buy at Intermediate Support):
Entry: 3284 - 3282
SL: 3278
TP: 3288 - 3292 - 3296 - 3300 - 3305 - 3310 - 3320 - 3330
SELL ZONE (Key Resistance):
Entry: 3331 - 3333
SL: 3337
TP: 3326 - 3320 - 3316 - 3310 - 3305 - 3300
SELL SCALP (Quick Sell at Near Resistance):
Entry: 3313 - 3315
SL: 3320
TP: 3310 - 3305 - 3300 - 3295 - 3290 - 3280
⚠️ Key Factors to Monitor Closely:
US Macro Data: The upcoming US Personal Consumption Expenditures (PCE) Price Index on Friday is critical.
FOMC Member Speeches: Any comments on monetary policy or inflation outlook will directly impact USD and Gold.
Geopolitical Stability: Developments regarding the Israel-Iran ceasefire can influence safe-haven demand.

EURUSD Breaks Free – Is the Rally Just Beginning?After several days of bearish expectations, EURUSD has finally regained its bullish momentum. The pair surged sharply, breaking out of the descending channel and climbing from 1.146 to 1.162 at the time of writing.
The current resistance zone is being tested, yet buyers remain supported by strong technical factors, notably the stability of EMA 34 and 89.
On the fundamental side, expectations that the Fed will keep interest rates steady—reinforced by dovish remarks from Chair Powell before Congress—alongside a weakening USD due to easing geopolitical tensions and reduced euro-hedging by European funds, have fueled fresh demand for the euro.
What about you—do you think EURUSD will continue to rise or pull back from here?

Institutional Option Trading Part -3Institutional Investment Process
Setting Objectives: Determining risk tolerance, return targets, and time horizons.
Asset Allocation: Dividing the portfolio among different asset classes.
Security Selection: Choosing individual investments.
Portfolio Monitoring: Continuously reviewing performance and risk.
Institutional Trading
Institutional trading refers to the buying and selling of securities in large volumes by institutions.
Types of Institutional Traders
Proprietary Traders: Trade with the institution's own money.
Agency Traders: Execute trades on behalf of clients.
Program Traders: Use algorithms to trade baskets of stocks.
Trading Venues
Exchanges: NYSE, NASDAQ, etc.
Dark Pools: Private exchanges for large orders.
Over-the-Counter (OTC): Direct trading without an exchange.

Institutional Option Trading Part -10Investment Strategies
Active Management: Constantly buying and selling assets to outperform benchmarks.
Passive Management: Tracking indices like the S&P 500 to match market performance.
Value Investing: Identifying undervalued stocks.
Growth Investing: Focusing on companies with high growth potential.
Quantitative Investing: Using mathematical models to guide investment decisions.
Risk Management
Diversification: Spreading investments across various sectors and assets.
Hedging: Using derivatives to offset risks.
Liquidity Management: Ensuring enough cash to meet obligations.
Regulatory Compliance: Adhering to financial regulations.

Institutional Option Trading Part -2Disadvantages
Regulatory scrutiny.
Complexity and need for highly skilled traders.
Potential market impact.
Institutional Investing
Institutional investing is the process of managing large-scale investment portfolios with long-term goals.
Investment Objectives
Capital Preservation: Maintaining the value of assets.
Capital Appreciation: Growing the portfolio over time.
Income Generation: Providing steady returns through dividends or interest.
Asset Classes Used
Equities: Shares of publicly traded companies.
Fixed Income: Bonds and other debt instruments.
Real Estate: Direct investments or REITs.
Commodities: Such as gold, oil, or agricultural products.
Derivatives: Options, futures, and swaps.

Institutional Option Trading Part -4Common Institutional Option Strategies
Covered Call Writing: Selling call options against stock holdings to generate income.
Protective Puts: Buying puts to insure portfolios against downside risk.
Spreads (Vertical, Horizontal, Diagonal): Limiting risk while aiming for a defined profit range.
Straddles and Strangles: Betting on volatility, regardless of market direction.
Iron Condors: Selling out-of-the-money calls and puts to profit from low volatility.
Tools and Platforms
Order Management Systems (OMS): To handle complex orders efficiently.
Execution Management Systems (EMS): For rapid and algorithmic order execution.
Advanced Analytical Software: For options pricing, risk assessment, and scenario analysis.
Advantages of Institutional Option Trading
Ability to execute large trades without significant slippage.
Access to lower fees due to trade volume.
Enhanced risk management capabilities.

Institutional Option Trading Part -5Institutional Option Trading
Institutional option trading involves using options as part of sophisticated strategies to hedge risk, enhance returns, or speculate.
Objectives of Institutional Option Trading
Hedging: Protecting large portfolios against market downturns.
Income Generation: Selling options to collect premiums.
Speculation: Taking directional bets with options.
Arbitrage: Exploiting price inefficiencies across markets.

EURUSD – Short-term pullback before potential recoveryOn June 21, EURUSD edged down 0.12% to close at 1.15222 following mixed PMI data from the Eurozone. The H4 chart shows that price remains within the main ascending channel, forming a lower high around 1.16300 — a signal of a short-term corrective phase.
Currently, EURUSD is consolidating sideways near an unfilled Fair Value Gap (FVG) resistance zone. If price fails to break above this level, a short-term drop toward the ascending channel support at 1.14860 is likely, before a potential rebound toward 1.15860 and possibly 1.16300.
Short-term strategy: Watch price action near the trendline support. If clear bullish rejection appears, this could offer a buying opportunity in line with the broader trend, targeting a recovery to recent highs.

Gold's Price Action Amidst Fed's Inflationary Warnings XAUUSD: Gold's Price Action Amidst Fed's Inflationary Warnings – Key Levels to Watch!
Hello TradingView Community!
Gold (XAUUSD) continues to be a focal point amidst the Federal Reserve's (Fed) cautious stance on inflation and interest rates. Recent statements from Fed Chair Jerome Powell highlight concerns that large-scale tariffs could trigger persistent inflation, moving beyond conventional economic models. Despite recent inflation cooling, Powell emphasized the need for more data from June and July before considering any rate cuts, warning of the risk that "price shocks turn into persistent inflation".
This creates a nuanced market sentiment, torn between hopes for rate cuts and the emerging inflation risk from tariffs. In this environment, Gold remains a crucial psychological anchor, especially if the Fed delays its reaction to new inflationary pressures.
📊 XAUUSD Technical Outlook (H4/M30 Chart Analysis):
Based on our recent chart analysis (e.g., image_008403.png): Gold is currently in a corrective or consolidating phase after a notable pullback. Price action indicates that key support and resistance levels are being tested.
Resistance Levels (Potential Sell Zones): We see significant resistance around 3352.383 - 3353.860 and higher up at 3371.205, with a major resistance area near the top at 3391.750 - 3395.000.
Support Levels (Potential Buy Zones): Key support is identified around 3317.738 - 3311.214, with a stronger demand zone at 3302.939 - 3302.857. A critical lower support lies at 3286.257.
🎯 XAUUSD Intraday Trading Plan:
Here are the key zones and targets for today, based on current market dynamics:
BUY SCALP:
Entry: 3316 - 3314
SL: 3310
TP: 3320 - 3324 - 3328 - 3332 - 3336 - 3340
BUY ZONE:
Entry: 3304 - 3302
SL: 3298
TP: 3308 - 3312 - 3316 - 3320 - 3330 - 3340 - 3350
SELL SCALP:
Entry: 3353 - 3355
SL: 3360
TP: 3350 - 3345 - 3340 - 3335 - 3330
SELL ZONE:
Entry: 3390 - 3392
SL: 3396
TP: 3386 - 3382 - 3378 - 3374 - 3370 - 3360
⚠️ Key Factors to Monitor:
Fed Speeches: Any further comments from Fed officials on inflation or policy outlook.
US Economic Data: Upcoming inflation (CPI, PCE) and employment reports (NFP) will heavily influence Fed policy expectations.
Geopolitical Developments: Ongoing global tensions can always boost Gold's safe-haven appeal.
