USDJPY – Momentum Fades Near 146 BarrierUSDJPY is approaching the significant resistance level at 146.020 following a parabolic rebound. This area previously triggered a sharp sell-off, and a minor double top pattern may be forming. If price gets rejected here, the support zone around 144.470 (EMA89 + demand zone) becomes a likely target for a pullback.
The recent upside was supported by hawkish comments from BoJ Governor Ueda, but the main market focus remains on the U.S.–China trade talks. If tensions ease, the USD could weaken, supporting the bearish scenario for USDJPY.
Forex

XAUUSD – Weak Rebound, Downside Pressure RemainsGold is currently testing the 3,339 resistance zone – a confluence with the EMA34 and EMA89, which has rejected price multiple times before. The current rebound is weak, suggesting that buyers are struggling. The bearish structure is becoming clearer with lower highs. If gold fails to break this resistance, it could retreat to 3,303; a break below that would likely open the way down to the 3,264 support level.
On the news front, the gold market is being heavily influenced by the ongoing U.S.–China trade negotiations in London. This major event could spark unpredictable volatility. If tensions ease, safe-haven demand for gold may fade, further supporting the short-term bearish outlook.

Option Trading with Option chainIf you're looking for a simple options trading definition, it goes something like this: Options trading gives you the right or obligation to buy or sell a specific security on or by a specific date at a specific price. An option is a contract that's linked to an underlying asset, such as a stock or another security.
Options trading also involves two parties: the holder (buyer) and the writer (sometimes called the seller). Holders are investors who purchase contracts, while writers create them. The holder pays the writer a premium for the right to sell or buy a stock by a certain date.

Technical Cass 9Hammer:
Doji :
Three-white soldiers:
Bullish Engulfing:
Tweezer Bottom:
How to confirm candlestick pattern?
Here are two reliable methods for confirming candlestick patterns with indicators:
MACD: A bullish crossover occurring alongside a bullish candlestick strengthens the case for upward movement.
RSI: Divergence between price and RSI can signal potential reversals, especially when aligned with candlestick patterns.

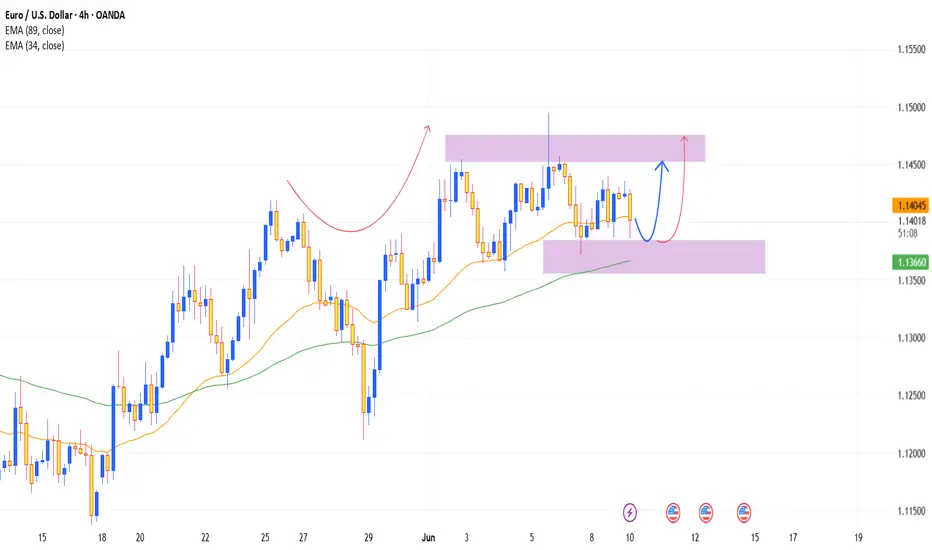
EURUSD – Steady accumulation, ready for a fresh breakout?After a slight correction, EURUSD is trying to stabilize around the support zone of 1.13840 – which coincides with the EMA89 and a historically strong price reaction area. Although there hasn’t been a clear breakout yet, recent price action still shows an effort to maintain the bullish structure as the higher lows remain intact.
If buyers can take advantage of this support and build momentum, the next target could very well be the 1.14780 zone – an area that has rejected price multiple times and now serves as a key resistance level for the bulls.
Beyond the technical picture, the market is also awaiting this week's CPI, PPI, and NFP data. If these numbers come in weaker than expected, the likelihood of the Fed cutting rates sooner will rise – a positive signal for EURUSD. Moreover, with ongoing geopolitical risks, defensive capital flows may continue to exit the USD, giving the euro an edge in the coming sessions.
GOLD IN SIDEWAY PHASE, WAITING FOR A BREAKOUT THROUGH KEY LEVELSXAU/USD TRADING PLAN 10/06/2025 – GOLD IN SIDEWAY PHASE, WAITING FOR A BREAKOUT THROUGH KEY LEVELS!
🌍 MACRO CONTEXT – FUNDAMENTAL ANALYSIS
Geopolitical tensions and monetary policy: The market is currently in a wait-and-see phase, with major decisions pending from important meetings, especially statements from the Federal Reserve (Fed) and global conflict situations. These factors could have a significant impact on market sentiment and volatility in gold.
Weak economic data from major economies such as the U.S. and the Eurozone indicates challenging economic conditions, leading investors to view gold as a safe-haven asset.
Interest rates: Although the Fed continues its rate hike policy, financial market uncertainties could continue to support gold as a preferred asset class.
📉 TECHNICAL ANALYSIS
On the M30–H1 timeframe, XAU/USD is currently moving within a rising channel. After the correction in Wave 4, gold has bounced back in the 335x region and is now preparing to confirm the next trend. Signals from EMA indicate accumulation, potentially setting up for a strong rally ahead.
Key resistance levels: 3,338 – 3,345 (unexplored FVG region). If gold breaks above 3,345, a continued rise to 3,353 is highly likely.
Key support levels: 3,282 – 3,275. If gold retests these levels without breaking them, the chances of a rebound are strong.
🎯 TRADE SETUPS FOR TODAY
🔵 BUY ZONE:
Entry: 3,302 - 3,304
SL: 3,296
TP: 3,306 → 3,310 → 3,314 → 3,318 → 3,325
🔴 SELL ZONE:
Entry: 3352 - 3354
SL: 3,358
TP: 3,348 → 3,344 → 3,340 → 3,330 → 3,320
⚠️ NOTE:
Risk management: Expect significant volatility as the market awaits important news this week.
Wait for confirmation: Technical signals are for guidance; clear confirmation from the charts is needed before entering trades.
📌 CONCLUSION:
Gold is currently in a sideway phase and may be preparing for a breakout if these key support and resistance levels are breached.
Traders should monitor both macroeconomic factors and strategic price zones to make informed trading decisions.

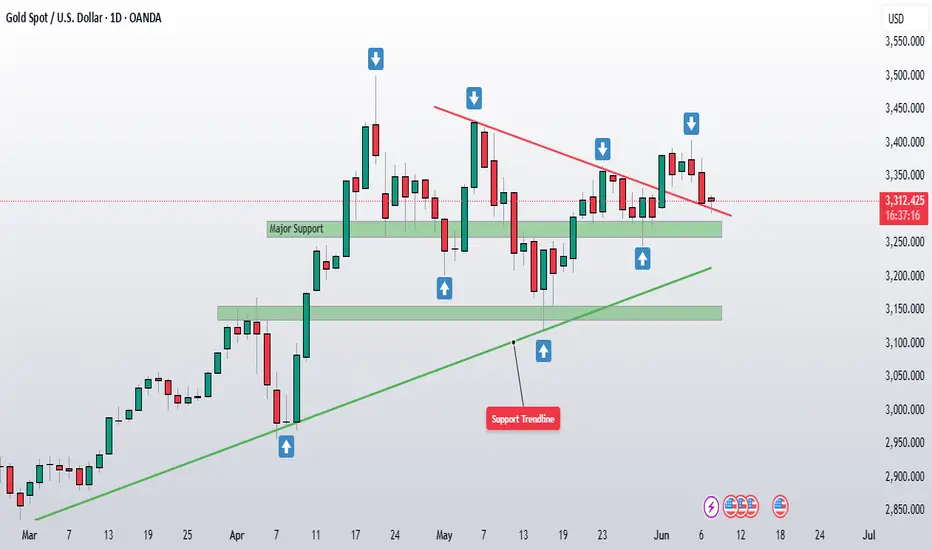
Gold ,Momentum on MuteGold continues to trade within a well-defined range, showing no clear breakout or breakdown. Price remains trapped between the narrow range . Despite brief upward attempts, bearish pressure near the red trendline has kept the market capped this suggesting indecision as neither bulls nor bears have seized control. Unless we see a decisive break above 3330-40 area (previous support now resistance) red descending trendline or below the support region, price is likely to remain sideways and choppy in the short term.
This remains a non-trading zone for directional traders. Better opportunities may emerge after a volatility expansion outside this range.

XAUUSD – Holding support, eyeing breakout aheadGold has paused its decline after falling out of the ascending channel and is now testing the support area around 3,279 USD. This zone is a confluence of a key demand area and recent swing lows. If this level holds, XAUUSD may rebound to retest the resistance near 3,358 USD – where the EMA34 and EMA89 are also positioned.
Notably, the long-term bullish structure remains intact, and price action may be forming a consolidation phase before a potential upward move. If upcoming CPI, PPI, and NFP data come in weaker, expectations of a Fed rate cut could rise – a factor that typically supports gold. Additionally, ongoing geopolitical tensions continue to bolster gold’s safe-haven appeal.

XAUUSD – Breaks Support Line, Risk of Deeper CorrectionOn the H4 timeframe, gold has officially broken below the ascending trendline formed since mid-May, after several successful retests. This is a clear sign that the short-term uptrend is losing momentum.
Following the trendline breakdown, price is currently making a mild pullback, retesting the confluence zone of EMA34–EMA89 around 3,323 to 3,336 USD. However, if this zone continues to act as resistance, the pullback pattern will complete and open up the possibility of further decline toward the next support area around 3,264 USD – which previously held price well.
Moreover, gold remains under pressure due to the US dollar’s strong rebound amid expectations that the Fed will maintain high interest rates. Hot CPI and PPI forecasts are delaying rate cut hopes, further weighing on gold prices.

Learn Institutional options trading Part-4SEBI Regulations & Reforms
SEBI has made multiple reforms to ensure safe and transparent options trading:
Peak Margin Requirements – Traders must maintain full upfront margin.
Ban List – Illiquid stock options are periodically banned.
Lot Size Revisions – To control leverage and speculation.
Options Chain Transparency – Exchanges provide real-time data.
Investor Education Initiatives – Workshops, certifications, and sandbox testing.
Risks in Options Trading'
Options can generate high rewards, but they carry significant risks, especially if misused without understanding.
Key Risks:
Premium decay
Volatility risk
Leverage risk
Liquidity issues in stock options
Wrong position sizing
SEBI has introduced risk-mitigation measures, such as margin rules and banning of certain contracts for illiquid stocks.

Learn Institutional options trading Part-5Future of Options Trading in India
What Lies Ahead:
More weekly expiries (e.g., MIDCPNIFTY)
Improved retail education
Stricter compliance and reporting
Rise in algo trading and automation
Integration with global exchanges (GIFT City)
With platforms like NSE IFSC, Indian traders may soon get access to international stock derivatives from Indian soil.

Potential Breakdown with Retest or Reversal Zone This chart represents a classic Double Top pattern, a bearish reversal signal indicating strong resistance around the 3,380 - 3,390 USD zone (marked with two white circles).
🔍 Key Zones and Levels:
1. Resistance Zone (~3,380 - 3,390 USD):
Price was rejected twice here.
Suggests strong selling pressure and buyer exhaustion.
2. Mid Support/Retest Zone (~3,337.857 USD):
Marked with a horizontal white line.
Could act as a short-term resistance if price retraces.
3. Demand Zone (~3,330 - 3,337 USD):
Highlighted green box: potential reversal/retest zone.
Bullish scenario: price bounces from here and heads back to retest resistance.
4. Current Price (~3,309.980 USD):
Price has broken below the demand zone and is approaching strong horizontal support.
5. Lower Support (~3,265 - 3,270 USD):
Highlighted with blue horizontal lines and purple arrows.
Could be the next bearish target if breakdown is confirmed.
🔄 Two Possible Scenarios:
📉 Bearish Continuation:
Price retests the broken demand zone (now resistance).
Rejects and forms a lower high.
Falls toward the lower support around 3,265–3,270 USD.
📈 Bullish Reversal:
Price reclaims the green demand zone.
Pushes above 3,337.857 USD level.
Heads back to retest the double top area (~3,380
✅ Conclusion:
The bias is currently bearish, supported by:
Double top formation.
Breakdown below key demand zone.
Momentum favoring further downside
However, a bullish reversal is possible if price reclaims the 3,337 USD zone and shows strong bullish structure.

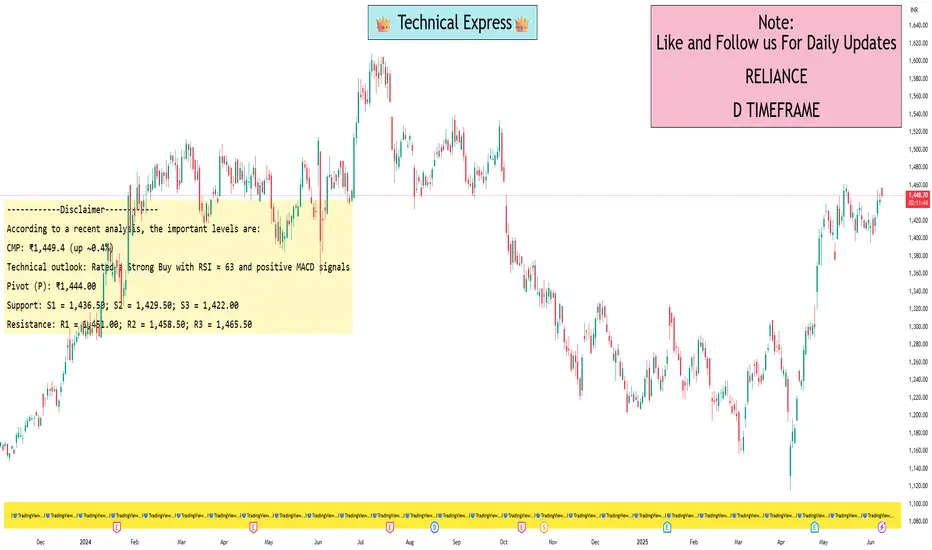
Reliance levels for swing tradingAccording to a recent analysis, the important levels are:
Current Price & Context
-- CMP: ₹1,449.4 (up ~0.4%)
-- Technical outlook: Rated a Strong Buy with RSI ≈ 63 and positive MACD signals
Pivot & CPR Levels
Daily (Classic) Pivot Points
Pivot (P): ₹1,444.00
Support: S1 = 1,436.50; S2 = 1,429.50; S3 = 1,422.00
Resistance: R1 = 1,451.00; R2 = 1,458.50; R3 = 1,465.50
Daily CPR:
Bottom Central (BC) = 1,444.25
Central = 1,444.00
Top Central (TC) = 1,443.75
Weekly Pivot Points
Pivot: ₹1,431.27
Support: S1 = 1,407.83; S2 = 1,372.17
Resistance: R1 = 1,466.93; R2 = 1,490.37
Nifty-50 levels for swing tradingAccording to a recent analysis, the important levels are:
Trend‑deciding pivot: 25,064
Resistance (R): 25,142 → 25,221 → 25,299 → 25,343 → 25,416
Support (S): 24,985 → 24,907 → 24,828 → 24,750 → 24,671
Weekly Pivot: ~24,844
R1: ~25,187, R2: ~25,372; S1: ~24,661, S2: ~24,317

Waiting for the Breakout: Consolidation or Trend Continuation?XAUUSD – Waiting for the Breakout: Consolidation or Trend Continuation?
Gold (XAUUSD) is trading within a narrowing range, building momentum after rebounding from the 3.276 support area. Despite short-term uncertainties, the overall macroeconomic landscape continues to favor bullish scenarios — though key resistance levels must be cleared to confirm continuation.
🌍 MACRO & MARKET SENTIMENT
USD Weakness: The DXY continues to trade under pressure, increasing the appeal of non-yielding assets like gold.
US–China Trade Talks: Ongoing high-level negotiations in London could either ease geopolitical tensions or fuel safe-haven demand, depending on outcomes.
Global Risk Appetite: With US debt ceiling concerns still looming and the Fed showing hesitancy to cut rates soon, gold remains in focus as a hedge.
📈 TECHNICAL OUTLOOK (30M–H1)
The price has formed a descending wedge structure and is hovering near key EMAs (13–34–89–200).
A breakout above 3,334 could trigger a short-term bullish wave, while failure at this zone would likely lead to deeper correction toward 3,276 or lower.
📍 STRATEGIC KEY LEVELS
Resistance: 3,334 – 3,336 – 3,362 – 3,390
Support: 3,300 – 3,276 – 3,250
🧭 TRADING SCENARIOS
🔵 BUY ZONE: 3,276 – 3,274
SL: 3,270
TP: 3,280 → 3,284 → 3,288 → 3,292 → 3,296 → 3,300
🔻 SELL SCALP: 3,334 – 3,336
SL: 3,340
TP: 3,330 → 3,326 → 3,322 → 3,318 → 3,314 → 3,310
🔻 SELL ZONE: 3,362 – 3,364
SL: 3,368
TP: 3,358 → 3,354 → 3,350 → 3,346 → 3,340 → 3,335 → 3,330 → 3,320
✅ SUMMARY
Gold remains in a critical range, and traders should focus on well-defined zones to capitalize on volatility. Use confirmation-based entries and respect risk parameters — especially as macro headlines and technical patterns align for a potential breakout.

XAUUSD – Shaky below resistance, clear bearish signal formingGold is showing signs of weakness after retesting the resistance area around 3,394 USD. The current price structure indicates a failed minor rebound – most likely a false breakout, suggesting the potential for another leg down.
On the H4 chart, price has slipped below the EMA34 and is heading toward the EMA89 zone. If selling pressure continues, the next target will be the strong support around 3,167 USD. A break below this level could trigger a deeper decline toward the 3,114 USD zone.
Notably, price action is forming a short-term “lower high” – a classic characteristic of a downtrend. The strategy now is to closely monitor the retracement zone around 3,320–3,330 USD for reversal signals, rather than trying to catch a bottom too early.

Sideways Gold, Stronger Dollar: A Pause Before the BreakGold attempted a bullish breakout recently but failed to sustain momentum and is now back within a consolidation zone between 3,250–3,350. The repeated failure to break above descending trendline resistance suggests weakening buyer strength. It is currently forming lower highs, indicating distribution or sideways movement rather than a clear rally.
On the other hand, DXY has bounced from a key demand zone near 99.00, showing signs of short-term strength. It is now targeting the 102.60–104. resistance zone, which aligns with a Fibonacci retracement. If DXY continues higher, it could put pressure on gold prices in the near term.
Given this context, it is wise to remain on the sidelines for the next 2–3 weeks and wait for one of two scenarios:
1. DXY rejection from the 102.60–104 area – This would support a bullish case for gold.
2. Gold breakout above 3,400 with strong volume or need another bounce from lower support area as marked on chart which can provide confirmation of bullish continuation.
Until then, gold is likely to stay in a range or face minor downside due to DXY strength.
XAUUSD – Reaccumulating below key resistanceGold is following the textbook pattern of a strong uptrend on the D1 chart. After bouncing from the support zone around EMA34 and EMA89, the price is continuing to consolidate just below the major resistance around 3,397.500 USD.
What’s notable is that this level previously rejected price, so the current pause in momentum is understandable. However, as long as the price holds above the support zone around 3,171.600 USD – which aligns with EMA89 and the prior demand zone – the bullish structure remains intact.
The most reasonable scenario now is to wait for a clear bounce from the EMA region or a confirmed breakout above resistance. If a breakout occurs, the next target will likely be the previous high around 3,434.500 USD.
On the news front, U.S. jobless claims have slightly increased this week, reinforcing expectations that the Fed will keep interest rates unchanged – an indirect boost for gold.

Open Interest & Option Chain Analysis Topic: Open Interest & Option Chain Analysis
1: What is Open Interest (OI)?
Simple Meaning:
Open Interest means the total number of active option or futures contracts in the market that haven’t been closed yet.
Easy Example:
If you and your friend enter into a new option trade, the open interest is 1. If someone else joins with a new trade, it becomes 2. But if you close your trade, it becomes 1 again.
What It Tells You:
If OI is increasing, more people are joining the market.
If OI is decreasing, traders are exiting their trades.
Combine OI with Price Movement:
Price going up + OI going up = New buying → Bullish
Price going down + OI going up = New selling → Bearish
Price going up + OI going down = Traders exiting shorts → Short covering
Price going down + OI going down = Traders exiting longs → Profit booking
2: What is an Option Chain?
Simple Meaning:
Option Chain is a table that shows all the call and put options for a stock at different strike prices.
What You’ll See in an Option Chain:
Strike Price: The price you agree to buy/sell.
Calls (CE): Right to buy.
Puts (PE): Right to sell.
Open Interest (OI): How many contracts are active.
Volume: How many were traded today.
LTP: Latest price of that option.
3: How to Read Option Chain Like a Pro
1. Spot the Support Levels:
Look for the highest OI on the put (PE) side → Big money sees this as support.
2. Spot the Resistance Levels:
Look for the highest OI on the call (CE) side → Traders think price won't go above this.
3. Track Market Mood:
If more puts are being written (PE OI going up) → Traders are bullish.
If more calls are being written (CE OI going up) → Traders are bearish.
4. PCR (Put Call Ratio):
PCR > 1 → More puts than calls = Bullish
PCR < 1 → More calls than puts = Bearish

Advance Institutions Option Trading - Lecture 4If you're looking for a simple options trading definition, it goes something like this: Options trading gives you the right or obligation to buy or sell a specific security on or by a specific date at a specific price. An option is a contract that's linked to an underlying asset, such as a stock or another security.
Options trading also involves two parties: the holder (buyer) and the writer (sometimes called the seller). Holders are investors who purchase contracts, while writers create them. The holder pays the writer a premium for the right to sell or buy a stock by a certain date.

USDJPY – Buying momentum builds, uptrend in sightUSDJPY has just bounced strongly from the key support zone around 142.510 – a level that has acted as a “fortress” over the past two weeks. Price action is gradually regaining momentum, forming a potential double bottom and heading toward a retest of the long-term descending trendline.
Currently, the 144.800–145.000 area is the nearest resistance, aligning with both the EMA and the descending trendline. If buyers maintain control, a breakout above this zone could pave the way for the next leg up toward 145.750 and beyond.
In terms of news, the latest U.S. ISM Services data came in weaker than expected, reducing rate hike expectations. While this puts mild pressure on the USD, the reaction from USDJPY suggests the market is leaning toward a rebound rather than a breakdown.

NFP STORM BREWING: WILL GOLD BREAK HIGHER OR DIVE LOWER?XAUUSD – NFP STORM BREWING: WILL GOLD BREAK HIGHER OR DIVE LOWER?
Gold enters a highly sensitive phase ahead of tonight’s Non-Farm Payrolls (NFP) release – one of the most influential data points for global financial markets. With US-China trade tensions rekindling and sovereign debt concerns mounting in the US, the yellow metal could experience a major breakout or a sharp reversal during the New York session.
🌍 MACRO & FUNDAMENTAL OUTLOOK
US-China trade talks have resurfaced, with concerns around tariffs and strategic metals dominating headlines. China's recent stance signals it may take stronger defensive actions.
The US national debt is projected to hit $55 trillion by 2034, prompting global central banks to ramp up gold purchases as a strategic hedge.
Fed Chair Powell reiterated a “no rush to cut” stance, yet political pressure is mounting – especially with Donald Trump urging immediate rate cuts following the weakest ADP job growth in two years.
Unemployment Claims released today came in slightly better than expected (236K vs. 240K), adding fuel to speculations around a softer NFP print – potentially bullish for gold.
🔍 TECHNICAL ANALYSIS (H1 – EMA 13/34/89/200)
The chart shows a clean impulsive wave structure. After hitting the resistance zone at 3408–3410, gold entered a consolidation range.
Price is currently hovering around EMA 89–200, suggesting trend divergence and uncertainty ahead of NFP.
A breakdown below the 3344–3332 support zone could push price down to the FVG (Fair Value Gap) at 3320, which may act as a strong liquidity pool for buyers.
⚠️ KEY LEVELS TO WATCH
Resistance: 3380 – 3392 – 3408 – 3436
Support: 3365 – 3350 – 3344 – 3332 – 3320
🧭 TRADE SETUPS
🔻 SELL ZONE: 3408 – 3410
Stop Loss: 3415
Take Profit: 3404 → 3400 → 3395 → 3390 → 3380 → 3370 → 3360 → 3350
🔵 BUY ZONE: 3318 – 3316
Stop Loss: 3310
Take Profit: 3322 → 3326 → 3330 → 3335 → 3340 → 3350 → 3360 → ???
✅ CONCLUSION
Gold is poised for a volatile breakout with NFP acting as the key catalyst. A soft jobs report may trigger a breakout above 3410, while stronger-than-expected numbers could fuel a bearish reversal. In this sensitive phase, traders should stick to defined zones and wait for confirmed liquidity reactions rather than chasing price impulsively.

Option Chain AnalysisTo read an options chart effectively, consider the following steps:
Identify the strike price associated with each line on the chart.
Observe the direction and steepness of the lines to gauge the options' delta values. ...
Assess the options' positions concerning the current market price of the underlying asset.
