Option Chain AnalysisTo read an options chart effectively, consider the following steps:
Identify the strike price associated with each line on the chart.
Observe the direction and steepness of the lines to gauge the options' delta values. ...
Assess the options' positions concerning the current market price of the underlying asset.
Forex

Basic to Advance in Trading Understand market trends and patterns.
Use risk management strategies, like setting stop-loss orders.
Focus on liquid assets with high volume.
Keep emotions in check and stick to a trading plan.
Limit the number of trades to manage risk.
Constantly educate yourself on market dynamics and trading strategies.

Class for Advanced Trader part 2To understand how to become a trader, follow these seven steps:
Complete your education. ...
Learning the basics of trading. ...
Determine the product in which you want to trade. ...
Develop trading techniques. ...
Gain trading experience. ...
Understand risk management. ...
Review your trades.

EUR USD 15 ANALYSIS AND TARGETAS market have taken all buyside liquiduty it is goignt for sell side....i have marked the todays target .....for more updates follow me

Class for Advanced Trader Advanced trading strategies usually involve multiple technical indicators and more complicated instruments, such as options and futures.

Put Call Ratio (PCR) Trading The Put Call Ratio (PCR) is a tool in the stock market to understand how investors feel about a stock or the market's future. It compares the number of put options to call options traded. More puts traded mean investors expect prices to fall (bearish). More calls traded mean investors expect prices to rise (bullish).

Divergence Test Divergence is when the asset price moves in the direction opposite to what a technical indicator indicates. When a stock is diverging, it signals weaker price trends and the beginning of a reversal.

Price Action Trading Price action trading is based on analyzing the raw movement of price over time without relying heavily on indicators. It involves picking out key levels, reviewing candlestick patterns, and recognizing reversal and continuation setups to capitalize on market opportunities.

EURUSD – Strong uptrend, Non-farm could trigger breakoutEURUSD continues to maintain a steady uptrend within a well-defined ascending channel. Each pullback has been well absorbed around the EMA 34–89 and the dynamic support zone near 1.13650, signaling that buyers remain in control.
Currently, price is approaching the key resistance area around 1.14840 – a level that previously triggered a rejection. If it fails to break through again, a minor pullback toward the support zone followed by a bounce, as shown in the chart, is a likely scenario.
What’s worth noting is that the Non-Farm Payroll report is due later today – a potential catalyst that could either fuel a breakout or break the current channel. If U.S. job data comes in weaker than expected, the USD may face selling pressure, providing a strong boost for the euro.

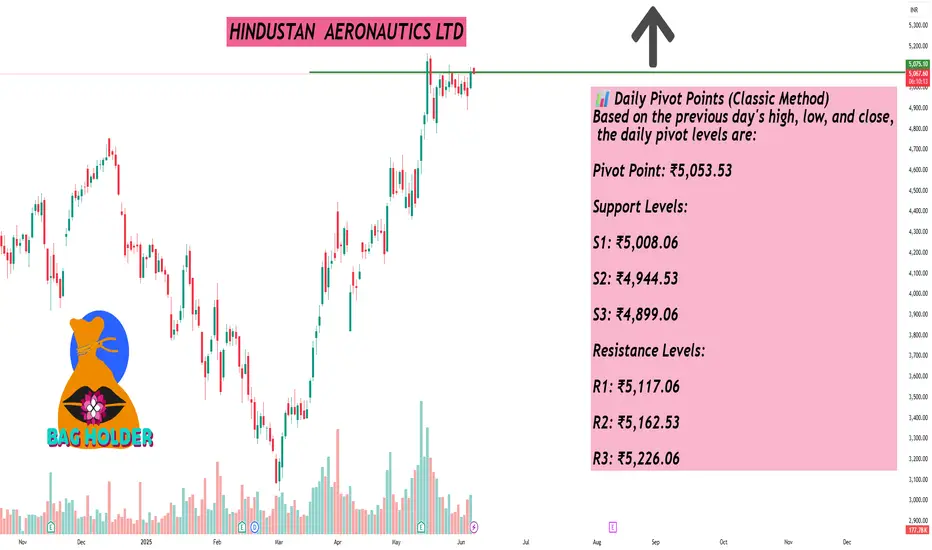
HINDUSTAN AERONAUTICS LTDAs of June 6, 2025, Hindustan Aeronautics Ltd. (NSE: HAL) is trading at approximately ₹5,071.60, reflecting a 2.25% increase over the previous day. Here's a detailed technical analysis focusing on daily support and resistance levels:
📊 Daily Pivot Points (Classic Method)
Based on the previous day's high, low, and close, the daily pivot levels are:
Pivot Point: ₹5,053.53
Support Levels:
S1: ₹5,008.06
S2: ₹4,944.53
S3: ₹4,899.06
Resistance Levels:
R1: ₹5,117.06
R2: ₹5,162.53
R3: ₹5,226.06
📈 Fibonacci Pivot Points
Using Fibonacci calculations, the levels are:
Pivot Point: ₹5,053.53
Support Levels:
S1: ₹5,011.90
S2: ₹4,986.17
S3: ₹4,944.53
Resistance Levels:
R1: ₹5,095.17
R2: ₹5,120.90
R3: ₹5,162.53
🔍 Camarilla Pivot Points
Derived using the Camarilla method:
Pivot Point: ₹5,053.53
Support Levels:
S1: ₹5,061.61
S2: ₹5,051.62
S3: ₹5,041.63
Resistance Levels:
R1: ₹5,081.59
R2: ₹5,091.58
R3: ₹5,101.58
📌 Trading Insights
Immediate Support: ₹5,008.06 (Classic S1)
Immediate Resistance: ₹5,117.06 (Classic R1)
Given the current price of ₹5,071.60, the stock is trading near its pivot point, suggesting potential for upward movement if it breaks above the immediate resistance. However, traders should monitor for any signs of reversal or consolidation around these levels.
L&T FINANCE LTDAs of June 6, 2025, L&T Finance Ltd. (NSE: LTF) is trading at approximately ₹180.82. Here's a detailed technical analysis focusing on daily support and resistance levels:
📊 Daily Pivot Points (Classic Method)
Calculated based on the previous day's high, low, and close prices:
Pivot Point: ₹180.82
Support Levels:
S1: ₹177.34
S2: ₹171.32
S3: ₹167.84
Resistance Levels:
R1: ₹186.84
R2: ₹190.32
R3: ₹196.34
📈 Fibonacci Pivot Points
Based on Fibonacci calculations:\
Pivot Point: ₹180.82
Support Levels:
S1: ₹177.19
S2: ₹174.95
S3: ₹171.32
Resistance Levels:
R1: ₹184.45
R2: ₹186.69
R3: ₹190.32
🔍 Camarilla Pivot Points
These levels are derived using the Camarilla method:
Pivot Point: ₹180.82
Support Levels:
S1: ₹182.49
S2: ₹181.62
S3: ₹180.75
Resistance Levels:
R1: ₹184.23
R2: ₹185.10
R3: ₹185.97
📌 Trading Insights
Immediate Support: ₹177.34 (Classic S1)
Immediate Resistance: ₹186.84 (Classic R1)
Traders may consider these levels for setting stop-loss and take-profit orders. A break above ₹186.84 could signal bullish momentum, while a drop below ₹177.34 might indicate bearish pressure.

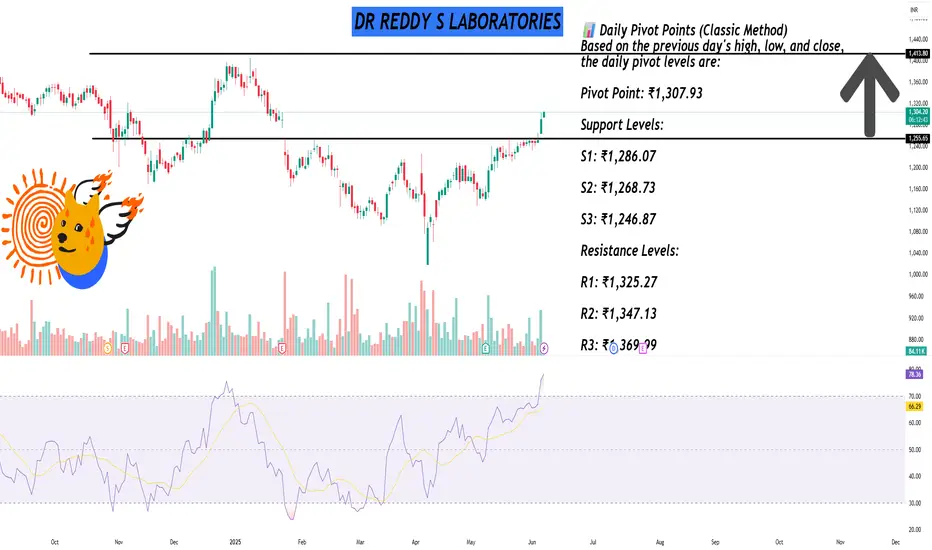
DR REDDY S LABORATORIESAs of June 6, 2025, Dr. Reddy's Laboratories Ltd. (NSE: DRREDDY) is trading at approximately ₹1,290.60, reflecting a 3.04% increase over the previous day.
📊 Daily Pivot Points (Classic Method)
Based on the previous day's high, low, and close, the daily pivot levels are:
Pivot Point: ₹1,307.93
Support Levels:
S1: ₹1,286.07
S2: ₹1,268.73
S3: ₹1,246.87
Resistance Levels:
R1: ₹1,325.27
R2: ₹1,347.13
R3: ₹1,369.99
📈 Fibonacci Pivot Points
Using Fibonacci calculations, the levels are:
Pivot Point: ₹1,307.93
Support Levels:
S1: ₹1,286.07
S2: ₹1,268.73
S3: ₹1,246.87
Resistance Levels:
R1: ₹1,325.27
R2: ₹1,347.13
R3: ₹1,369.99
🔍 Camarilla Pivot Points
Derived using the Camarilla method:
Pivot Point: ₹1,286.07
Support Levels:
S1: ₹1,269.04
S2: ₹1,279.82
S3: ₹1,283.41
Resistance Levels:
R1: ₹1,294.19
R2: ₹1,297.79
R3: ₹1,301.38
📌 Trading Insights
Immediate Support: ₹1,286.07 (Classic S1)
Immediate Resistance: ₹1,325.27 (Classic R1)
Traders may consider these levels for setting stop-loss and take-profit orders. A break above ₹1,325.27 could signal bullish momentum, while a drop below ₹1,286.07 might indicate bearish pressure.
KPI GREEN ENERGY LTDAs of June 6, 2025, KPI Green Energy Ltd. (NSE: KPIGREEN) is trading at approximately ₹503.45, reflecting a 4.88% increase over the previous day.
📊 Daily Pivot Points (Classic Method)
Based on the previous day's high, low, and close, the daily pivot levels are:
Pivot Point: ₹497.23
Support Levels:
S1: ₹488.32
S2: ₹471.08
S3: ₹462.17
Resistance Levels:
R1: ₹514.47
R2: ₹523.38
R3: ₹540.62
📈 Fibonacci Pivot Points
Using Fibonacci calculations, the levels are:
Pivot Point: ₹497.23
Support Levels:
S1: ₹487.24
S2: ₹481.07
S3: ₹471.08
Resistance Levels:
R1: ₹507.22
R2: ₹513.39
R3: ₹523.38
🔍 Camarilla Pivot Points
Derived using the Camarilla method:
Pivot Point: ₹497.23
Support Levels:
S1: ₹503.15
S2: ₹500.76
S3: ₹498.36
Resistance Levels:
R1: ₹507.95
R2: ₹510.34
R3: ₹512.74
📌 Trading Insights
Immediate Support: ₹488.32 (Classic S1)
Immediate Resistance: ₹514.47 (Classic R1)
Traders may consider these levels for setting stop-loss and take-profit orders. A break above ₹514.47 could signal bullish momentum, while a drop below ₹488.32 might indicate bearish pressure.

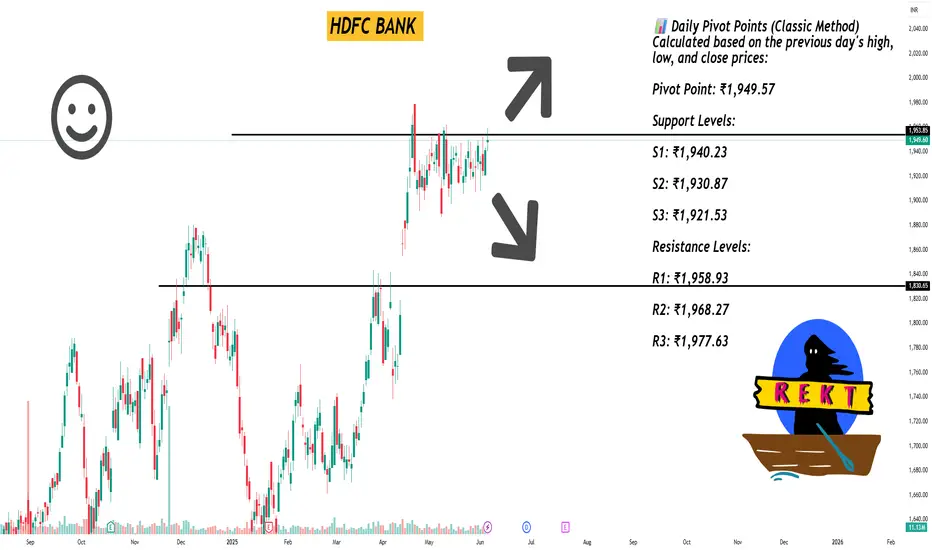
HDFC BANK As of June 6, 2025, HDFC Bank Ltd. (NSE: HDFCBANK) is trading at approximately ₹1,944.90. Here's a detailed technical analysis focusing on daily support and resistance levels:
📊 Daily Pivot Points (Classic Method)
Calculated based on the previous day's high, low, and close prices:
Pivot Point: ₹1,949.57
Support Levels:
S1: ₹1,940.23
S2: ₹1,930.87
S3: ₹1,921.53
Resistance Levels:
R1: ₹1,958.93
R2: ₹1,968.27
R3: ₹1,977.63
Source: Top Stock Research
📈 Fibonacci Support & Resistance Levels
Based on Fibonacci calculations:
Support Levels:
S1: ₹1,942.42
S2: ₹1,938.01
S3: ₹1,930.87
Resistance Levels:
R1: ₹1,956.71
R2: ₹1,961.12
R3: ₹1,968.27
🔍 Camarilla Pivot Points
These levels are derived using the Camarilla method:
Support Levels:
S1: ₹1,947.89
S2: ₹1,946.17
S3: ₹1,944.46
Resistance Levels:
R1: ₹1,951.31
R2: ₹1,953.03
R3: ₹1,954.74
📌 Trading Insights
Immediate Support: ₹1,940.23 (Classic S1)
Immediate Resistance: ₹1,958.93 (Classic R1)
Traders may consider these levels for setting stop-loss and take-profit orders. A break above ₹1,958.93 could signal bullish momentum, while a drop below ₹1,940.23 might indicate bearish pressure.
BLS INTERNATIONAL SERVICES LIMITEDAs of June 6, 2025, BLS International Services Ltd. (NSE: BLS) is trading at approximately ₹408.60. Here's a detailed technical analysis focusing on daily support and resistance levels:
📊 Daily Pivot Points (Classic Method)
Calculated based on the previous day's high, low, and close prices:
Pivot Point: ₹410.17
Support Levels:
S1: ₹405.83
S2: ₹402.77
S3: ₹398.43
Resistance Levels:
R1: ₹413.23
R2: ₹417.57
R3: ₹420.63
📈 Fibonacci Support & Resistance Levels
Based on Fibonacci calculations:
Support Levels:
S1: ₹407.34
S2: ₹405.59
S3: ₹402.77
Resistance Levels:
R1: ₹412.99
R2: ₹414.74
R3: ₹417.57
🔍 Camarilla Pivot Points
These levels are derived using the Camarilla method:
Support Levels:
S1: ₹408.22
S2: ₹407.54
S3: ₹406.86
Resistance Levels:
R1: ₹409.58
R2: ₹410.26
R3: ₹410.94
📌 Trading Insights
Immediate Support: ₹405.83 (Classic S1)
Immediate Resistance: ₹413.23 (Classic R1)
Traders may consider these levels for setting stop-loss and take-profit orders. A break above ₹413.23 could signal bullish momentum, while a drop below ₹405.83 might indicate bearish pressure.

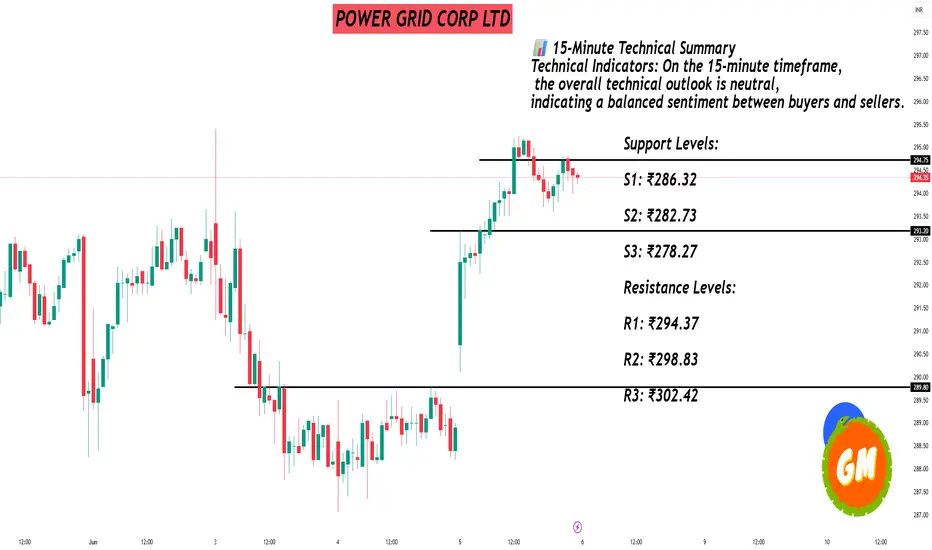
POWER GRID CORP LTDAs of June 6, 2025, Power Grid Corporation of India Ltd. (NSE: POWERGRID) is trading at approximately ₹294.25. Here's a detailed technical analysis focusing on 15-minute support and resistance levels, along with broader daily pivot points:
📊 15-Minute Technical Summary
Technical Indicators: On the 15-minute timeframe, the overall technical outlook is neutral, indicating a balanced sentiment between buyers and sellers.
🔧 Daily Pivot Points (Classic Method)
These levels are calculated based on the previous day's high, low, and close prices:
Pivot Point: ₹290.78
Support Levels:
S1: ₹286.32
S2: ₹282.73
S3: ₹278.27
Resistance Levels:
R1: ₹294.37
R2: ₹298.83
R3: ₹302.42
📈 Fibonacci Support & Resistance Levels
Based on Fibonacci calculations:
Support Levels:
S1: ₹291.23
S2: ₹290.02
S3: ₹288.05
Resistance Levels:
R1: ₹295.17
R2: ₹296.38
R3: ₹298.35
📌 Trading Insights
Current Price: ₹294.25
Immediate Resistance: ₹295.17 (Fibonacci R1)
Immediate Support: ₹291.23 (Fibonacci S1)
Traders may consider these levels for setting stop-loss and take-profit orders. A break above ₹295.17 could signal bullish momentum, while a drop below ₹291.23 might indicate bearish pressure.
XAUUSD – Awaiting Non-Farm, will gold hold its ground?The H8 chart shows gold retesting a key resistance zone around 3,426 USD after an impressive recovery run. Price action remains solid above the rising trendline and is supported by the EMA 34–89, indicating that the bullish structure is still well intact.
However, the upper resistance zone is causing some hesitation in the market. If gold fails to break through immediately, a minor pullback toward the 3,330 – 3,290 USD area is highly possible. If this zone holds, it would present a good opportunity to rejoin the uptrend.
On the news front, today’s spotlight is the U.S. Non-Farm Payrolls report. If the jobs data comes in weaker than expected, expectations for a Fed rate cut will likely increase – a scenario that could benefit gold significantly as a non-yielding asset.

USDJPY – Downtrend Continues, 143.500 Is the Key ZoneUSDJPY is moving within a clear descending channel and is now approaching the strong resistance area at 143.500 – where the EMA 34, EMA 89, and the upper trendline all converge.
Historically, each time price touched this zone, a strong rejection followed. If the same happens again, we could see a move back down to 142.000 and potentially 140.500.
On the fundamental side, the recently released U.S. ISM Services data disappointed, fueling expectations that the Fed might cut rates sooner – adding bearish pressure to the USD.
Preferred scenario: watch for price reaction around 143.500 to enter a short position in line with the downtrend.

EURUSD – Lower highs emerging, bearish signal in sight?Although the lower-than-expected jobless claims forecast could support a mild USD recovery, EURUSD is still holding above the EMAs in the short term. However, signs of weakness have begun to appear as price continues to get rejected around the 1.14800 zone – which aligns with a descending trendline that has been tested multiple times.
Currently, EURUSD is forming a lower high pattern on the H4 chart, indicating growing selling pressure. If this pattern continues and price breaks below the 1.13800 area, a deeper correction toward the 1.13600 support zone could be triggered. This level has repeatedly supported price in the past and coincides with the confluence of the 34 and 89 EMAs.

EURUSD – Strong push but might run out of steamEURUSD has just bounced nicely off the 1.13400 support zone. Price is now climbing back toward the previous high around 1.14500 – which looks promising, but also comes with some risk. This is a level that previously triggered a strong reversal, so if price fails to break through again, a pullback toward the lower EMA region is quite possible.
On the chart, I can see price approaching the upper boundary of the ascending channel, while buying momentum seems to be fading. If we see a reversal candlestick pattern or long upper wicks forming in this area, it might be an early sign of a short-term drop.
What about the news? The latest JOLTS report shows job openings in the US are slowing down, raising concerns about the labor market. At the same time, US–China trade tensions are flaring up again, and President Trump's unclear remarks on tariffs are making investors more cautious with the USD.

Overview of Financial Markets Financial markets are platforms where buyers and sellers trade financial assets like stocks, bonds, currencies, and derivatives. They facilitate the movement of capital between savers and borrowers, enabling investment, risk management, and capital formation. These markets play a crucial role in the global economy by providing a mechanism for allocating funds and determining prices.

Management and Psychology Trading psychology is the emotional component of an investor's decision-making process, which may help explain why some decisions appear more rational than others. Trading psychology is characterized primarily by the influence of both greed and fear. Greed drives decisions that might be too risky.

Divergence Based Trading Divergence occurs when an asset's price and a technical indicator move in opposite directions, indicating a possible change in trend momentum. Traders use bullish or bearish divergence to anticipate reversals.
