Forex Trading (Currency Pairs)Introduction to Forex Trading
Forex trading, also known as foreign exchange trading or FX trading, is the global marketplace for buying, selling, and exchanging currencies. Unlike stock markets that operate from specific locations, the forex market is decentralized, operating electronically across banks, brokers, and financial institutions worldwide. With a daily trading volume exceeding $6 trillion, forex is the largest financial market globally, providing liquidity, leverage, and opportunities for traders across all levels.
The primary purpose of forex trading is to facilitate international trade, investment, and tourism by allowing the conversion of one currency into another. For traders, it’s a platform to profit from fluctuations in currency values. For instance, if a trader expects the US dollar to strengthen against the euro, they can buy USD and sell EUR, aiming to sell USD later at a higher rate.
Understanding Currency Pairs
At the heart of forex trading are currency pairs. A currency pair represents the value of one currency relative to another. It consists of a base currency and a quote currency. The base currency is the first currency listed, and the quote currency is the second.
Example:
EUR/USD = 1.1000
Here, EUR is the base currency, and USD is the quote currency. The price indicates that 1 Euro equals 1.1000 US dollars.
Types of Currency Pairs
Major Pairs:
These involve the most traded currencies and always include the US dollar. They are highly liquid and have tight spreads.
Examples:
EUR/USD (Euro / US Dollar)
USD/JPY (US Dollar / Japanese Yen)
GBP/USD (British Pound / US Dollar)
Minor Pairs (Cross-Currency Pairs):
These pairs do not include the US dollar but involve other major currencies. They are slightly less liquid than major pairs.
Examples:
EUR/GBP (Euro / British Pound)
AUD/JPY (Australian Dollar / Japanese Yen)
Exotic Pairs:
These involve a major currency and a currency from an emerging market. They are less liquid and have wider spreads, making them riskier.
Examples:
USD/TRY (US Dollar / Turkish Lira)
EUR/ZAR (Euro / South African Rand)
How Forex Trading Works
Forex trading is essentially about speculation on currency price movements. The trader decides whether to buy (go long) or sell (go short) a currency pair based on market analysis.
Example:
If a trader believes the EUR will strengthen against the USD, they buy EUR/USD.
If the EUR rises in value against the USD, the trader profits by selling the pair at a higher price.
Bid and Ask Prices
Every currency pair has a bid and an ask price:
Bid Price: The price at which a trader can sell the base currency.
Ask Price: The price at which a trader can buy the base currency.
Spread: The difference between the bid and ask prices. Brokers earn profit from this spread.
Pips, Lots, and Leverage
Pip (Percentage in Point):
A pip is the smallest price movement in a currency pair. For most pairs, one pip equals 0.0001 of the quoted price.
Example: If EUR/USD moves from 1.1000 to 1.1005, it has moved 5 pips.
Lot Sizes:
Forex trades are conducted in lots, representing the volume of the trade:
Standard Lot = 100,000 units of base currency
Mini Lot = 10,000 units
Micro Lot = 1,000 units
The size determines the monetary value of each pip.
Leverage:
Forex brokers allow traders to control large positions with a small amount of capital, known as leverage. For example, with 1:100 leverage, a $1,000 account can control $100,000 in currency. While leverage amplifies profits, it also increases the risk of losses.
Factors Influencing Currency Prices
Forex prices are influenced by a complex mix of economic, political, and market factors:
Economic Indicators:
GDP growth, inflation rates, employment data, and trade balances can strengthen or weaken a currency.
Example: Strong US job growth can increase demand for USD.
Central Bank Policies:
Interest rates set by central banks like the Federal Reserve (US) or the European Central Bank influence currency value. Higher interest rates tend to strengthen a currency.
Political Stability:
Political events, elections, and geopolitical tensions create volatility in forex markets.
Market Sentiment:
Traders’ collective perception of risk affects currency demand. Safe-haven currencies like USD, JPY, and CHF rise in times of uncertainty.
Forex Trading Strategies
Traders use a variety of strategies to profit from forex markets:
Technical Analysis:
Uses charts, patterns, and indicators like moving averages, RSI, and MACD to predict price movements.
Popular among day traders and scalpers.
Fundamental Analysis:
Focuses on economic and political factors that affect currency values.
Common for swing trading and longer-term trades.
Trend Trading:
Traders identify the direction of a market trend and trade in that direction.
“The trend is your friend” is a common saying.
Range Trading:
Involves buying at support levels and selling at resistance levels when markets move sideways.
News Trading:
Traders react to economic news, central bank announcements, and geopolitical events to capitalize on volatility.
Risk Management in Forex
Forex trading is highly leveraged and volatile, making risk management critical:
Stop-Loss Orders:
Automatically closes a position at a predetermined loss level to prevent larger losses.
Take-Profit Orders:
Closes a trade automatically when a target profit is reached.
Position Sizing:
Determines how much of your capital is risked on a single trade.
Diversification:
Trading multiple currency pairs reduces exposure to a single currency’s volatility.
Advantages of Forex Trading
High Liquidity: Easy to enter and exit trades with minimal slippage.
24-Hour Market: Opens Sunday evening and closes Friday evening, accommodating global trading.
Low Transaction Costs: Most brokers charge only the spread.
Leverage Opportunities: Traders can control large positions with small capital.
Diverse Strategies: Day trading, swing trading, scalping, and automated trading are possible.
Challenges and Risks
High Volatility: Sudden swings can result in significant losses.
Leverage Risk: Amplifies both gains and losses.
Emotional Trading: Fear and greed can impair judgment.
Market Complexity: Requires continuous learning and monitoring.
Broker Risk: Choosing an unregulated broker can result in fraud or withdrawal issues.
Conclusion
Forex trading through currency pairs is a dynamic, fast-paced financial market that offers tremendous opportunities for profit, but also significant risks. Understanding the mechanics of currency pairs, pip calculations, leverage, and market influences is essential for success. Combining technical and fundamental analysis with strong risk management strategies allows traders to navigate this complex market.
While forex trading is accessible, it requires discipline, education, and a clear strategy. Traders who master the art of analyzing currency movements, controlling risk, and remaining emotionally disciplined can benefit from the immense liquidity and global opportunities that forex offers. For beginners, starting with demo accounts and gradually moving to live trading while learning from each trade is the most prudent approach.
Forexpositive

Forex (Currency) Market TrendsThe Foreign Exchange (Forex) market is the world’s largest and most liquid financial market, with daily trading volumes exceeding USD 7 trillion. Unlike stock markets, Forex operates 24 hours a day, five days a week, connecting major financial centers such as London, New York, Tokyo, and Sydney. Currency prices constantly fluctuate due to changes in economic conditions, interest rates, geopolitical events, and market sentiment. Understanding Forex market trends is essential for traders, investors, policymakers, and businesses involved in international trade.
What Are Forex Market Trends?
A Forex market trend refers to the general direction in which a currency pair moves over a certain period. Trends can be observed on any timeframe—minutes, hours, days, or even years—depending on the trading or investment horizon.
Forex trends are typically classified into three main types:
Uptrend – A currency pair forms higher highs and higher lows, indicating strengthening of the base currency.
Downtrend – A currency pair forms lower highs and lower lows, indicating weakening of the base currency.
Sideways (Range-bound) – Prices move within a defined range without a clear directional bias.
Identifying trends allows traders to align their strategies with market momentum rather than trading against it.
Major Drivers of Forex Market Trends
1. Interest Rates and Monetary Policy
Interest rates are the single most powerful driver of long-term currency trends. Central banks such as the US Federal Reserve, European Central Bank (ECB), Bank of England (BoE), and Bank of Japan (BoJ) influence currency values through monetary policy.
Higher interest rates attract foreign capital, strengthening the currency.
Lower interest rates reduce returns, weakening the currency.
For example, when the US Federal Reserve raises rates, the USD tends to appreciate, especially against currencies with lower yields like the Japanese Yen.
2. Economic Growth and Macroeconomic Data
Economic indicators shape expectations about a country’s future performance and influence currency demand. Key data includes:
GDP growth
Inflation (CPI, PPI)
Employment reports (Non-Farm Payrolls)
Manufacturing and services PMIs
Retail sales
Strong economic data usually supports a currency, while weak data leads to depreciation. Long-term Forex trends often mirror relative economic strength between two countries.
3. Inflation Trends
Inflation directly affects purchasing power and central bank policy decisions. Moderate inflation is healthy, but excessive inflation erodes currency value.
Rising inflation → Potential rate hikes → Currency appreciation
Falling inflation → Rate cuts → Currency depreciation
Forex traders closely monitor inflation trends because they often precede major policy shifts.
4. Geopolitical Events and Global Risk Sentiment
Geopolitical tensions, wars, trade disputes, elections, and sanctions can dramatically shift Forex trends.
In times of uncertainty, investors seek safe-haven currencies like USD, CHF, and JPY.
Risk-on environments favor higher-yielding and emerging market currencies.
For instance, during global crises, the US Dollar often strengthens due to its reserve currency status.
5. Trade Balances and Capital Flows
Countries with trade surpluses generally experience stronger currencies, while those with deficits may face depreciation.
Export-driven economies (Germany, China, Japan) benefit from strong global demand.
Capital inflows into equities and bonds also boost currency demand.
Sustained trade imbalances can create long-term structural Forex trends.
Types of Forex Market Trends by Time Horizon
Short-Term Trends
Short-term trends last from minutes to days and are influenced by:
Economic news releases
Central bank speeches
Market sentiment and speculation
Technical factors such as breakouts
Day traders and scalpers focus on these trends using technical indicators and price action.
Medium-Term Trends
Medium-term trends can last from weeks to months and are driven by:
Shifts in interest rate expectations
Economic cycles
Policy changes
Seasonal patterns
Swing traders often capitalize on these trends by combining technical analysis with macro fundamentals.
Long-Term Trends
Long-term Forex trends may last for years and reflect:
Structural economic differences
Long-term monetary policy divergence
Demographic and productivity changes
Global reserve currency dynamics
Examples include the multi-year strength of the USD during tightening cycles or prolonged weakness of currencies facing economic stagnation.
Technical Analysis and Forex Trends
Technical analysis plays a major role in identifying and confirming Forex trends. Common tools include:
Moving Averages (50, 100, 200 periods)
Trendlines and Channels
ADX (Average Directional Index) to measure trend strength
MACD for momentum confirmation
RSI for identifying trend continuation or exhaustion
Trend-following strategies such as moving average crossovers and breakout trading are widely used in Forex markets due to their strong trending nature.
Fundamental vs Sentiment-Driven Trends
Fundamental Trends
These are based on economic realities like growth, inflation, and interest rates. They tend to be slower but more sustainable.
Sentiment-Driven Trends
These emerge from market psychology, speculation, and positioning. They can move quickly but are often prone to sharp reversals.
Successful traders learn to distinguish between the two and avoid chasing sentiment-driven moves without confirmation.
Forex Trends in Emerging Markets
Emerging market currencies are influenced by:
Global liquidity conditions
Commodity prices
Political stability
Foreign investment flows
They tend to be more volatile and trend strongly during global risk-on or risk-off phases. For example, rising oil prices can strengthen commodity-linked currencies, while capital outflows can cause rapid depreciation.
Challenges in Trading Forex Trends
Despite their popularity, Forex trends are not always easy to trade. Common challenges include:
False breakouts
Sudden news-driven reversals
Central bank intervention
High leverage amplifying losses
Risk management, proper position sizing, and patience are essential when trading trends.
Conclusion
Forex market trends reflect the complex interaction of economic fundamentals, monetary policy, geopolitical forces, and market psychology. Understanding these trends helps traders align with dominant market forces instead of fighting them. While short-term price movements may appear random, sustained Forex trends often tell a deeper story about economic strength, policy direction, and global capital flows.
By combining trend analysis, technical tools, and fundamental insight, traders can better navigate the dynamic Forex market and make informed decisions. In a market that never sleeps, trend awareness is not just an advantage—it is a necessity.

Forex (Currency) Trading: A Comprehensive OverviewIntroduction
Forex, short for “foreign exchange,” is the largest and most liquid financial market in the world. Unlike stock markets, Forex operates 24 hours a day, five days a week, and involves the trading of currencies. It is a decentralized global marketplace where currencies are bought, sold, and exchanged at fluctuating prices. Forex trading is essential for international trade, investment, and global business, as it allows companies, governments, and individuals to convert one currency into another.
The Forex market is unique because it is over-the-counter (OTC), meaning transactions occur directly between participants, usually via electronic trading platforms or over the phone, rather than centralized exchanges like the NYSE or NASDAQ.
How Forex Trading Works
In Forex trading, currencies are quoted in pairs, such as EUR/USD, USD/JPY, or GBP/USD. The first currency in the pair is called the base currency, and the second is the quote currency. The price of a currency pair represents how much of the quote currency is needed to buy one unit of the base currency. For example, if EUR/USD = 1.1000, it means 1 Euro costs 1.10 US dollars.
Key Concepts:
Bid and Ask Price:
The bid price is the price at which the market is willing to buy a currency.
The ask price is the price at which the market is willing to sell a currency.
The difference between them is called the spread, which represents the broker’s profit.
Leverage and Margin:
Forex brokers offer leverage, allowing traders to control large positions with a small amount of capital. For example, 50:1 leverage allows a trader to control $50,000 with just $1,000.
Margin is the amount of money a trader must deposit to open a leveraged position. While leverage can amplify profits, it can also magnify losses, making risk management critical.
Lot Sizes:
Forex trades are executed in standard sizes called lots:
Standard Lot: 100,000 units of base currency
Mini Lot: 10,000 units
Micro Lot: 1,000 units
Nano Lot: 100 units
Choosing the right lot size is essential to balance potential profits with risk.
Pips and Pip Value:
A pip (percentage in point) is the smallest price movement in a currency pair. Most currency pairs are quoted to four decimal places, so 0.0001 USD is one pip for pairs like EUR/USD. Traders use pips to measure gains or losses.
Participants in the Forex Market
The Forex market includes a wide range of participants:
Central Banks and Governments:
They intervene to stabilize their national currency or implement monetary policy. For example, the Federal Reserve may buy or sell dollars to influence the USD’s value.
Commercial Banks and Financial Institutions:
They provide liquidity and trade on behalf of clients or for proprietary profit.
Corporations:
Companies engaged in international trade use Forex to hedge currency risk. For example, an Indian exporter receiving payments in USD might convert it to INR.
Retail Traders:
Individual traders speculate on currency price movements to profit. Retail Forex trading has grown rapidly thanks to online platforms and leverage.
Types of Forex Trading
Forex trading can be approached in multiple ways:
Spot Forex:
The immediate exchange of currencies at the current market price. Most retail traders participate in the spot market.
Forward Forex Contracts:
Agreements to exchange currencies at a future date and at a predetermined rate. Often used by corporations to hedge risk.
Futures Forex Contracts:
Standardized contracts traded on exchanges like CME, specifying the amount, price, and delivery date for currencies.
Options and CFDs:
Options give the right, but not the obligation, to buy or sell a currency at a future date.
CFDs (Contracts for Difference) allow speculation on currency movements without owning the actual currency.
Major, Minor, and Exotic Currency Pairs
Currencies are categorized based on liquidity and popularity:
Major Pairs:
Include the most traded currencies, always involving USD, e.g., EUR/USD, USD/JPY, GBP/USD, USD/CHF.
Minor Pairs (Crosses):
Pairs that do not include USD, e.g., EUR/GBP, AUD/NZD.
Exotic Pairs:
Combinations of a major currency with a currency from an emerging market, e.g., USD/TRY (US Dollar/Turkish Lira). Exotics tend to be more volatile and less liquid.
Factors Affecting Currency Prices
Currency prices fluctuate due to multiple factors:
Economic Indicators:
GDP growth, employment data, inflation, and trade balances influence currency value.
Central Bank Policy:
Interest rates and monetary policy decisions impact currency strength.
Political Stability:
Elections, geopolitical tensions, and policy changes create volatility.
Market Sentiment:
Traders’ perceptions, speculation, and risk appetite drive short-term movements.
Global Events:
Natural disasters, pandemics, and trade agreements can cause sharp currency swings.
Trading Strategies
Technical Analysis:
Traders analyze charts, trends, support/resistance levels, and indicators (RSI, MACD, moving averages) to predict price movements.
Fundamental Analysis:
Focuses on macroeconomic data, interest rates, and geopolitical events to make trading decisions.
Trend Following:
Traders follow prevailing market trends, buying in an uptrend and selling in a downtrend.
Range Trading:
Profiting from price fluctuations within defined support and resistance levels.
Scalping and Day Trading:
Short-term strategies focusing on small price movements, often using high leverage.
Risks in Forex Trading
While Forex trading offers opportunities, it is high-risk:
Leverage Risk:
Amplifies both profits and losses. A wrong trade can wipe out an account quickly.
Market Risk:
Unpredictable economic or geopolitical events can cause sudden swings.
Interest Rate Risk:
Changes in interest rates affect currency valuations.
Liquidity Risk:
Some exotic currencies may lack liquidity, leading to difficulty entering or exiting positions.
Psychological Risk:
Emotions like fear and greed can lead to impulsive trading decisions.
Advantages of Forex Trading
High Liquidity:
Trillions of dollars are traded daily, ensuring easy entry and exit.
24-Hour Market:
Traders can trade around the clock, accommodating different time zones.
Leverage Opportunities:
Allows small capital to control large positions.
Diverse Strategies:
Forex supports long-term investing, day trading, swing trading, and scalping.
Conclusion
Forex trading is a dynamic and complex financial market that offers vast opportunities for profit, hedging, and international business operations. However, its decentralized nature, high leverage, and rapid fluctuations make it a high-risk endeavor requiring knowledge, discipline, and a robust risk management strategy. Successful Forex traders combine technical and fundamental analysis, stay updated with global economic events, and maintain emotional control to navigate the market effectively.
In today’s digital era, retail traders have unprecedented access to Forex through online platforms, brokers, and educational resources. While it can be rewarding, Forex trading is not a “get-rich-quick” scheme—it demands patience, continuous learning, and practical experience. Understanding market mechanics, currency behavior, and risk management is key to achieving long-term success in this fast-paced and fascinating financial world.

Gold (XAU/USD) 30-Minute: Liquidity Grab Setup with Order Block1. Current Price Structure
Price is trending upward on the 30-min timeframe.
Recent candles show higher highs and higher lows, indicating short-term bullish pressure.
2. Liquidity Zone & Order Block
The grey shaded area marked as “liquidity + orderblock” is a confluence zone where stops and institutional orders are likely clustered.
Expect price to revisit this area for a shake-out of weak hands before moving higher.
The up arrow suggests that this zone could act as a launchpad for the next bullish leg.
3. Potential Pullback and Continuation
The scrawled black path shows a probable scenario:
Minor pullback to liquidity/order block area
Support test on the trendline or zone
Followed by a rejection and bullish continuation
4. Key Indicators
EMA 9 (blue) is below current price — supports short-term bullish momentum.
Ichimoku cloud is mostly supportive, with price above key lines (suggests trend stamina).
5. Resistance Ahead
The horizontal red zone near ~4,353 to 4,382 is a major supply area.
A breakout above this would confirm bullish continuation.
However, failure there could lead to deeper pullbacks.
🔥 Summary Bias
Bullish (higher probability setup)
Price is likely to:
Pull back to the support or order block area
Grab liquidity
Rally toward or above the resistance zone
🎯 Key Levels to Watch
Level Significance
~4,353 – 4,382 Major resistance / breakout target
Order Block Zone Liquidity grab & support
Trendline (rising) Dynamic support
EMA 9 Short-term support

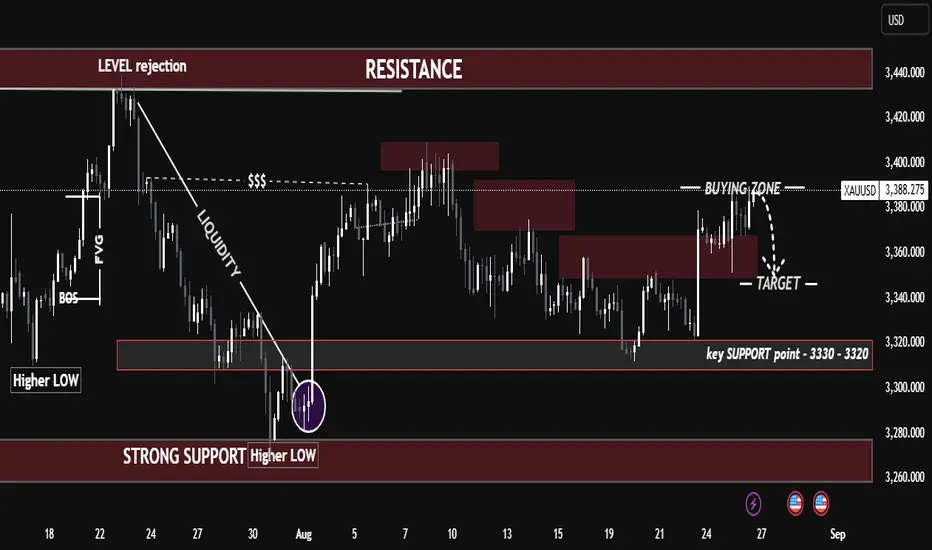
"Gold Setup: Buying Zone Rejection or Breakout Ahead?""Gold Setup: Buying Zone Rejection or Breakout Ahead?"
Gold is currently trading inside a buying zone (3380 – 3400) but facing rejection. Market structure is still holding higher lows, which keeps the bigger trend bullish, but short-term price action suggests a possible retracement move.
Resistance Zone: 3420 – 3440 (strong supply, previous rejection)
Key Support: 3330 – 3320 (major demand, higher low base)
Immediate Target: 3340 – 3360 (if rejection continues)
📉 Short-term bias: bearish correction toward 3340 – 3360
📈 Swing bias: bullish as long as 3330 – 3320 holds
🔑 My View:
I’ll be watching how price reacts around 3330 – 3320. Holding this level could trigger the next bullish leg toward 3420 – 3440. Losing it opens the door for deeper downside into 3280.
EUR/USD 1-Hour Rising Channel – Support Zone & Potential Upside!Chart Breakdown & Technical Insights
Rising Channel Structure
The chart clearly shows EUR/USD trading within a rising channel, marked by higher highs (red arrows) and higher lows (green arrows) forming parallel support and resistance trendlines.
Key Support Zone & Bounce Potential
The price is currently sitting near the ascending trendline support, highlighted by the shaded gray box and emphasized with a circled area. Many analysts note that this lower boundary—around the 1.1690 level—serves as crucial support on a broader time frame
.
Short-Term Momentum Indicators
According to recent technical calls, EUR/USD maintains a short-term bullish bias in the rising channel. However, some momentum indicators, such as RSI, hint at weakening strength—particularly when higher price highs are not matched with higher RSI peaks, suggesting a bearish divergence
.
Potential Upside Trajectory
Should the lower channel support hold, the chart suggests a rebound toward mid-channel or potentially up to the upper boundary. Analysts highlight the 1.1720–1.1750 area as a near-term resistance, with the upper channel boundary closer to 1.1850
.
Alternative Scenario – Breakdown Risk
If EUR/USD breaks below the channel (below ~1.1690), the bullish structure may falter. That could expose the pair to deeper pullbacks, possibly testing lower support levels around 1.1650 or lower
.
** Summary Table**
Scenario Likely Outcome
Bounce off support Move up toward mid-channel (~1.172) or channel top (~1.185)
Breakdown below support Decline toward lower support zones (1.1650 and below)
Conclusion & Strategy Snapshot
The price is positioned at a critical support within a well-defined rising channel.
The bullish favored path: a rebound from the lower trendline toward resistance levels.
The bearish risk: a breakdown would shift momentum, possibly leading to deeper retracements.
Monitor for price action signals (e.g. bounce, candlestick patterns), RSI behavior, and behavior around these key levels.

Gold Price Faces Key Resistance — Can Bulls Break $3,440?The XAU/USD (Gold vs. USD) 1-hour chart shows a strong bullish structure within an upward channel, supported by higher highs and a recent ATH (All-Time High) retest.
Resistance Zone: $3,410 – $3,440 is acting as a significant supply area. Price may face selling pressure here.
Support Levels: First support lies near $3,300 (supply zone), followed by the $3,225–$3,250 demand zone.
Trend: The price is respecting the upward trendline, but a break below could trigger a retest of the green supply zone.
Bullish Scenario: A breakout and close above $3,440 could lead to a continuation toward $3,475+.
Bearish Scenario: Rejection from the resistance zone with a break below $3,300 could push price toward the $3,225 support.
Overall, gold is currently in a bullish trend, but needs to overcome the $3,440 barrier for further upside momentum.

Gold (XAU/USD) in Symmetrical Triangle – Short‑Term Squeeze,Price Structure & Technical Setup
Gold is consolidating within a symmetrical triangle, showing lower highs and higher lows—a classic precursor to breakout in either direction
Fxglory Ltd
+5
TradingView
+5
Babypips.com
+5
TradingView
+2
Babypips.com
+2
TradingView
+2
.
Trendlines converge tightly around $3,326–$3,334, hinting at imminent directional acceleration
Investopedia
+4
TradingView
+4
TradingView
+4
.
🎯 Key Levels & Targets
Scenario Trigger Confirm Area Targets Stop Loss
Bullish Breakout above $3,344–$3,350 $3,369 → $3,396 → $3,422–$3,550 ~$3,340
Bearish Breakdown below ~$3,326–$3,320 $3,320 → $3,300 → $3,297 → $3,255 ~$3,335–$3,340
A breakout above $3,344–$3,350 validated with volume may drive prices toward $3,400+, with extended targets up to $3,550 or higher in bullish conditions
Traders Union
Time Price Research
.
A drop below $3,326–$3,320 risks further decline, targeting $3,300, $3,297, and eventually $3,255 if breakdown momentum builds .
📉 Market Context & Drivers
U.S. dollar strength, easing safe-haven demand, and optimistic trade sentiment are constraining gold’s upside unless breakout forces emerge .
Key upcoming catalysts: FOMC guidance, U.S. macro data (GDP, inflation), and geopolitical developments—their tone could tip the bias direction .
⚙️ Trade Rules & Risk Management
Wait for a confirmed breakout or breakdown—do not trade mid-range.
Confirm break with at least one close outside the triangle and rising volume .
Position sizing: Risk 1–2% per trade, adjust stop-loss to price structure ($8–$15 depending on volatility).
Take profits in stages: scale out at minor milestones (first targets), trail stop for extended targets.
Avoid chasing price within the middle of the triangle—risk/reward is unfavorable.
🧠 Why This Plan?
Follows textbook symmetrical triangle trading methodology: entry on breakout, stop beyond pattern opposite side, projection based on triangle height .
Aligns with broader outlook: bearish unless convincing upside breakout appears, consistent with analyst consensus hedging current bull exhaustion and wait‑and‑see on policy signals .
✅ Summary
Gold is coiling inside a tight triangle range near $3,326–$3,334, with breakout potential identified to either side:
Bullish breakout over $3,344–$3,350 targets up to $3,550 or beyond.
Bearish breakdown under $3,326–$3,320 risks slide towards $3,300–$3,255.
Wait for confirmation, apply disciplined risk controls, and let volume validate the move.

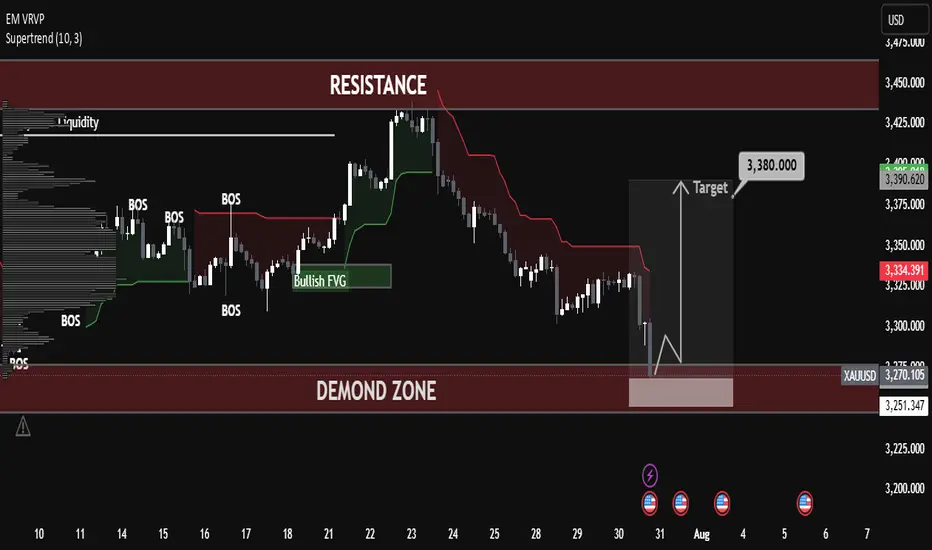
Gold Took Support – Now Bulls Are in Control! Gold Took Support – Now Bulls Are in Control!
Gold (XAUUSD) price has taken a strong bounce from the support zone, and now it’s looking bullish. Market reacted nicely from the demand zone, which means buyers are stepping in again.
📊 Technical Analysis:
✅ Strong Support Zone (3260–3280):
This area is acting like a strong base. Price touched here and immediately bounced — showing buying pressure.
🔄 Break of Structure (BOS):
Market broke the previous structure and gave signs of trend reversal. It also grabbed liquidity from the lows.
🟩 Bullish Fair Value Gap (FVG):
A clean FVG was formed and respected, which shows institutional activity and buying interest.
🎯 Target Level – 3366.984 USD:
If bullish momentum continues, gold can easily move towards this level. It’s also near a previous resistance.
📚 Educational Points:
Market took liquidity from the lows and reversed
Fair Value Gap is respected, adding confirmation
Structure break confirms buyers are in control
Price is heading towards the next resistance zone
📌 Conclusion:
Gold is now in a bullish phase. As long as the support zone is holding, buyers can stay confident. Target remains near 3366–3380 USD. Any pullback can give a good buy opportunity.
Part 1: How to Analyze Events in the Forex Market?
The forex market is one of the most dynamic and volatile financial markets in the world. It is deeply influenced by global events, economic data, and geopolitical developments. Traders who understand how to analyze these events can make informed decisions and capitalize on market movements.
Influence Of the Global Events:
The forex market is directly linked to global economic health. Since currencies represent the economies of their respective countries, any significant event like an interest rate decision, inflation data, or geopolitical conflict. It can cause major fluctuations in currency prices. Here’s global events play important role:
- Central Bank Policies: When the Federal Reserve (Fed) or European Central Bank (ECB) changes interest rates, it impacts global liquidity and investment flows.
- Economic Data Releases: GDP growth, inflation, and employment reports provide insights into economic stability, affecting investor confidence.
- Geopolitical Events: Wars, elections, trade agreements, and diplomatic conflicts impact currency demand and risk sentiment.
What Happens When News Is Published?
When a major economic event or news release occurs, the forex market reacts instantly. Here’s the typical stages of events:
Stage 1: Market Expectations: Before the news release, traders anticipate the outcome based on forecasts. The market often prices in expectations.
Stage 2: Immediate Volatility: If the actual data differs from the forecast, there’s a sharp price movement in the affected currency pairs.
Stage 3: Liquidity Fluctuations: Spreads widen, and liquidity dries up momentarily as traders rush to execute orders.
Stage 4: Short-Term Correction: After the initial reaction, the market stabilizes, and price action follows the broader trend.
Major Events:
Central Bank Meetings – Institutions like the Fed, ECB, BoJ, and BoE set monetary policies. Interest rate hikes strengthen a currency, while rate cuts weaken it. Forward guidance also plays a role in shaping long-term trends.
Inflation Reports (CPI & PPI): These measure inflation levels, influencing central bank decisions. Higher inflation often leads to interest rate hikes, strengthening the currency, while lower inflation may result in monetary easing, weakening it.
Employment Data (NFP & Job Reports) – The US Non-Farm Payrolls (NFP) report is a key indicator. Strong job growth supports a stronger USD, while weak employment data signals economic trouble.
GDP Growth Reports –:A higher-than-expected GDP growth rate boosts investor confidence and strengthens the currency, while economic contraction leads to depreciation.
Political & Geopolitical Events: Elections, government policies, trade wars, and conflicts create uncertainty, often pushing investors toward safe-haven currencies like the USD, JPY, or CHF.
One's Loss, Another's Win:
When the U.S. releases strong economic data, such as higher-than-expected GDP growth, strong job reports (NFP), or an interest rate hike by the Federal Reserve, The demand for the U.S. dollar increases. This leads to USD appreciation against other currencies, including the euro.
For example,
---> EUR/USD falls : USD is gaining strength, it takes fewer dollars to buy 1 euro, causing the EUR/USD exchange rate to drop.
---> USD/EUR rises : USD is now wortth more, the inverse exchange rate (USD/EUR) increases, meaning 1 USD can now buy more euro.
Key strategies for trading events:
•Stay Ahead with an Event Calendar: Keep track of important economic events and central bank meetings to anticipate potential market-moving news.
• Gauge Market Expectations: Understand forecasts and market sentiment before the event to predict how the market might react.
• Implement Stop-Loss Orders: Protect your trades from excessive risk by setting stop-loss orders to cap potential losses during volatile moves.
• Wait for Market Stability: Allow the market to settle after the event to avoid getting caught in the initial volatility and better assess the trend.
• Evaluate the Market’s Response: Assess the immediate market reaction to the event to identify if the initial price move is sustainable or a short-term spike.
Drawbacks of Trading News:
High Volatility & Whipsaws: Prices can spike in both directions before settling on a trend, leading to stop-loss hunting.
Widened Spreads: During news releases, brokers often widen spreads, increasing trading costs.
Slippage: Rapid price movements can lead to orders being executed at unexpected prices.
Emotional Trading: Sudden market swings can trigger impulsive decisions, leading to losses.
Market Manipulation: Big players and institutions often move the market unpredictably before major news releases.
In the next part, we will focus on the specific events and strategies.

NAS100 SHOWING A GOOD UP MOVE WITH 1:5 RISK REWARD NAS100 SHOWING A GOOD UP MOVE WITH 1:5 RISK REWARD
DUE TO THESE REASON
A. its following a rectangle pattern that stocked the market
which preventing the market to move any one direction now it trying to break the strong resistant lable
B. after the break of this rectangle it will boost the market potential for break
C. also its resisting from a strong neckline the neckline also got weeker ald the price is ready to break in the outer region
all of these reason are indicating the same thing its ready for breakout BREAKOUT trading are follws good risk reward
please dont use more than one percentage of your capitalfollow risk reward and tradeing rules
that will help you to to become a bettertrader
thank you

EURJPY SHOWING A GOOD UPWARDMOVE WITH 1:10 RISK REWARD EURJPY SHOWING A GOOD UPWARD MOVE WITH 1:10 RISK REWARD
DUE TO THESE REASON
A. its following a rectangle pattern that stocked the market
which preventing the market to move any one direction now it trying to break the strong resistant lable
B. after the break of this rectangle it will boost the market potential for break
C. also its resisting from a strong neckline the neckline also got weeker ald the price is ready to break in the outer region
all of these reason are indicating the same thing its ready for breakout BREAKOUT trading are follws good risk reward
please dont use more than one percentage of your capitalfollow risk reward and tradeing rules
that will help you to to become a bettertrader
thank you

GBPJPY SHOWING A GOOD D UP MOVE WITH 1:10 RISK REWARD GBPJPY SHOWING A GOOD D
UP MOVE WITH 1:10 RISK REWARD
DUE TO THESE REASON
A. its following a rectangle pattern that stocked the market
which preventing the market to move any one direction now it trying to break the strong resistant lable
B. after the break of this rectangle it will boost the market potential for break
C. also its resisting from a strong neckline the neckline also got weeker ald the price is ready to break in the outer region
all of these reason are indicating the same thing its ready for breakout BREAKOUT trading are follws good risk reward
please dont use more than one percentage of your capitalfollow risk reward and tradeing rules
that will help you to to become a bettertrader
thank you

EURJPYSHOING A GOOD UP MOVE WITH 1:10 RISK REWARDEURJPYSHOING A GOOD UP MOVE WITH 1:10 RISK REWARD
DUE TO THESE REASON
A. its following a rectangle pattern that stocked the market
which preventing the market to move any one direction
niw it trying to break the strong resistant lable
B. after the break of this rectangle it will bost the market potential for break
C. also its resisting from a strong neckline the neckline also got weeker ald the price is ready to break in the outer region
all of these reason are indicating the same thing its ready for breakout
BREAKOUT trading are follws good risk reward
please dont use more than one percentage of your capital
follow risk reward and tradeing rules
that will help you to to become a better trader
thank you
DUE TO THESE REASON
A. its following a rectangle pattern that stocked the market
which preventing the market to move any one direction
niw it trying to break the strong resistant lable
B. after the break of this rectangle it will bost the market potential for break
C. also its resisting from a strong neckline the neckline also got weeker ald the price is ready to break in the outer region
all of these reason are indicating the same thing its ready for breakout
BREAKOUT trading are follws good risk reward
please dont use more than one percentage of your capital
follow risk reward and tradeing rules
that will help you to to become a better trad

Short term trading strategy for todayWorld gold prices increased more than 1% to the highest level in nearly two weeks in the trading session on Wednesday (July 3) due to increasing expectations that the US Federal Reserve (Fed) will cut interest rates. in September, after recent US data showed the labor market was weakening.
Closing the session, daily gold price increased 1.2% to 2,357.06 USD an ounce. US gold futures rose 1.5% to $2,369.40
Spot gold price increased 0.01% to 2,356 USD/ounce, according to Kitco, while gold price for August delivery decreased 0.16% to 2,365 USD.
Precious metals as well as base metals are rallying across the board as ADP data and unemployment claims add to the 'weakening economy' sentiment, which could potentially lead to a first interest rate cut in September".

Gold is waiting for market fluctuationsGold costs will remain caught until "some thing shakes up the marketplace as a whole."
to get better again to 2,340 USD/ounce. This absolutely offset final week`s losses.
Investors need to now no longer promote at the moment due to the fact "in case you are preserving gold long-term, there's no purpose to promote due to the fact the charge remains above 2,2 hundred USD/ounce".
maximum humans are having impartial predictions gold
The US economic system is slowing down, inflation is vulnerable and americaA Federal Reserve (Fed) is much less dovish. These affects lessen call for for gold, that may cause a huge promote-off.
If you're preserving gold, there's no purpose to promote due to the fact the charge remains above 2,2 hundred USD/ounce.
The marketplace might also additionally have few transactions, because of this that the hazard of big fluctuations. Geopolitical trends consisting of escalation in Ukraine or the Middle East ought to disrupt the marketplace, Grady said.

XAU price will continue to be stuckGold prices will continue to be stuck until "something shakes up the market as a whole."
to recover back to 2,340 USD/ounce. This fully offset last week's losses.
Investors should not sell at this time because "if you are holding gold long-term, there is no reason to sell because the price is still above 2,200 USD/ounce".

XAU trading strategy when USD is highIn the market, investors are currently waiting for important US economic data later on June 27 on growth and unemployment data to gather more clues about the future of monetary policy. Data released earlier this week showed that US consumer confidence eased in June amid concerns about the economic outlook, but households remained optimistic about the labor market and expected to Inflation will moderate next year.

GO LONG AT AROUND 1987 ZONEYesterday after the US Cpi, Dollar moved on the upper foot and turned strong, And hence there was a short selling across on Commodities, Today we will expect an impulsive force from this level for Re-selling Gold again.

SELL XAU/USD (GOLD) at around 2033.80, With an objective of 2021We are looking to sell XAU/USD at around 2033.80 with an objective of 2021. The forex fundamentals is really affecting the price action this week. The Take Profit is to be set at around 2021. The stop losses is posted at 2038

SELL DOW JONES DJISell dow jones index at around 38387 with an objective of 300 pips target, It is reversing from a key registance level currently. Out Tp is around 38120.

SELL @ 2065 XAU/USD Corrective swing UpWe are selling at 2065 , with a target of 2048 , Set stop loss at 2072, The reaction is due to chnages in Bond market, And aftermath of Fed meeting.

We are short on BTC/USD , As we are expecting a CorrectionSell at current Price, With a Stop at around 43000 , For an objective of 41200.
