EURUSDDISCLAIMER: The Company accepts no accountability or obligation for your trading and speculation results, and you consent to hold the Company innocuous for any such outcomes or misfortunes. We are not financial advisers or account managers; We are Forex traders. The recordings on this channel are rigorously for educational and amusement purposes. Trading Forex implies dangers, and you can lose all your venture ; consequently, you exclusively must take a chance.
Forextrading

EURNZD SellDISCLAIMER: The Company accepts no accountability or obligation for your trading and speculation results, and you consent to hold the Company innocuous for any such outcomes or misfortunes. We are not financial advisers or account managers; We are Forex traders. The recordings on this channel are rigorously for educational and amusement purposes. Trading Forex implies dangers, and you can lose all your venture ; consequently, you exclusively must take a chance.

GBPAUD Sell LimitDISCLAIMER: The Company accepts no accountability or obligation for your trading and speculation results, and you consent to hold the Company innocuous for any such outcomes or misfortunes. We are not financial advisers or account managers; We are Forex traders. The recordings on this channel are rigorously for educational and amusement purposes. Trading Forex implies dangers, and you can lose all your venture ; consequently, you exclusively must take a chance.

GBPUSD Sell OrderDISCLAIMER: The Company accepts no accountability or obligation for your trading and speculation results, and you consent to hold the Company innocuous for any such outcomes or misfortunes. We are not financial advisers or account managers; We are Forex traders. The recordings on this channel are rigorously for educational and amusement purposes. Trading Forex implies dangers, and you can lose all your venture ; consequently, you exclusively must take a chance.

GBPUSD Sell OrderDISCLAIMER: The Company accepts no accountability or obligation for your trading and speculation results, and you consent to hold the Company innocuous for any such outcomes or misfortunes. We are not financial advisers or account managers; We are Forex traders. The recordings on this channel are rigorously for educational and amusement purposes. Trading Forex implies dangers, and you can lose all your venture ; consequently, you exclusively must take a chance.

today gold market hi guys
yestreday market goes crazy up and down ,we always expect that crazy movement ,i hope all of us doing good quick update on gold m15 chart
bullish targets
1901 holding above next target open on 1905
1892 holding above next target open on 1899
1886 holding above next targets open on 1889,1892,1899,1901
bearish targets
1899 holding below next targets open on 1892,1890
1889 holding below next target open on 1886,1881

GBPAUD Bullish trade opportunitiesGBPAUD Bullish trade opportunities
It recently retested a major support line and retrace and closed above the short-term resistance area here is a good opportunity to take a buy trade with good risk reward

today gold market hi guys
i hope all of us doing ,previous chart analysis playing perfectly preview on it quick update on gold m15 chart
bullish targets
1879 holding above next target open on 1885
1885 holding above next targets open on 1890
1869 holding above next targets open on 1877,1879
bearish targets
1877 holding below next targets open on 1869,1866
1866 holding below next target open on 1862

USDCHF TRADES IDEA looking at these two points of interest for possible buy/sell on usdchf for now. very clean and possible fill of imbalances.
will enter upon confirmation within poi and update here

EURNZD Sell Order
EURNZD Sell 1.68760
SL 1.69008
DISCLAIMER: The Company accepts no accountability or obligation for your trading and speculation results, and you consent to hold the Company innocuous for any such outcomes or misfortunes. We are not financial advisers or account managers; We are Forex traders. The recordings on this channel are rigorously for educational and amusement purposes. Trading Forex implies dangers, and you can lose all your venture; consequently, you exclusively must take a chance.

today gold market hi guys
i hope all of us doing good quick update on gold m15 chart
bullish targets
1869 holding above next targets open on 1877,1879
1879 holding above next target open on 1885
bearish targets
1877 holding below next targets open on 1869,1866
1866 holding below next target open on 1862


today gold market hi guys
i hope all of us doing good,quick update on gold m15 chart
bullish targets
1869 holding above next targets open on 1877,1879
1879 holding above next target open on 1885
bearish targets
1877 holding below next targets open on 1869,1866
1866 holding below next target open on 1862

SHORT EURUSD for 1:4.5 RRI clearly explained my reason for short in the chart.
At the same time I have given entry and exit point in the chart. I you have any question or any further clarification you can ask me in comment box.

today gold market hi guysi
everyone doing good ,new week begning i wish every one doing good on in this week quick update on gold m15 chart
bullish targets
1870 holding above next targets open on 1878,1885
1861 holding above next targets open on 1865,1870 1878
bearish targets
1865 holding below next targets open on 1861,1857
1857 holding below next target open on 1852

USDCHF Buy trade opportunitiesUSDCHF Buy Trade Opportunities
its an overall Bullish trend and is now its the correction phase if the market makes a good Bullish candle on support as we mark in the chart so it will be a good opportunity to Buy with good risk rewards

today gold market hi guys
i hope all of us doing good , quick update on gold chart
bullish targets
1827 holding above next targets open on 1831,18321840,1845
1832 holding above next target open on 1840,1845
1842 holding above next target open on 1847,1849
1849 holding above next targets open 1855
bearish targets
1847 holding below next target open on 1842,1839,1832,1831,1827
1839 holding below next targets open on 1832 1831 1827,1824
1831 holding below next targets open on 1827,1823,1816
1824 holding below next targets open on 1816,1814

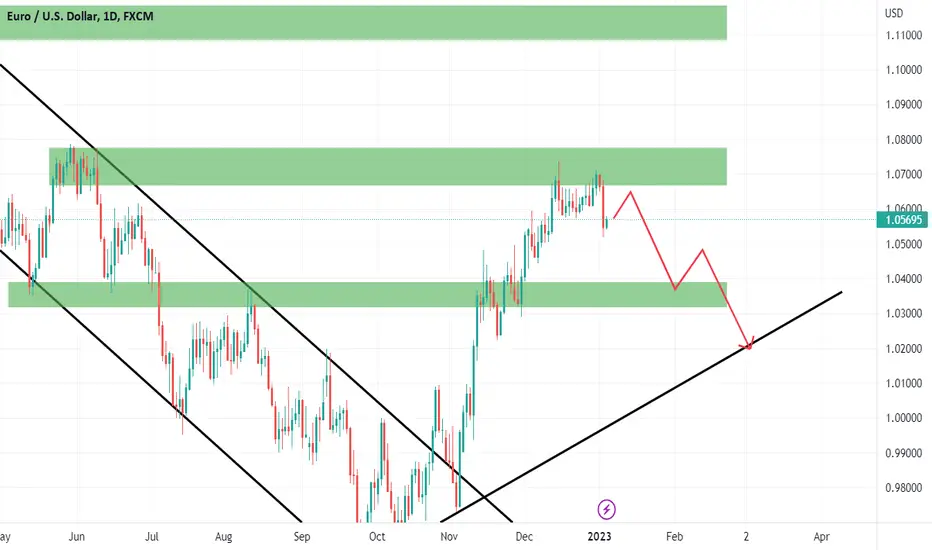
{GREAT SELL OPPORTUNITY IN EURUSD}In the daily timeframe EURUSD is consolidating since many days at the supply/resistance area. You may enter the sell to reach the target as I mentioned.
Happy trading
gold today market hi guys
i hope all of us doing good ,quick update on gold m15 chart
bullish targets
1849 holding above next targets open 1855
1842 holding above next target open on 1847,1849
1832 holding above next target open on 1840,1845
1827 holding above next targets open on 1831,18321840,1845
bearish targets
1847 holding below next target open on 1842,1839,1832,1831,1827
1839 holding below next targets open on 1832 1831 1827,1824
1831 holding below next targets open on 1827,1823,1816
1824 holding below next targets open on 1816,1814

today gold market hi guys
i hope all of us doing good,enjoyed your holidays previous year we all of us do lot of buys and sells some trade goes our favour some trades goes to opposites side get rid it off all things new year new begning dont focus i took this much trade this persentage gose our favour this persentage goes negative dont worry about this, focus your accuracy increase your self confident everything we will be fix as soon ,quick update on gold m15 chart
bullish targets
1816 holding above next targets open on 1823,1827,1831,1833
1827 holding above next targets open on 1831,18321840,1845
1832 holding above next target open on 1840,1845
bearish targets
1831 holding below next targets open on 1827,1823,1816
1824 holding below next targets open on 1816,1814

gold today markethi guys
i hope all of us doing good quick update on gold 15m chart
bullish targets
1803 holding above next targets open on 1809,1811,1817,1819
1811 holding above next targets open on 1817, 1819
1817 holding above next targets open on 1819,1822,1824
1822 holding above next targets open on 1824,1828
bearish targets
1824 holding below next targets open on 1822,1819,1817,1811,1809
1819 holding below next targets open on 1817,1811
1815 holding below next targets open on 1811,1809,1803
1800 holding below next target open on 1795

gold today market hi guys
i hope all of us doing good ,quick update on gold h1 chart
bullish targets
1803 holding above next targets open on 1809,1811,1817,1819
1811 holding above next targets open on 1817, 1819
bearish targets
1809 holding below next next targets open on 1803
1800 holding below next target open on 1795

today gold market hi guys
i hope all of us doing good ,past several weeks we are traveling with swing market its gives successful ratio on chart analysis before you started review on it, our chart simple and clear but its helps lot of it ,quick update on gold m15 chart
bullish targets
1803 holding above next targets open on 1809,1811,1817,1819
1811 holding above next targets open on 1817, 1819
1822 holding above next targets open on 1824,1828
bearish targets
1824 holding below next targets open on 1822,1819,1817,1811,1809
1819 holding below next targets open on 1817,1811
1809 holding below next next targets open on 1803
