XAUUSD (H1) – Liquidity-Based Trading XAUUSD (H1) – Liquidity-Based Trading
Price has broken the channel, but buying momentum is weakening – waiting for a pullback to the trendline for entries
Today’s Strategy Summary
Gold has broken out of its price channel, but the key point is that buying pressure is fading after the strong acceleration. With the market approaching the holiday period and liquidity thinning, the focus is on trading at the right liquidity zones rather than chasing price or FOMO.
Plan:
Look for Buy opportunities on pullbacks into the trendline / old channel
Look for Sell reactions at the Fibonacci liquidity zone 4474–4478
1) Key Levels Today (from the chart)
✅ BUY zones (liquidity pullback)
Buy Zone 1: 4379 – 4382
SL: 4373
Buy Zone 2: 4361 – 4358
SL: 4353
These are clean liquidity areas to wait for price to retrace into – true liquidity-based trading: let price come back to reaction zones, do not chase highs.
✅ SELL zone (Fibonacci liquidity)
Sell zone: 4474 – 4478
SL: 4482
This is a premium + liquidity area. If price reaches this zone and fails to hold, the probability of profit-taking or a short-term reversal is high.
2) Main Scenario: Wait for a Pullback to the Channel/Trendline to Buy
After a breakout, the market often retests the old trendline or channel to confirm genuine buying strength.
As buying momentum is weakening, the likelihood of choppy moves and liquidity sweeps is high. Patience is key – wait for 4379–4382, or a deeper pullback into 4361–4358.
Expected targets (scalp / short swing):
Capture 8–15 USD moves depending on volatility, taking partial profits as price reacts according to plan.
3) Alternative Scenario: Sell Reaction at 4474–4478
If price continues to push higher into the Fibonacci zone, priority is to Sell on reaction rather than chasing Buy entries.
Only sell if there are signs of loss of momentum (long wicks, rejection, failure to close strongly above the zone).
4) News & Market Context: Thin Liquidity = Easy Sweeps
With the market nearing the holiday period, liquidity is weak, increasing the chances of spikes and stop-hunts.
Political and economic developments related to policy and tax matters are influencing corporate positioning, but at this stage, price is more likely to react to short-term capital flows rather than a sustainable trend.
Conclusion:
Today’s focus is “right zone – strict discipline”, avoiding mid-range entries and emotional trades.
5) Risk Management
Risk per trade: maximum 1–2%
Avoid trading when spreads widen or candles spike abnormally
Which scenario do you lean towards today?
A pullback to 4379 / 4361 for Buy, or a push to 4474–4478 for a Sell reaction?
Forextrading

XAUUSD – Lana prioritises Buy on pullbacksXAUUSD – Lana prioritises Buy on pullbacks 💛
Uptrend confirmed: Lana prioritises Buy on pullbacks 💛
Quick Summary
Trend: Strong bullish, no clear signs of correction
Status: New ATH has been established
Timeframe: H1
Strategy: Focus on Buy setups, waiting for pullbacks into liquidity zones
Market Outlook
Gold is maintaining a very strong bullish momentum and continues to print new highs. When drawing the price channel, price is currently testing the upper boundary, suggesting a potential minor reaction or a short-term pullback before the uptrend resumes.
The next Fibonacci target is around 4414, which may act as a short-term technical reaction zone. However, the primary trend remains bullish.
Technical Perspective
After a strong breakout, the market often revisits liquidity or value areas before continuing higher. Lana does not chase price at elevated levels; instead, she prefers waiting for technical pullbacks to enter trades in line with the dominant trend.
Preferred Buy Trading Plan
Buy Scenario 1 – Near-term liquidity zone
Buy: 4371 – 4374
SL: 4165
This zone contains strong liquidity and is suitable for looking for bullish continuation if price pulls back slightly.
Buy Scenario 2 – Deeper pullback zone
Buy zone: 4342 – 4339
SL: 4330
If the market corrects more deeply under year-end liquidity conditions, this is Lana’s preferred zone to look for a safer entry.
Fundamental View
Spot gold has surpassed the 4,400 USD/oz level for the first time, recording a gain of nearly 68% for the year.
The bullish momentum is not limited to gold but has also spread to silver and platinum, supported by:
Expectations of further Fed rate cuts
Strong inflows into ETF funds
Net buying by central banks
Escalating geopolitical tensions
The year 2025 is closing with a very impressive picture for the precious metals sector.
Lana’s Notes 🌿
Strong uptrend → prioritise Buy on pullbacks, avoid FOMO
Always set clear stop-loss levels and reduce position size during high volatility
If price does not return to the planned zones, Lana is comfortable staying on the sidelines

EUR/USD Decision PhaseEUR/USD Decision Phase
Recent candles indicate a slowdown in upside follow-through, implying that short-term positioning may be crowded. This pause does not immediately invalidate the broader constructive tone but introduces the risk of a corrective rotation as liquidity is rebalanced. The projected move on the chart highlights a scenario where price may seek efficiency before determining the next directional leg.
Overall conditions suggest the market is transitioning from expansion into evaluation. Continuation higher would require renewed participation, while failure to attract follow-through could lead to a deeper reset driven by profit-taking and short-term repricing. Patience is advised as the market reveals whether this phase resolves through continuation or corrective realignment.
Price action reflects a market that has recently expanded after a prolonged phase of balanced participation. The sequence of higher intraday pushes shows growing initiative from buyers, supported by repeated structure continuation and shallow pullbacks, suggesting confidence rather than urgency. Momentum has remained constructive, with price spending more time advancing than correcting, a sign of controlled accumulation rather than emotional buying.
Recent candles indicate a slowdown in upside follow-through, implying that short-term positioning may be crowded. This pause does not immediately invalidate the broader constructive tone but introduces the risk of a corrective rotation as liquidity is rebalanced. The projected move on the chart highlights a scenario where price may seek efficiency before determining the next directional leg.
Overall conditions suggest the market is transitioning from expansion into evaluation. Continuation higher would require renewed participation, while failure to attract follow-through could lead to a deeper reset driven by profit-taking and short-term repricing. Patience is advised as the market reveals whether this phase resolves through continuation or corrective realignment.

XAUUSD (Gold) Technical Outlook - 18/12/2025📊 XAU/USD Quick Outlook
Gold is trading near 4,326, showing short-term weakness, but the overall trend is still bullish on higher timeframes.
🔑 Key Levels
• Support: 4,320 – 4,300
• Resistance: 4,335 – 4,345
🟢 Bullish: Above 4,320 → targets 4,345 → 4,370+
🔴 Bearish: Below 4,320 → targets 4,300 → 4,260
📌 Intraday Tip:
Sell near resistance, buy near support only after confirmation.
⚠️ Expect volatility during USD news.
⚠️ Disclaimer: This analysis is for educational purposes only. Markets are volatile—trade with proper risk management and at your own risk.

XAUUSD (H1) – Gold Trading Plan | 12/18 Waiting for CPI to ...XAUUSD (H1) – Gold Trading Plan | 12/18
Waiting for CPI to “set the direction” | Buy on a break above 4355, Sell if the trendline breaks
Strategy Summary (10-second read)
Ahead of the US CPI data, gold is likely to stay range-bound and only make a decisive move once there is clear structural confirmation. Price is still holding within an ascending channel, but volume is declining noticeably → priority is confirmed break trades, no FOMO.
Buy only if price breaks and holds above the strong resistance at 4355
Short-term Sell if the rising trendline breaks
Mid-term Sell if the key low at 4306 is broken
Key Levels (Important chart levels)
Major resistance: 4355 (the “gateway” for bullish confirmation)
Sell scalping zone: 4354–4355 (short-term reaction area)
Sell liquidity zone: 4392 (overhead sell-side liquidity)
Structural level / key low: 4306 (a break opens mid-term sell potential)
FVG / deep liquidity draw: 4248 (target if strong distribution occurs)
Scenario 1: Bullish Move
(Activated only if 4355 is broken)
Confirmation: Price breaks and holds above 4355 (preferably with a clear H1 candle close).
Buy entry: 4348
SL: 4340
TP1: 4355–4360
TP2: 4392 (sell-side liquidity zone)
Logic:
With declining volume, fake breakouts are common. Therefore, buys are only valid once price decisively clears the directional resistance at 4355.
Scenario 2: Short-term Bearish Move
(Preferred if the rising trendline breaks)
Confirmation: A clear break of the lower trendline of the ascending channel → sell the breakdown.
After the break, prioritise selling on a retest of the trendline / nearby resistance
Avoid chasing price at the lows
First target typically lies near the below-liquidity area around 4306
Logic:
The trendline acts as the “backbone” of the uptrend. Losing it during CPI conditions + weakening volume increases the probability of a fast sell-off to sweep liquidity.
Scenario 3: Mid-term Bearish Move
(If 4306 is broken)
Confirmation: A clear and decisive break below 4306.
At that point, mid-term sell positions can be prioritised based on structure
Expected targets:
Extension towards deeper support zones, with the 4248 FVG being a notable liquidity draw.
News Context (Why confirmation matters today)
The market is waiting for US CPI, a key inflation release that can shift expectations around the Fed’s rate-cut path. This directly impacts the USD and the next directional move in XAUUSD.
➡️ Today’s focus: wait for range breaks + strict risk control.
Risk Management
Maximum risk per trade: 1–2%
If stopped out: pause and wait for fresh confirmation (no revenge trading)
This analysis is shared for perspective and trading planning purposes only

XAUUSD – H1 TechXAUUSD – H1 Technical Analysisnical AnalysisXAUUSD – H1 Technical Analysis
Lana trades based on liquidity, with priority on price reaction 💛
Quick Summary
Market context: Midweek, gold liquidity is relatively weak as holiday sentiment starts to build
Timeframe: H1
Strategy: Buy at well-defined liquidity zones, sell psychological reactions at resistance
Expectation: No major USD news today, so strong volatility is unlikely
Market Context
The market is entering a “resting phase” as many traders begin to step back ahead of the holiday period, leading to a noticeable drop in liquidity. Today, there are no key US economic releases, so gold is likely to trade within a narrow range, with movements driven mainly by technical factors.
From a macro perspective, recent comments emphasising a clear separation between the White House and the Federal Reserve show that markets remain sensitive to inflation control. However, the short-term impact is limited, which fits a light, quick trading approach rather than holding positions for large moves.
H1 Technical View
On the H1 chart, price is moving around an equilibrium zone after previous fluctuations. Lower liquidity zones continue to provide solid support, while the upper side consists of psychological resistance levels that may trigger short-term reactions.
With weak liquidity conditions, Lana is not looking for strong breakouts. The focus remains on price reaction at clear and well-defined zones.
Intraday Trading Scenarios
Main Scenario – Buy with liquidity
Buy: 4302 – 4306
SL: 4298
This area shows a clear concentration of liquidity. If price revisits this zone and structure holds, a technical rebound is highly possible.
Secondary Scenario – Sell scalping at resistance
Sell: 4351 – 4355
SL: 4360
This sell setup is purely for scalping, taking advantage of psychological reactions near resistance. It is not preferred to hold sell positions for long under current market conditions.
Trading Notes
Weak liquidity → reduce position size, prioritise quick profits
Avoid expecting large moves in the absence of major USD news
Observe price reaction at key zones; avoid entering trades in the middle of the range
Lana’s Note 🌿
Each scenario represents just one of many possible outcomes in the market. Lana always prioritises account protection, uses clear stop losses, and is ready to stay out if price does not return to the planned zones.

XAUUSD (H1) – Gold Analysis for TodayXAUUSD (H1) – Gold Analysis for Today
Price has touched the resistance trendline, but the plan still prioritises BUY (VAL 4303–4306)
Strategy Overview
Gold is currently reacting at the resistance trendline, but there is not enough confirmation yet to call a bearish reversal. For now, the main plan remains to look for buys from the liquidity zone (Volume Profile – VAL). A strong trend shift will only be confirmed if price clearly breaks and closes above the trendline.
1) Technical View
Price is being pressed by the upper resistance trendline, so short-term volatility and wicks are likely.
However, the lower area is supported by Volume Profile (VAL), which favours a reaction-based buy strategy rather than FOMO entries in the middle of the move.
On the upside, there is strong liquidity around 4370, a zone where profit-taking or distribution can easily appear.
2) Trading Plan for Today (Clear Entry – SL)
Scenario A (Preferred): BUY using Volume Profile (VAL)
✅ Buy: 4303 – 4306 (VAL)
SL: 4295
Near TP: 4320 – 4330
Extended TP: Towards the 4370 liquidity zone if the trendline is broken successfully
Logic: VAL represents a “low value area” on the Volume Profile, which often attracts buying interest. As long as price holds this zone, the bias remains buy on pullbacks.
Scenario B: SELL at the upper strong liquidity zone
✅ Sell: Around 4370
SL: 4380
TP: 4330 → 4306 (return to the value area)
Logic: The 4370 level is a strong liquidity zone. If price reaches this area and fails to hold, it provides a textbook reaction-based sell setup.
3) Trend Confirmation Conditions
Strong bullish confirmation: When price breaks and closes an H1 candle clearly above the trendline. At that point, buy setups become safer, with targets towards higher liquidity zones.
If price continues to be rejected multiple times at the trendline, the priority is to wait for price to return to VAL 4303–4306 before buying. Avoid chasing price.
4) Fundamental Context
CIBC: Weaker US employment data may push the Fed to cut interest rates earlier next year, which is typically supportive for gold in the medium term.
Silver prices breaking higher due to tight supply and rising demand suggest that precious metals flows remain strong, meaning gold can experience sharp liquidity-driven moves.
💬 Which scenario are you leaning towards today?
Buying at VAL 4303–4306, or waiting for price to reach 4370 to sell the reaction?

XAUUSD – Lana Prefers SELL, BUY Only for Short-Term ScalpingXAUUSD – Lana Prefers SELL, BUY Only for Short-Term Scalping 💛
Quick Summary
Short-term trend: Downward pressure dominates
Timeframe: H1
Strategy: Focus on SELL; BUY only for quick scalping at liquidity zones
Note: Today features multiple US data releases and events, so volatility may be higher than usual
Market Context
The market enters the session with a dense news flow: US Presidential speech, unemployment rate, seasonally adjusted Non-Farm Payrolls, and Retail Sales.
In such conditions, gold often experiences strong swings and liquidity sweeps before moving in the main direction. Therefore, Lana prioritizes selling at higher zones and only takes short-term BUY positions when price reaches clear support zones.
Technical Outlook
After the previous upward move, the H1 structure shows weakening price action, indicating the possibility of a continued downward move.
Upper zones where short-term resistance converges are suitable for following the intraday SELL trend. Below, liquidity zones may trigger temporary rebounds, but Lana considers these only for scalping and does not hold positions for long.
Intraday Trading Scenarios
Main Scenario – Trend-Following SELL
Sell: 4308 – 4312
SL: 4320
This is Lana’s preferred zone today. If price retraces into this area and shows rejection, the downtrend is likely to continue.
Buy Scenario 1 – Short-Term Scalping at Nearby Support
Buy: 4253
SL: 4240
This BUY is only for short swings, with quick profit-taking when price reacts.
Buy Scenario 2 – Scalping at Deep Liquidity Zone
Buy: 4213
SL: 4200
This is a stronger liquidity zone. If price drops quickly here during news, a technical rebound is possible, but Lana maintains the view not to hold BUY positions for long.
Session Notes
Asian & European sessions: Price may fluctuate and create technical retracements
US session: Strong news-driven volatility can sweep both sides before a clear direction emerges
Each scenario represents a probability, not certainty.
On high-news days, Lana always reduces position size, sets clear SLs, and is willing to skip trades if price does not reach the expected zones.

XAUUSD H1 – POC 4295 & Fibonacci Sell 4373 XAUUSD H1 – POC 4295 & Fibonacci Sell 4373
Strategy Summary
Today, I am not chasing price. The XAUUSD trading plan focuses on two key “high-quality” zones on the chart:
POC (Volume Profile) around 4295 to look for BUYs in line with money flow.
Fibonacci level at 4373 to look for SELLs when price reaches the premium zone.
Key Levels
BUY zone (POC – Volume Profile): 4295 (major liquidity area)
SELL zone (Fibonacci reaction): 4373
Deeper buffer if POC breaks: 4238 – 4241
Invalidation level: 4191
Scenario 1 – Primary Plan: BUY at the Liquidity Zone (POC)
✅ Buy limit around 4295 (preferably wait for H1 candle confirmation)
SL: 4287 (below POC to avoid noise)
TP1: 4330 – 4338
TP2: 4370 – 4373 (near the Fibonacci sell zone)
Logic:
POC represents the “fair value” or balance point of the Volume Profile. Price often gets attracted back to this level to collect liquidity before deciding the next direction.
Scenario 2 – SELL on Reaction at Fibonacci (Premium Zone)
✅ Sell around 4373 (wait for reaction or loss of momentum, do not chase sells)
SL: 4382
TP1: 4338 – 4330
TP2: 4295 (back to POC)
Logic:
The Fibonacci premium zone is where profit-taking pressure often appears. If price spikes into 4373 but fails to hold, it usually offers a clean reaction sell setup.
Alternative Scenario – If POC Is Broken
If price breaks below 4295 and clearly closes an H1 candle under this level, I will not force buys. In that case, priority shifts to waiting for price to react at:
4238 – 4241, or
deeper towards the lower balance / POC zone.
Always keep in mind: 4191 is the invalidation level.
News Context (to Avoid Getting Stopped Out)
Trump’s concerns about economic impact “not fully priced in yet” may increase political risk and market sensitivity.
Comments from Williams (FOMC, New York Fed) on economic outlook could trigger short-term volatility in USD and yields, causing gold to fluctuate.
Tip: Avoid late entries during news spikes. Only execute trades when price reaches the planned zones.
Risk Management
Maximum risk per trade: 1–2%
Do not trade in the middle of the range. Trade only at key levels.
If you are also watching 4295 and 4373, share your view:
👉 Are you leaning towards a BUY on pullback or a SELL on reaction today?

XAUUSD – Lana waits for reaction at resistance, focuses on ...XAUUSD – Lana waits for reaction at resistance, focuses on zone-based trading
Quick Summary
Context: Early in the week with many high-impact news events. Gold opened strong and is now approaching a major resistance area.
Timeframe: H1
Strategy: No chasing price. Prefer waiting to buy at liquidity void (VL) zones and selling short-term pullbacks at higher resistance.
Expectation: Asian–European sessions may move sideways; stronger volatility is more likely during the US session.
Market Context
The year-end period is usually packed with economic data. This week, Nonfarm Payrolls, CPI, and Retail Sales are released close together, along with interest rate decisions from the UK, Europe, and Japan.
For gold, this environment often leads to sharp moves during the US session, while earlier sessions tend to consolidate or make shallow pullbacks as the market waits for news.
Technical View
After a strong rally at the start of the week, price is now trading around a key resistance zone. On H1, the price action at the Asian open has left a liquidity void (VL), which is Lana’s preferred area to wait for buy opportunities in line with the main trend.
On the upside, a descending trendline combined with Fibonacci extension levels is forming a strong resistance zone, suitable for a short-term corrective sell.
Trading Scenarios for Early Week
Main Scenario – Buy at the liquidity void (VL)
Buy: 4298 – 4302
SL: 4294
This is Lana’s preferred zone. If price returns to fill the liquidity void and the structure holds, there is a high probability of a bullish reaction in continuation of the broader trend.
Alternative Scenario – Short-term sell at higher resistance
Sell: 4367 – 4370
SL: 4376
This is considered a short-term corrective move when price reaches strong resistance. The sell is counter-trend, so strict risk management is required and positions should not be held for too long.

XAUUSD Wave 5 Completed, Entering an ABC Correction CycleXAUUSD – Wave 5 Completed, Entering an ABC Correction Cycle
Weekly Plan Summary
Gold has completed Wave 5 with a very strong impulsive move and is now entering an ABC corrective phase to complete the Elliott Wave structure.
For the coming week, the primary strategy is to look for SELL opportunities at the Fibonacci resistance zone 4316–4320, followed by BUY reactions at the major liquidity area around 4215.
1) Elliott Wave – Why the Market Is Likely Entering an ABC Phase
The recent rally shows clear end-of-Wave-5 characteristics: strong momentum, long candle bodies, followed by a sharp downside reaction (profit-taking and liquidity withdrawal).
Once Wave 5 is completed, the market typically transitions into an ABC correction to rebalance supply and demand and complete a full Elliott Wave cycle.
ABC Structure Based on the Provided Chart
A-leg: Price drops into the 4259–4262 zone (the first reaction area of the correction).
B-leg: Price retraces back towards 4316–4320 (the Fibonacci SELL zone on the chart).
C-leg: Price continues lower towards 4215 (POC + major liquidity cluster formed late last week) — this is the primary target of the correction.
2) Key Price Levels
Sell Zone (B-leg): 4316 – 4320 (Fibonacci resistance)
Near Support (A-leg reaction): 4259 – 4262
Mid Support: 4238 – 4241
Main Target / Liquidity Area: 4215 (POC + major liquidity cluster)
Scenario Invalidation Level: 4191
If price breaks below this level, the structure will need to be reassessed.
3) Trading Scenarios for the Coming Week
Scenario 1 (Preferred): SELL at the End of the B-leg
Sell: 4316 – 4320
SL: 4326 (a clear break above the sell zone)
TP1: 4262
TP2: 4240
TP3: 4215
Logic:
The B-leg is usually just a corrective pullback within the broader ABC structure. Selling at the Fibonacci resistance provides a better risk-to-reward ratio than chasing shorts in the middle of the range.
Scenario 2: BUY Reaction at the End of the C-leg
Buy: Around 4215 (preferably with a clear reaction)
SL: 4191
TP1: 4240
TP2: 4262
TP3: 4290 – 4310 (if structure reverses and the uptrend resumes)
Logic:
4215 is both the POC and a major liquidity zone, often acting as a “magnet” to complete the C-leg before the market forms a new cycle.
Alternative Scenario: If Price Breaks and Holds Above 4320
If price breaks above 4320 and closes clearly on H1 above this level, the ABC correction may be delayed, and gold could extend higher towards the next resistance zone.
In this case:
Do not stubbornly hold SELL positions.
Shift mindset to waiting for pullbacks to BUY in line with the trend.
4) Fundamental Context – Volatility May Increase, Supporting a Correction Phase
Philadelphia Fed Governor Anna Paulson stated that interest rate cuts have “removed some of the insurance” against risks in the labour market.
She also emphasised that the labour market is under pressure but has not yet broken. This keeps the Fed in a cautious stance, a backdrop in which gold often experiences sharp liquidity sweeps before aligning with its technical structure.

XAUUSD Trend holds wait to re buy on pullbackXAUUSD (H1) — Trend intact, waiting for pullback to re-buy at the right zones
Strategy Summary
Price continues to move in line with the bullish plan. Two buy entries were already captured, with price advancing around ~5 points. At this stage, the priority is not to chase price, but to wait for pullbacks into reaction zones to re-enter in the direction of the trend.
1) Trading Plan (H1)
✅ Buy Zone 1: 4262 – 4258
SL: 4250
Meaning: A shallow pullback zone. If price holds the bullish structure and reacts higher here, trend-following buys are preferred.
✅ Buy Zone 2: 4240 – 4235
SL: 4238
Meaning: A deeper pullback (better discount). If price sweeps this area and shows strong confirmation, this becomes a higher-quality buy zone.
Projected Targets (based on chart):
Near resistance: 4285
Extended target: 4304 – 4307
2) Fundamental / News to Watch
The Fed releases US household financial conditions data (Capital Flow Report Q3/2025).
Voting FOMC members & Philadelphia Fed President Paulson speak on the 2026 economic outlook.
The US threatens expanded seizures of Venezuelan oil tankers → geopolitical and energy supply risks may increase volatility, with gold prone to sharp spikes.
3) Technical & Behavioural View
Market structure remains bullish. After a strong impulse, a pullback is healthy before continuation.
Plan remains clear: buy only at predefined zones, no FOMO.
If price breaks below zones and closes H1 candles under SL levels, staying flat and waiting for a new structure is preferred.

XAUUSD H4 Lana Weekly AnalysisXAUUSD (H4) – Lana’s Weekly Outlook: Waiting for pullbacks to Fib 0.618 & 0.50 within major liquidity zones 💛
Higher-Timeframe Trend (D1)
Gold is revisiting the previous all-time high (ATH), but volume strength has not yet been convincing enough to confirm a strong breakout.
Primary Tracking Timeframe
Timeframe: H4
Method: Fibonacci + trendline + liquidity zones + support/resistance
Plan: Lana avoids chasing price and prefers to BUY at discounted areas around Fib 0.618 and 0.50.
Market Context for the Coming Week
US Treasury yields, especially on the long end, remain elevated, increasing short-term volatility in gold.
Fed commentary continues to signal a cautious stance, while political uncertainty in the US may make gold flows more unpredictable.
As a result, Lana prioritises trading clearly defined price zones rather than trying to predict every short-term swing.
H4 Technical View (Medium Term)
Gold’s current trading range is relatively wide. After a strong impulsive move, the market often needs a “cooling-off” phase to rebalance liquidity.
On H4, the two most important zones align between Fibonacci retracement levels and major liquidity areas, making them ideal zones to wait for pullbacks before continuing with the trend.
Key Price Zones Lana Is Watching
1) Buy Zone 1 – Fib 0.618 (Preferred)
Entry: 4216 – 4220
SL: 4210
This is a high-quality Fibonacci discount zone and an area where strong price reactions are likely if larger flows step in to support the trend.
2) Buy Zone 2 – Fib 0.50 + Strong Support (Deeper Buy)
Entry: 4171 – 4175
SL: 4165
This scenario plays out if price sweeps deeper liquidity before rebounding. Lana considers this a safer entry in terms of location, but it requires patience.
Trading Scenarios for the New Week
Primary Scenario – Trend-Following BUY on Pullbacks
Lana prefers to wait for price to retrace into 4216–4220, or deeper into 4171–4175, before entering trades.
If price reacts positively, upside targets will focus on rebounds towards higher resistance zones and the nearest recent highs.
Secondary Scenario – If Price Remains Elevated
If price stays in premium territory with strong volatility, Lana does not recommend late entries.
Instead, the focus is on observing price reactions and waiting for pullbacks into the predefined zones for cleaner, lower-risk execution.
Lana’s Notes 🌿
Every setup represents a probability, not a certainty.
Stop loss is always predefined, and position sizing should be moderate to withstand gold’s wide volatility.

XAUUSD Lana is waiting for price to pull back into the FibonacciXAUUSD Lana is waiting for price to pull back into the Fibonacci discount zone, with 4285 as the key decision level
Idea Summary
Main trend: Bullish continuation, but a pullback into Fibonacci levels is possible before the next leg up
Timeframe: M30
Strategy: No chasing price; Lana waits for price to reach clear buy zones
Key level: 4285 is a strong resistance and a decisive level for next direction
Market Context
The Fed is placing strong expectations on rising labour productivity to ease the tension between growth, inflation, and the labour market. As a result, rate cut expectations for next year remain cautious. For gold, this environment often creates large price swings, making a zone-based trading plan essential.
Key Levels Lana Is Watching
4285: Strong resistance, major reaction zone
4265: Short-term target
4245–4248: Fibonacci-based buy zone combined with price imbalance
4210–4213: Liquidity buy zone if a deeper correction occurs
Trading Scenarios
Primary scenario – Buy on pullback into discount zone
Buy: 4245–4248 | SL: 4240 | TP: 4265 → 4285 → 4300
Secondary scenario – Buy at liquidity zone
Buy: 4210–4213 | SL: 4205 | TP: 4230 → 4255 → 4285
Each scenario is only one of many possible market outcomes. Lana prioritises capital protection, uses clear stop losses, and is comfortable skipping trades if price does not reach the planned zones.
Conclusion
4285 is the level to watch closely. Strong reactions are likely near this zone. A clean break and hold above 4285 could open the path toward 4300.
This is Lana’s personal view.

XAUUSD – LANA FAVOURS BUYING AFTER COMPLETING THE ABC CORRECTIONXAUUSD – LANA FAVOURS BUYING AFTER COMPLETING THE ABC CORRECTION (H1)
1. Fundamental Analysis
While Trump is making headlines with his idea of a “Gold Card” worth up to USD 1 million, the bigger story is the continued capital flow into gold as a safe-haven and long-term accumulation asset.
Bank of America maintains that gold is still in a long-term uptrend and is “under-owned”, projecting that prices could reach USD 5,000/oz by 2026 if investment demand increases.
With this backdrop, Lana keeps the same view: the current H1 corrections are mainly opportunities to find trend-aligned buy entries rather than rushing to sell against the major uptrend.
2. Technical Analysis (H1)
On H1, the corrective ABC structure has completed, and price has bounced precisely from the rising trendline — showing buyers still defending the trend.
The latest bullish leg is currently retracing to test:
Fibonacci 0.382, which aligns with a short-term support zone.
Fibonacci 0.236, closer to the main trendline, forming a strong confluence area for buying.
While upper resistance remains around previous highs and the major trendline above, Lana is currently focused on waiting for price to retrace into the Fibo–trendline zones before anticipating the next bullish wave.
3. Key Levels to Watch
Buy scalping zone (Fibo 0.382 + support): 4205 – 4207
Deeper buy zone (Fibo 0.236 + trendline): 4196 – 4198
Technical SL:
Below 4200 for the upper setup
Below 4190 for the lower setup
4. Trade Scenarios
⭐ Scenario 1 – Buy at Fibo 0.382 + support
Buy: 4205 – 4207
SL: 4200
TP: Aim for the nearest highs around 423x–425x, depending on risk appetite.
⭐ Scenario 2 – Buy at Fibo 0.236 + trendline
Buy: 4196 – 4198
SL: 4190
TP: Similar targets; partial profit-taking is recommended as price approaches upper resistance.
Lana will wait for price to retrace into one of these zones before entering, avoiding FOMO entries when candles are moving too aggressively.
👉 Follow Lana on TradingView to receive the earliest gold updates directly on your mobile. 💛

XAUUSD – The 4,221 Zone Will Decide the Next Direction Ahead...✨ XAUUSD – The 4,221 Zone Will Decide the Next Direction Ahead of the Fed Meeting
From my perspective, gold on 10/12 is in a “waiting for direction” phase.
Price is trapped between the 4,221–4,239 resistance band and the strong 4,166 support area.
On the 45-minute timeframe, the structure is forming a sideways top after the recent upward move.
With the Fed set to announce its interest rate decision soon, I avoid predicting blindly and prefer to let these key zones guide my trading decisions.
🎯 Key Technical Levels
Major Resistance
4,221 – 4,225: Fibo 0.236–0.382 cluster + heavy volume zone
4,239: Extended resistance high — if broken, price may target the 4.25x region
Strong Support
4,166: The “Strong Support” zone on the chart, currently defining the bottom of the range
Below 4.166, the 4.12x region aligns with the Fibo 1.618 extension — a zone where liquidity could be swept if the market sells off sharply
📌 Scenario 1 – Bullish Continuation (Preferred if price holds above 4,200)
Conditions:
Price stays firmly above 4,200
Clear breakout of 4,221–4,225
A 45m candle closes above this zone
If these occur, it signals buyers are regaining control.
Suggested approach:
Buy on a break & retest of 4,221–4,225
SL: below 4,210
TP: 4,245 → 4,258 → 4,270
As long as gold remains above 4,200, I keep a bullish bias and consider dips into the 4.20x region as opportunities to buy.
📌 Scenario 2 – Short-Term Sell From Upper Range Resistance
If price fails to break 4,221–4,239 and forms:
Wick rejections
Small-body candles
→ I treat this as exhaustion at resistance.
Trade idea:
Sell: 4,221–4,225 (up to 4,239 if there is a spike)
SL: above 4,239
TP: 4,190 → 4,176 → 4,166
If selling pressure is strong: extended target 4,130
This setup is suited for scalping or short swings, and goes against the medium-term bullish bias — so position sizing must be controlled carefully.
1️⃣ Fundamental Context: Everything Depends on the Fed
USD/CHF is trading steadily around 0.8060, reflecting the market’s wait-and-see stance ahead of the Fed decision.
Traders don’t want to commit heavily before such major news, so gold tends to move within a range.
Once the Fed releases its rate decision and guidance, gold’s volatility can expand dramatically — possibly sweeping both resistance and support.
Because of that, I do not recommend placing large-position trades right before the announcement.
Instead, focus on observing price reactions at 4,221 and 4,166 to determine whether the next leg will be upward or downward.
2️⃣ My Trading Plan
Above 4,221 with stable price action: Prefer buying the breakout, targeting the 4.25x zone.
Failure to break 4,221, weak candles: Consider shorting toward 4.19x – 4.166.
If price drops directly below 4.166: I stay out temporarily and wait for the market to form a new balanced region before planning the next trade.
Risk per trade: 1–2% maximum, no widening stop-loss during high-impact news.
If you find this analysis useful, follow the TradingView channel and comment whether you expect a breakout above 4,221 or a reversal from resistance — we’ll update again after the Fed announcement.

XAUUSD – LANA WATCHES SUPPORT 4190–4199 AHEAD OF THE FED RATE..✨ XAUUSD – LANA WATCHES SUPPORT 4190–4199 AHEAD OF THE FED RATE CUT DECISION
Fundamental Outlook
Over the past year, Silver has surged nearly 82%, while Gold has gained about 58%, showing that capital continues to favour the precious metals sector.
The market is currently pricing in ~97% probability of a 25 bps rate cut by the Fed tomorrow. This expectation supports gold in the medium term, as lower yields reduce the opportunity cost of holding non-yielding assets like gold.
However, before the actual announcement, price usually swings sharply around short-term support and resistance zones. That’s why Lana prefers to trade based on M30 technical levels during this period.
Technical Analysis (M30 – Support/Resistance Levels)
For gold to drop deeper, the recent low around 4199 must be broken convincingly.
At the moment, price is reacting near the 4190 support zone, a critical level. As long as this area holds, gold still has the potential to bounce within the current range.
Above price, the next resistance zone is 4235–4238, aligning with previous FVG and supply areas — suitable for a Sell setup if price retraces upward.
Below, the 4164–4167 area is the next strong support, also marked by Lana as a Buy scalping zone if the market flushes down rapidly.
Summary:
As long as support remains intact, Lana continues to favour Buy setups around these zones.
Sell scenarios only become valid when price retraces to the higher resistance areas.
Key Price Levels to Watch
Important Supports:
4199 – 4190 (near-term low & short-term support)
4164 – 4167 (next Buy zone)
Resistance / Sell Zone:
4235 – 4238
Trading Scenarios
⭐️ Scenario 1 – Sell at Resistance
Sell: 4235 – 4238
SL: 4243
TP: 4222 – 4205 – 4190
⭐️ Scenario 2 – Buy at Support
Buy: 4164 – 4167
SL: 4159 TP: 4182 – 4202 – 4225
👉 Follow Lana on TradingView to receive the earliest gold updates.

XAUUSD – LANA TRACKING ELLIOTT WAVE 5, PRIORITY ON SELLING ...XAUUSD – LANA TRACKING ELLIOTT WAVE 5, PRIORITY ON SELLING TOWARDS 4130
1. Fundamental Overview
Global capital flows are currently pouring heavily into Japanese Government Bonds (JGBs), accounting for nearly 65% of monthly trading volume.
As the BOJ reduces its bond-buying program, JGB yields have climbed to multi-decade highs, turning Japan into a new source of volatility for global financial markets.
Every shift in JGB flows – whether capital exits or sudden reversals – can spill over to currency markets and commodities, including gold.
With this backdrop, Lana interprets gold through Elliott Wave + liquidity principles, viewing the recent upside moves mainly as technical pullbacks within a deeper corrective structure.
2. Technical Analysis
On the M30 timeframe, Lana is monitoring a potential Elliott Wave 5 downtrend:
The region around 4200 appears to have acted as the completion of Wave 4, followed by weakening momentum.
Wave 5 is projected to extend toward major demand support at 4128–4135.
Intermediate supports to watch:
4164 – noted on chart as a possible “Buy Scalping” zone.
4153 – an important swing low and sell-side liquidity pocket.
4176–4178 is the current short-term low; a clean break below this will be Lana’s confirmation that Wave 5 is expanding.
3. Key Price Levels
Nearby resistance:
4184–4187 – ideal retest area if price breaks the low and pulls back.
Support & downside targets:
4164 and 4153 – intermediate reaction levels.
4135 – 4130 – 4112 – expected Wave 5 completion zone and area of deeper liquidity.
4. Trading Scenarios
⭐ Primary Scenario – Sell with the Elliott Wave 5 Structure
Condition: Only sell once price clearly breaks below 4176–4178.
Sell Entry: Below 4176–4178 (or wait for a cleaner pullback into 4180–4184).
Stop Loss: 4184
Targets: 4155 – 4130 – 4112
This aligns with the expectation that Wave 5 will stretch down into lower liquidity zones.
⭐ Secondary Scenario – Short-Term Buy Scalping
Buy Entry: 4164
Target: Quick 10–15-point rebound
Note: This setup is only for fast scalpers and should not be held long.
For this week, Lana continues to prioritise selling as the dominant plan.
Any buy position should strictly be treated as a quick technical bounce, not a reversal of trend.

XAUUSD – LANA PRIORITIZES SELLING WITH THE ELLIOTT WAVE C LEG...XAUUSD – LANA PRIORITIZES SELLING WITH THE ELLIOTT WAVE C LEG AT THE START OF THE WEEK
Fundamental Analysis
During periods of Quantitative Easing (QE), the Federal Reserve injects liquidity into the financial system by purchasing bonds. This expands the “liquidity reservoir” and generally supports asset prices, including gold.
Conversely, under Quantitative Tightening (QT), the Fed gradually reduces its balance sheet, pulling cash out of the system and tightening financial conditions.
Currently, with QT having ended, the Fed is essentially signaling that:
The current liquidity level is the minimum they consider safe.
They want to avoid a repeat of the liquidity shock seen in 2019.
This reduces medium-term tightening pressure on gold. However, in the short term, gold is still undergoing a technical correction, which is why Lana prefers to trade based on Elliott Wave structure rather than reacting to news.
Technical Analysis – Elliott Wave on M30
On the M30 timeframe, gold is in a corrective C wave, which may be the final leg of the current structure.
The prior 5-wave bullish move showed signs of a truncated fifth wave, failing to create a strong new high – an indication that buying momentum has weakened.
Early this week, price swept Buy-side liquidity but could not hold upward momentum, reflecting weak bullish sentiment.
Below current price, the 4128–4135 zone is a key area — both a support region and the potential completion zone of wave C if the decline extends.
With this structure in mind, Lana’s plan for the week is to prioritize Sell setups, following the C-wave, instead of attempting early bottom-picking.
Key Price Zones
Sell-on-pullback zone:
4215 – 4218 (Primary entry zone)
Downside liquidity & target zones:
4192 – 4175 – 4164: Intermediate liquidity points on the way down
4135 – 4130: Expected completion area for wave C (aligning with the 4128–4135 support zone)
Trading Scenarios
⭐ Primary Scenario – Sell following the Elliott Wave C leg
Sell Entry: 4215 – 4218
Maximum SL: 4220
TP: Minimum +20 pips from entry
Extended target: 4135 – 4130 if the market completes the full corrective structure
This week, Lana will not prioritize early Buy entries, and will only consider buying again if price approaches the 4128–4135 zone with clearer reversal signals.
👉 Follow Lana on TradingView to receive the earliest updates on the larger gold wave structure.

/]*/USD – Volume Profile: Selling at VAH, Buying at POC Within..XAUUSD – Volume Profile: Selling at VAH, Buying at POC Within a Wide Range
Gold is currently trading inside a broad H1 range, showing hesitation after last week’s decline. The present movement is essentially a pullback phase within the H1 downtrend, so I prefer to trade based on Volume Profile liquidity zones instead of trying to predict a new trend.
Price is now approaching the VAH (Value Area High), while below we have the POC cluster + ascending channel support — the two key zones guiding today’s trading decisions.
🎯 Scenario 1 – SELL at VAH / Supply Zone
Sell: 4.221 – 4.223
SL: 4.228
TP: 4.212 – 4.200 – 4.178 – 4.150
Logic:
The H1 VAH sits around the 4.22x region, aligning with resistance near the upper boundary of the minor ascending channel.
This area previously triggered strong selling pressure, pushing price back inside the value region. If price retests this zone and forms weak candles (long upper wicks, small bodies), I prioritise short-term Sell trades in line with the current corrective swing.
TP levels:
4.212: bottom of the balance zone
4.200: lower boundary of the range
4.178 – 4.150: deeper liquidity lows
Although this setup aligns with the H1 correction, it still counters the larger uptrend, so I keep a moderate position size and a strict SL at 4.228.
⭐ Scenario 2 – BUY at POC / Channel Support
Buy: 4.193 – 4.195
SL: 4.187
TP: 4.210 – 4.235 – 4.260
Logic:
The 4.193–4.195 zone is the POC (Point of Control) — the highest-volume area — aligning with the ascending channel support and short-term demand.
If price drops from VAH and reaches the POC while showing clear signs of buying pressure, this becomes my preferred intraday reversal area.
Targets are the mid-channel zone at 4.210, then the previous upper boundary at 4.235–4.260.
This setup leverages the tendency of large players to defend the POC, especially when no major negative news is strong enough to break the structure.
1️⃣ Quick Macro Outlook
Global capital flow is rotating into other risk-on assets such as Chinese equities, benefiting from AI themes, economic recovery expectations, and attractive valuations. MSCI China has outperformed the S&P 500 this year.
In commodities, Goldman Sachs still forecasts NYMEX natural gas at USD 4.50/MMBtu by summer 2026, showing that major investors remain optimistic about the broader commodity group.
In summary, a risk-on environment does not eliminate gold’s role, but it increases volatility as capital rotates — making Volume Profile and liquidity zones even more effective than directional bias.
2️⃣ Technical View & Execution Plan
On H1, price moves inside a mild ascending channel, but the overall structure remains a corrective phase of the prior decline.
VAH 4.22x: Favourable for Sell setups as short-term sellers dominate here.
POC 4.19x + support: Expected buy zone where bulls may defend the channel.
Execution rules:
Only trade at predefined zones — no FOMO in the middle of the range.
Risk per scenario capped at 1–2% of account; SL must not be widened.
Invalidation:
If price breaks above 4.228 → exit Sell idea, wait for new structure.
If price drops below 4.187 → exit Buy idea, avoid catching a falling knife.
If price breaks strongly through both VAH and POC and stabilises outside, I will abandon both setups and update my view accordingly.
If you find this analysis helpful, follow the TradingView account and comment whether you prefer Sell at VAH or Buy at POC today — I always read the feedback before preparing the next post.

The EMA Cloud+RSI Combo That Traders Are Using to Catch Big MoveHello Traders!
If you struggle with false breakouts and early entries, this simple combination of the EMA Cloud and RSI Confirmation can help you filter noise and catch cleaner trend moves.
This setup works for Stocks, crypto, indices, forex, any market where trends matter.
Let’s break it down in the simplest way possible.
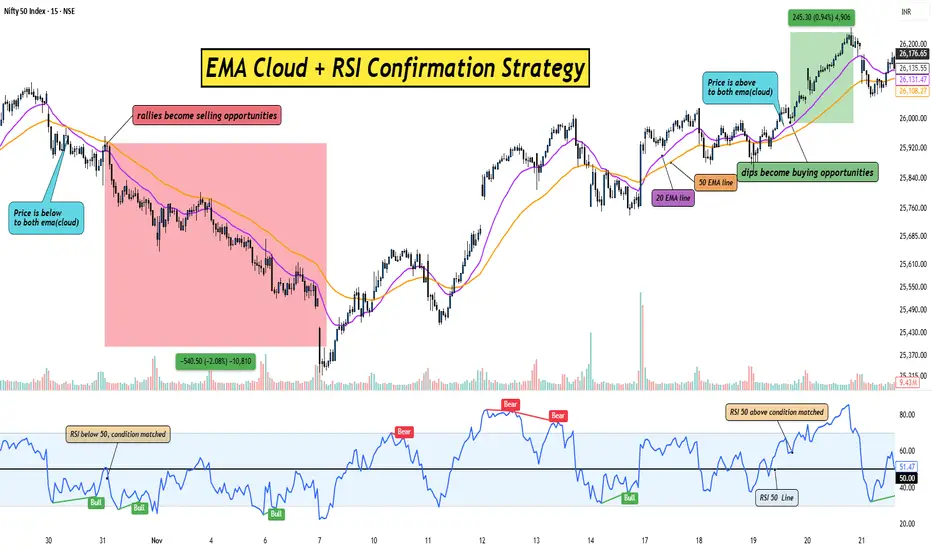
1. What Is the EMA Cloud?
The EMA Cloud is a zone created using two EMAs, commonly the 20 EMA and 50 EMA.
When price stays above the cloud, the trend is bullish and dips become buying opportunities.
When price stays below the cloud, the trend is bearish and rallies become selling opportunities.
The cloud visually shows where momentum is strong versus where price is losing strength.
2. Why Add RSI Confirmation?
RSI helps you avoid chasing overextended moves.
You only take a trade when RSI aligns with the cloud direction, giving you confirmation.
This reduces false entries and improves accuracy.
EMA Cloud gives the trend.
RSI gives the green signal to enter.
3. Entry Rules:– Simple and Clear
For Longs:
Price must stay above the EMA Cloud.
RSI should be above 50 to confirm bullish momentum.
Enter on a small pullback into the cloud or after a breakout candle closes above it.
For Shorts:
Price must stay below the EMA Cloud.
RSI should be below 50 for bearish confirmation.
Enter on a pullback toward the cloud or a breakdown candle.
This combination prevents you from buying too early or selling too late.
4. Exit Strategy:– Keep It Clean
Exit when price closes inside the EMA Cloud against your direction.
Aggressive traders can exit when RSI crosses back below 50 (for longs) or above 50 (for shorts).
Always trail your stop loss below the cloud to lock in gains.
The cloud helps you ride the trend longer with less stress.
5. Why This Strategy Works So Well
EMA Cloud filters the market trend.
RSI filters the momentum.
Together, they eliminate 70% of noise and give you only the smoothest trend trades.
It’s simple, visual, and beginner-friendly, yet powerful enough for advanced traders.
Rahul’s Tip:
Don’t rush entries just because the market is moving fast.
Wait for cloud direction + RSI confirmation, this patience alone can double your accuracy.
Conclusion:
The EMA Cloud + RSI Confirmation Strategy is a clean, reliable way to follow trends without second-guessing.
It removes emotional entries, filters noise, and gives you structured trade opportunities.
Use it consistently, and you’ll notice how much clearer your charts feel, and how much calmer your decision-making becomes.
If this post helped you understand a simple yet effective trend strategy, like it, comment your thoughts, and follow for more practical trading setups!
XAUUSD – Ahead of NFP: Buy with Wolfe Wave, Watch for Sell ...XAUUSD – Ahead of NFP: Buy with Wolfe Wave, Watch for Sell Setup at the Extension Zone
Gold continues its upward momentum as the USD weakens sharply, breaking the descending trendline and forming a Wolfe Wave pattern on the H1 chart.
Price is currently rotating around the POC – VAH cluster of the previous distribution zone, making it very likely to react before the NFP release.
At this stage, I prioritise buying with the main trend, but I also prepare a short-term sell setup if the market becomes “overstretched” before the news.
🎯 Scenario 1 – Priority BUY at POC/VAH
Buy: 4,209 – 4,212
SL: 4,205
TP: 4,233 – 4,260 – 4,299
Reason:
Price is retesting the POC – VAH cluster right after breaking above the descending trendline.
The Wolfe Wave structure points toward higher targets, aligning with the continuation of the bullish trend.
The 4,209–4,212 zone offers good liquidity, allowing a tight stop loss while maintaining an attractive R:R.
🔁 Scenario 2 – SELL Reaction at the Upper Extension Zone
Sell (only if a clear reversal signal appears): 4,323 – 4,325
SL: 4,333
TP reference: 4,299 – 4,260 – 4,233
Reason:
The 4,323–4,325 zone is an upper extension area, overlapping with the Wolfe Wave resistance and a previous supply zone.
If price is “pushed” into this region before NFP, and H1 candles show long upper wicks or weakening volume, I will consider it a counter-trend sell opportunity back toward the POC/support areas.
This is a counter-trend trade, so position size should be smaller and execution must be clean and quick.
1️⃣ Fundamental View Before NFP
The USD is attempting to recover from its late-October lows but is restricted by expectations of the Fed turning dovish soon.
Recent data shows a cooling U.S. economy and a slowing labour market—raising the probability of a 25bps rate cut at the upcoming FOMC meeting.
Additional developments:
The Government Accountability Office has launched an investigation involving a “Fed critic.”
Kevin Hassett stated that he believes the Fed may cut rates soon.
These factors strengthen the narrative that the interest rate peak is behind us.
Although Challenger job cuts dropped sharply compared to the previous month, the overall economic picture still suggests slowing growth, which supports gold in the medium term.
Summary:
Fundamentals remain supportive for gold.
NFP will only determine how deep or how fast the next correction will be—not a trend reversal unless the numbers are extremely out of expectations.
2️⃣ Technical Outlook from the Chart
On H1, gold has broken the descending trendline and moved back above the POC area of the previous downmove.
A Wolfe Wave pattern has formed, projecting targets higher than current price.
Price is currently hovering around POC – VAH:
If it holds above 4,209–4,212, the next targets are likely 4.26x–4.29x.
If price gets strongly rejected near 4.32x before or after NFP, this becomes a valid zone to look for sell reactions.
3️⃣ Trading Plan & Risk Management
Priority: BUY at 4,209–4,212, SL 4,205, TP 4,233–4,260–4,299
Sell setup at 4,323–4,325 is activated only when reversal signals appear
If NFP causes excessive volatility, prioritise waiting for price to stabilise around the POC before re-entering new setups.

XAUUSD – LANA LOOKS FOR BUY SCALPING AT 4180–4185 BEFORE PCE ...XAUUSD – LANA LOOKS FOR BUY SCALPING AT 4180–4185 BEFORE PCE DATA
1. Fundamental Analysis
Toward the end of this week, the market is almost “holding its breath” ahead of the PCE report – the Fed’s preferred inflation gauge, considered the final key puzzle piece before the year-end meeting.
Recent surveys show weakening consumer confidence and rising recession risks.
However, Black Friday and holiday shopping numbers indicate demand is still fairly strong.
For that reason, PCE will play the decisive role:
If inflation continues to cool, the market will strengthen its ~87% expectation of a 25bps rate cut by the Fed, supporting equities and, in the medium term, providing a positive foundation for gold.
Before the data release, gold typically trades sideways with compressed volatility as money stays on the sidelines waiting for clearer signals.
Today, Lana treats the session purely as a scalping day, without opening any long-term positions.
2. Technical Analysis
H1 timeframe: Gold is moving inside an ascending price channel, with each low higher than the previous one.
The lower trendline of the channel passes through the 4180–4185 zone.
Above, resistance sits at 4219, and further up at the POC cluster 4241–4244.
But with the current sideways behaviour, price has not shown any intention of a strong breakout.
During Thursday and Friday morning, the range became noisy, with candles clustering around the mid-channel area – a sign of accumulation while waiting for a breakout.
For this reason, Lana avoids buying or selling in the middle of the range.
She focuses only on clear liquidity zones near the rising trendline for scalping.
3. Key Price Levels
Buy scalping zone: 4185 – 4180 (trendline support + liquidity zone)
Secondary support: 4165 – 4156
Near resistance: 4219
Major resistance / POC: 4241 – 4244
4. Trading Scenario
⭐ Primary (and only) scenario – Weekend Buy Scalping
Buy: 4185 – 4180
Stop Loss: 4178
Take Profit: At least +15–20 pips from entry
(Traders may choose to secure partial profits at nearby resistance levels.)
Today, Lana will not open any long-term positions — she focuses solely on this scalping setup.
Next week, once the PCE data and the Fed’s decision provide clearer market direction, she will share more detailed updates. 💛
👉 Follow Lana on TradingView to receive the earliest gold analysis updates.
