FORTIS HEALTCARE LTD AnalysisFOR LEARNING PURPOSE
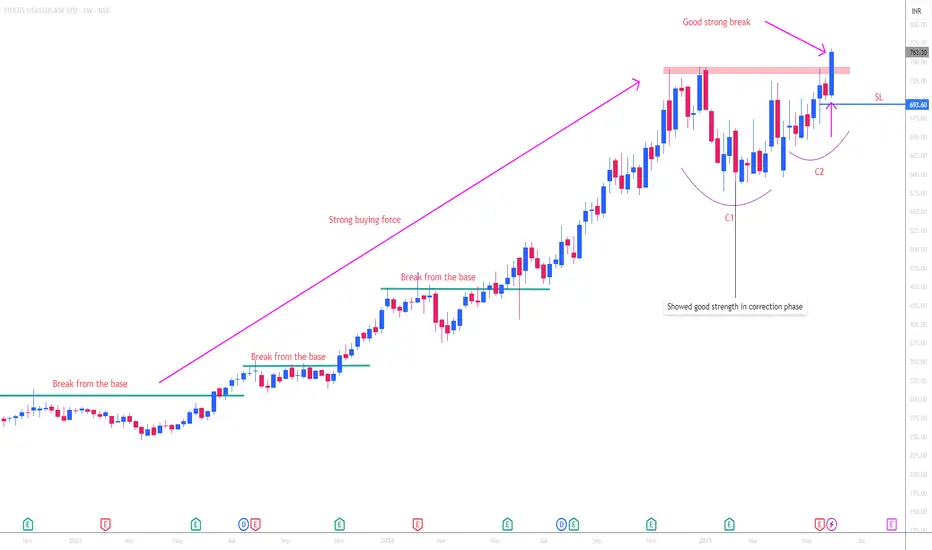
FORTIS HEALTHCARE LTD - The current price of FORTIS HEALTHCARE LTD is 763.30 rupees
I am going to buy this stock because of the reasons as follows-
1. Its coming out from a good consolidation base
2. It broke a strong resistance zone and making ATH
3. It is showing better relative strength as it stood strong in volatile times
4. The risk and reward is favourable
5. The stock is famous and it belongs to a sector which has not done much in last weeks so I am expecting some move from that.
6. The stock has been very strong in past 2 years and it needed a good rest which it got in last few months.
7. The stock has been outperforming major Index as well as Sectoral Index which is a good sign
I will buy it with minimum target of 35-40% and then will trail after that.
My SL is at 693.30 rupees
I will be managing my risk.
FORTIS
FORTIS | Cup and Handle Breakout | DailyHere’s the **technical analysis** for **Fortis Healthcare (FORTIS)**
---
### 📝 **Technical Analysis – Fortis Healthcare (Daily Timeframe)**
**Date:** May 28, 2025
**Pattern Identified:** ✅ *Cup and Handle Breakout*
---
### 1. **Chart Pattern Overview**
* A well-formed **Cup and Handle** pattern is visible.
* The breakout level was **₹700**, and price is currently trading at **₹710.60**, confirming the breakout with a retest.
* The structure is bullish, suggesting **continuation of the uptrend**.
---
### 2. **Volume Analysis**
* Significant volume spike during the breakout phase above ₹700.
* Volume continues to remain strong, confirming **buyers' dominance** and **breakout strength**.
---
### 3. **Price Action Insights**
* Clean breakout from multi-month resistance zone of ₹700.
* Price is consolidating just above breakout level — indicates **healthy retest**.
* Next key level to watch: ₹744.50 (recent swing high).
---
### 4. **Target Projection**
* **Cup Depth**: ₹124
* **Breakout Point**: ₹700
* **Target Price** = ₹700 + ₹124 = **₹825**
➤ Potential upside: **+16%** from current levels
---
### 5. **Support & Stop-loss**
* **Immediate Support**: ₹700 (breakout level)
---
### 6. **Trend & Sentiment**
* The breakout has flipped the sentiment **strongly bullish**.
* Uptrend resumption is supported by price structure and volume confirmation.
---
### ✅ **Conclusion**
* **Pattern**: Cup and Handle
* **Breakout Level**: ₹700
* **Current Price**: ₹710.60
* **Target**: ₹825
* **Stop-loss**: ₹700 range
* **Action**: **Buy on dips / retest confirmation**

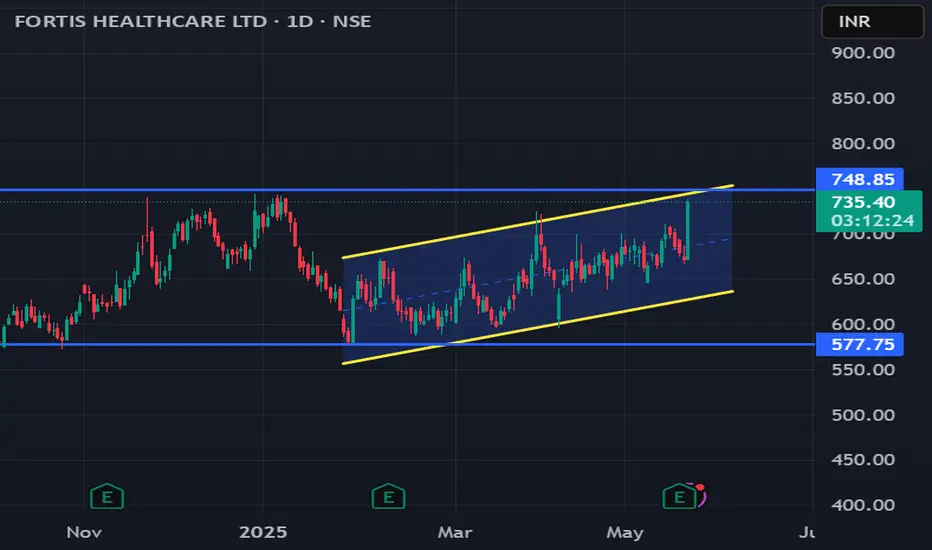
Fortis: Channel Breakout Above 750 – ATH LevelDetails:
Asset: Fortis Healthcare Ltd (FORTIS)
Breakout Level: 750
Potential Targets: 800, 850, 900
Stop Loss: Below 735 or as per risk management
Timeframe: Medium-term
Rationale: Fortis has broken out of a long-term channel above 750 and is trading at an all-time high (ATH), indicating strong bullish momentum and institutional interest.
Market Analysis:
Technical Setup: Channel breakout at ATH is a strong signal of continuation.
Sector Outlook: Positive sentiment in the hospital and healthcare space due to rising demand and expansion in private healthcare.
Risk Management:
Use stop loss below 735 to protect against reversal.
Timeframe:
Medium-term move expected with sustained bullish momentum.
Risk-Reward Ratio:
Strong breakout at ATH offers high potential with limited downside.
Sustained volume above 750 can trigger rapid upside movement.
Thyrocare for 70%+ gains after correctionDate: 3 Nov’24
Symbol: THYROCARE
Timeframe: Daily
Apparently, Thyrocare seems to be in Wave III which could conclude around 1000. Post which Wave IV correction could come down to 840-820 levels marked as Demand Zone in the chart. And Wave V then will be heading to 1430 to 1500 levels (70%+ from 830 levels) depending on where Wave IV ends. Its all time high price is 1465.
This is not a trade recommendation. Please do your own analysis.
HINGLISH VERSION
Jaahir taur par, Thyrocare Wave III mein lagta hai jo 1000 ke aaspaas samaapt ho sakta hai. Jiske baad Wave IV chart mein Demand Zone ke roop mein ankit 840-820 ke star tak neeche aa sakta hai. Aur Wave V tab 1430 se 1500 ke star (830 ke star se 70%+) ki taraf badh jaega, yah is baat par nirbhar karega ki Wave IV kahaan samaapt hota hai. Thyrocare ki all time high keemat 1465 hai.
Yah koi trade lene ki salah nahin hai. Kripya apana vishleshan khud karein.

FORTIS is ready to move 17-20 % AheadHey Family, there is a one more stock Which is showing a great opportunity.
Key Points:-
* Formation of Ascending Triangle Pattern in Daily TF.
* From June 2024 to Aug 2024 its in 80 Points range.
* From June 2024 to Aug 2024 Tested & Moving Near Resistance Many times.
* It's Near resistance Zone and trying to Break Resistance Zone with good volume.
* Volume Accumulation (Volume is Rising).
What is your view please comment it down and also boost the idea this help to motivate us. We are Certified. All views shared on this channel are my personal opinion and is shared for educational purpose and should not be considered advise of any nature.

FORTIS - Swing Trade - 22nd February #stocksFORTIS (1D TF) - Swing Trade Analysis given on 22nd Feb, 2024
Pattern: RECTANGLE BOX
- Volume buildup at Resistance - Done ✓
- Resistance Breakout - In Progress
- Retest & Consolidation - In Progress
#stocks #swingtrade #chartanalysis #priceaction #traderyte #FORTIS #stockmarket #sharemarket #viral #sharemarketindia #StockMarketindia

FORTIS HEALTHCARE: Long wick candlesAfter a breakout from the range pattern, Stock is now in clear uptrend
past few trading sessions sellers trying to pull it down
but buyers form LONG WICK CANDLES

Fortis Swing Weekly Timeframe is bullish
Daily Timeframe has tested it's structure
4HR timeframe is bullish

2 Amazing swing trade ideas for 16 june markets I daily make educational content videos for swing / positional trading


FORTIS: ATH BreakoutCMP: 321
- 1-year box breakout near All-Time High
- Looks good with SL near yesterday's Low

FORTIS Rounding Bottom & Reistance BO Retest !!NSE:FORTIS
#NSE:FORTIS formed beautiful rounding bottom and given Resistance BO and the level retested, fair chances to move up with decent volumes.
SL 280, Target Open.
Our friends got this level @ 248 and now trading @ 298 !!

FORTIS - Ichimoku Bullish Breakout Stock Name - Fortis Healthcare Limited
Ichimoku Cloud Setup :
1). Today's close is above the Conversion Line
2). Future Kumo is Turning Bullish
3). Chikou span is slanting upwards
All these parameters are showing bullishness at Current Market Price
and more bullishness AFTER crossing 301.
#This is not Buy and Sell recommendation to any one. This is for education purpose and a helping hand to learn trading in Market.
# Cloud Trading
# Ichimoku Cloud
# Ichimoku Followers
I hope you all like my analysis.
Please do share your thoughts into comment section.
Please give a like, it motivates me to do analysis.

Intraday Trade: watch for Inside candle breakoutbuy above 282 in intraday
keep qty less as stock is not very liquid
For stoploss in Intraday use 5 minute chart and see nearest support.
for target use 5 min chart and fibonacci pivots as i don't keep predefined target.
try to book partially and trail.
Note: this is not a prediction for LONG/SHORT, trade will trigger only on given level as per technical analysis
NOTE: For Gapup or bo before 9:20
If gapup is more than 1% from bo level than avoid completely.
if less than 1% or gives bo before 9:20 than wait for
first 5 minute candle and entry above 5 minute candle
and revised SL below candle Low.

FORTIS - Ichimoku Bullish Breakout Stock Name - Fortis Healthcare Limited
Ichimoku Cloud Setup :
1). Today's close is above the Conversion Line
2). Future Kumo is Bullish
3). Chikou span is slanting upwards
All these parameters are showing bullishness at CMP
and more bullishness AFTER it cross the 280.
#This is not Buy and Sell recommendation to any one. This is for education purpose and a helping hand to learn trading in Market.
# Cloud Trading
# Ichimoku Cloud
# Ichimoku Followers
I hope you all like my analysis.
Please do share your thoughts into comment section.
Please give a like, it motivates me to do analysis.

Fortis Healthcare , Head And Shoulder PatternHere one candle representing 1 hr OHLC data ,
1) Daily Support is near 232
2) Head and shoulder pattern
3) Neckline is good
We can expect an up Move from here till the next resistance zone.

Fortis Target 300 - 350With the Strong Quarterly Results Reported by Fortis on 12 Nov 2021. Fortis will be Trending and once it breaks out 273 levels the Stock may face resistance at 281 levels then at 300-304 levels where there might be some Profit Booking. If the Stock Close Above 304 and sustains for more than a week then the Stock may see further upside till 350 - 360 levels. Resistance at 330 levels.
Demand and Supply Zones drawn on the Chart.
Stop Loss Can be below 224rs.


FORTIS - 14 Years Breakout 🔴DISCLAIMER
***** It's just for an educational purpose and so you must also follow your own technical analysis before taking up the trade ******
Aggressive traders enter at the breakout and conservative traders may give entry after retracement (Retracement is optional, we cannot expect every stock to take a retest after the breakout, it may also continue to have its bullish pressure after the breakout)
After reaching our targets, trail your stop loss to get maximum profit from the stock in a single trade

Fortis :: LONG Buildup Low Risk Fortis :: LONG Buildup Low Risk
-------------------------------------
-- Buy at Current Levels 255 - 265
-- Initial S/L 245 for ST Traders ( 232 for LT)
-- Add more when price sustains or retraces to FIB levels above..
-- Trail S/L using FIB Levels or SuperTrend indicator
Reasons for increased probability::
----------------------------------------------
-- RSI Divergence and price Gapping up near Parallel Channel Bottom.
-- Price near multi-year Resistance Line,, Rewards will be good if the upcoming results are good
/**
Caution : Midcap Healthcare stock... Prefer allocating <10% of your capital.
This is just a probability and trade only if you know about "Risk Management".
Consult your financial advisor to know more about the risks associated with buying / selling shares.
**/

FORTIS
Chart itself break the support line and now cosolidate on that area. So if market again break the support line on upside and stay there for at least two trading session and then showing a bullish candle then you can take long position or buy it.
And if you have existing position then kindly use the stop loss below the support line and if today market itself showing a red candle I mean bearish candle then kindly square off your position.
if market is maintain the previous uptrend channel then it will take resistance on the resistance line, and reverse from there. so for swing trade that resistance linen will be the target. And if you want to hold for long term then use the trailing stop below the support line. I hope below picture will be helpful for this text. If you want to know more kindly let me know

FORTISNote:
1. Views are personal and for educational purposes only. Recheck and take the trade as per your RR.
2. Always remember SL is your lifeline, not the big target...
3. Follow us for more patterns and like, share so that we feel it is helpful to many and share more patterns...
3. Views given here is not a tip rather it is for educational purpose... Aftermarket opens, the condition might change so learn to handle different conditions...
4. To learn more about patterns, Psychology behind the trade, and price action trading... contact us... Thanks...
Keep an eye ladies and gentlemen. Cheers and Happy Trading

FORTIS has broken the resistanceI will look at buying FORTIS because :
It has broken the Resistance.
Its back to its resistance and we can see big move upwards soon
Entry : 232
Target : 300+
Stop loss : 211
