Gold (XAUUSD) Reversal Setup: Buy Opportunity from Demand Zone t GOLD (XAUUSD)
Timeframe: 30-minute
Indicators:
EMA 30 (Red): 3,000.22
EMA 200 (Blue): 3,042.92
🔍 Price Action & Zones
Current Price: 2,982.27
Support Zone (Demand Zone): ~2,940.27 (highlighted in purple, labeled as STOP LOSS)
Resistance Zone (Supply Zone): ~3,040.17–3,042.92 (labeled as EA TARGET POINT)
📈 Trade Idea (Based on Drawing)
Strategy: Buy from demand zone, targeting supply zone
Entry: Near 2,940.27
Stop Loss: Slightly below 2,940.27
Target: ~3,040.17
Risk to Reward: ~1:2.6 (visually)
📊 EMA Dynamics
Bearish Bias in the Medium Term: Price is trading below the 200 EMA, indicating an overall bearish trend.
Short-Term Weakness: The price has also dropped below the 30 EMA, confirming bearish momentum in the short run.
🔄 Possible Scenario
Price is currently heading back down toward the demand zone, where a bounce is anticipated.
If it respects that zone, we may see a reversal toward the target zone at ~3,040.
If it breaks below 2,940, the setup would be invalidated (stop loss hit).
⚠️ Things to Watch
Rejection or support confirmation at 2,940 zone is key before entry.
Be cautious of continued bearish momentum if economic news or global risk sentiment shifts.
Look for bullish reversal patterns (e.g. hammer, bullish engulfing) at the demand zone for confirmation.
Foryou

EUR /USD) bearish trand analysis Read The ChaptianSMC Trading point update
This chart presents a technical analysis of the EUR/USD pair on a 1-hour timeframe. Here's the breakdown and idea behind the analysis:
Chart Analysis Summary:
1. Trend Structure:
The price was in a downtrend, moving within a descending channel.
Recently, the price has rejected the upper boundary of the channel (noted as "down reject").
There's a 200 EMA (Exponential Moving Average) acting as dynamic support around the 1.09086 level.
Mr SMC Trading point
2. Support Zone:
A strong demand zone (highlighted in yellow) is visible near the 1.08183 area.
This zone aligns with previous structure support and a potential reversal point.
3. RSI Indicator:
RSI is around 49, showing a neutral to slightly bearish momentum.
No overbought/oversold signals yet, suggesting room for further downside before a reversal.
4. Projection Idea:
The analyst expects a possible short-term drop into the yellow support zone (target: 1.08183).
After reaching the target, a bullish reversal is anticipated, aiming for a breakout above the downtrend with a rally towards the 1.10500+ zone.
Trading Idea:
Short-Term Bearish Move: Sell toward 1.08183 if price confirms rejection of the trendline or 200 EMA.
Medium-Term Bullish Reversal: Watch for bullish confirmation (e.g., engulfing candle, RSI divergence) at the 1.08183 zone to go long toward higher highs.
Pales support boost 🚀 analysis follow)

USD/JPY) bullish trend analysis Read The ChaptianSMC Trading point update
This chart is an analysis of the USD/JPY currency pair on a 2-hour timeframe, and it presents a possible bullish scenario. Here’s a breakdown of the idea:
---
Key Points of the Analysis:
1. Support Level & Change of Character (ChoCH):
Price found strong support around 144.556.
A ChoCH (Change of Character) is noted, indicating a potential shift from a bearish to a bullish trend.
2. Bullish Reversal Setup:
The price is forming higher lows, suggesting the start of a "New Up Trend".
There's a clear zig-zag bullish projection, suggesting potential long opportunities.
3. Target Zones:
The first target point is in the range of 149.692 – 150.493.
This area is also marked with a resistance zone, making it a logical TP (Take Profit) level.
4. Risk/Reward Ratio:
The risk is around -3.75% (-564.8 pips), and the reward is around +3.94% (+569.2 pips), suggesting a 1:1.05 R/R ratio.
5. RSI Indicator (Below):
RSI is showing a bullish divergence (price made lower lows while RSI made higher lows).
This divergence supports the idea of a possible bullish reversal.
6. 200 EMA:
The 200 EMA is at 148.767, acting as a dynamic resistance. Price may react around that level before hitting the final target zone.
Mr SMC Trading point
---
Conclusion:
This analysis suggests a potential long trade setup on USD/JPY based on:
A support zone,
Bullish RSI divergence,
Market structure shift (ChoCH),
And projected movement toward 149.692–150.493.
Idea: Buy near the support zone (~144.556) and target the resistance zone (~150.493) while managing risk carefully.
---
Pales support boost 🚀 analysis follow)

USD/JPY) Bullish reversal analysis Read The ChaptianSMC Trading point update
This chart is for USD/JPY on the 1-hour timeframe, and it presents a bullish trade setup. Let’s break down the idea
---
Key Observations:
1. Current Price:
USD/JPY is trading around 146.281.
2. Overall Bias:
Bullish setup expecting a bounce from demand into a higher target zone.
3. EMA 200:
Price is currently below the 200 EMA (147.942), which usually suggests a bearish trend — but this setup is aiming for a short-term bullish retracement.
4. Demand Zone (Buy Area):
Marked in yellow between 145.822 and slightly above.
Labeled as "FVG orders" (Fair Value Gap), suggesting institutional interest or imbalance fill.
5. Trendline Support:
The price is approaching a rising trendline, adding confluence for a potential bounce.
6. Expected Move:
Price is expected to bounce from the demand zone, form a higher low, and then move up toward the target zone at 148.221.
Two upside targets are drawn:
First Move: ~1.12% (30.6 pips)
Full Target: ~1.76% (256.1 pips)
Mr SMC Trading point
7. RSI (Relative Strength Index):
RSI is around 37.66, nearing oversold territory, supporting a bullish reversal idea.
---
Trade Idea Summary:
Bias: Bullish
Entry Zone: Around 145.822 (fair value gap & trendline support)
Target Zone: 148.221
Stop Loss: Likely just below the demand zone or trendline
Confluence Factors:
Trendline support
RSI nearing oversold
Fair value gap zone
EMA 200 overhead (target acts as resistance)
---
Pelas support boost 🚀 analysis follow

XAU/USD) Bearish trand analysis Read The ChaptianSMC Trading point update
This chart analysis is for Gold Spot (XAU/USD) on the 1-hour timeframe. Here’s a breakdown of the idea shown:
---
Key Points in the Analysis:
1. Current Price:
XAU/USD is around $2,982.92 at the time of the chart.
2. Trend:
The chart suggests a bearish outlook.
Price has been consistently rejected from the yellow supply zone (around 3,020–3,033).
EMA 200 (blue line) is above the current price, confirming downward momentum.
3. Rejection Zone:
Marked in yellow between 3,020 and 3,033. Labeled as “Reject points”.
Price failed to break above this zone multiple times.
4. Breakout Pattern:
Two descending rectangles highlight bearish continuation patterns.
A bearish flag or wedge is visible, followed by a breakout downward.
5. Target Zone:
Highlighted in yellow between 2,900 and 2,921, with target point at 2,920.615.
Price is expected to move down to this level.
6. RSI (Relative Strength Index):
RSI is declining and shows bearish divergence, supporting downside move.
Currently around 39.19, which is closer to oversold territory but still has room to drop.
Mr SMC Trading point
---
Trade Idea Summary:
Bias: Bearish
Entry Area: Rejection near 3,020–3,033 zone
Target: 2,920.615 (highlighted support zone)
Stop Loss: Could be placed above 3,033 (supply zone or EMA 200)
Confluence Factors:
EMA 200 rejection
Bearish RSI divergence
Repeated supply rejection
Breakout from bear flag structures
Pales support boost 🚀 analysis follow)

BTC/USD) Bullish reversal analysis Read The ChaptianSMC Trading point update
This is a bullish reversal analysis on BTC/USD (Bitcoin to USD) on the 4-hour chart, suggesting a potential long opportunity after a sharp corrective move.
---
Key Breakdown of the Chart:
1. Strong Downward Move with Potential Reversal:
Bitcoin experienced a sharp drop from the 88k region to ~74,387.50, now hitting a key demand zone (marked as "Orderblock").
2. Bullish Reaction Expected:
From the Orderblock support zone, a bullish reversal is anticipated.
The projected move aims to fill the imbalance and test the target zone between 87,152.94 and 88,557.14.
3. RSI Oversold:
RSI is around 32.27, indicating oversold conditions and adding confluence for a potential bounce.
4. EMA (200):
The 200 EMA lies around 85,153.85, which may act as dynamic resistance on the way up.
Mr SMC Trading point
5. Price Target:
The expected upside move is approximately +13,722.85 points (+18.75%), aiming for the supply zone above 87k.
---
Conclusion / Trade Idea:
Entry Zone: Near 74,387.50, the orderblock/demand area.
Target Zone: 87,152.94 – 88,557.14
Bias: Bullish short- to mid-term reversal.
Confluences: Oversold RSI, clean support zone, potential trendline bounce, and price inefficiency above.
---
Pales support boost 🚀 analysis follow)

EUR /USD) bullish flag Analysis Read The ChaptianSMC Trading point update
This is a bullish technical analysis on the EUR/USD pair (2-hour chart), projecting a long opportunity based on price action and market structure.
---
Key Elements of the Chart:
1. Strong Key Support Zone:
Marked around 1.09273, acting as a critical base.
Price previously reacted strongly from this level, confirming it as a high-probability support area.
2. Bullish Channel:
The pair is moving within an ascending parallel channel.
Price is currently rebounding off the lower channel trendline, suggesting upward continuation.
3. Breakout & Retest Pattern:
A small flag/pennant correction is shown after a strong bullish impulse.
Expected breakout from this flag will lead to continuation toward the upper resistance.
4. Target Zone:
1.12977 is marked as the final target point, around 2.55% (281.4 pips) away from the current price.
Previous high structure adds confluence to this target.
5. RSI (14):
RSI is hovering around 50.5, indicating neutral momentum but room for upside.
No clear divergence, but aligned with a possible bullish continuation.
6. 200 EMA (1.08501):
The price is above the 200 EMA, supporting the bullish bias.
Mr SMC Trading point
---
Conclusion/Idea:
This analysis suggests a long setup on EUR/USD, with:
Entry idea near the key support (1.09273),
Bullish flag breakout in progress,
Target near 1.12977,
Risk management advised below support or lower channel.
Bullish Bias: Price structure, EMA support, and trend channel favor a long setup.
---
Pales support boost 🚀 analysis follow)

XAU/USD) bearish rejected fvg analysis Read The ChaptianSMC Trading point update
This chart analysis of Gold (XAU/USD) on the 2-hour timeframe appears to be a bearish setup based on Smart Money Concepts (SMC). Here's a breakdown
Key Elements:
1. Price Channel Break & CHoCH:
The price was in a rising channel.
A clear Change of Character (CHoCH) occurred after the price broke below the structure, signaling a shift from bullish to bearish.
2. Fair Value Gap (FVG):
There's a bearish Fair Value Gap (FVG) highlighted in the yellow box around the 3,047–3,075 level.
The expectation is that price may retrace into this FVG before continuing downward.
Mr SMC Trading point
3. Target Zone:
A major demand zone or target point is marked around 2,940, indicating a potential bearish move of around -148 points (~4.8%) from the FVG.
4. EMA & RSI:
200 EMA is around 3,047, acting as dynamic resistance now.
RSI is below 40 and trending down, showing bearish momentum with slight bullish divergence, hinting at a short retracement before another drop.
---
Summary of the Idea:
Bias: Bearish
Trade Plan:
Wait for price to retrace into the FVG zone (~3,047–3,075).
Look for bearish confirmation (like bearish engulfing or rejections).
Enter short with a target at 2,940, stop above FVG.
Pales support boost 🚀 analysis follow)

JPY/USD 30-Min Chart – Bearish Setup from Resistance Zone with 2200 EMA (blue): 0.0067930
30 EMA (red): 0.0068478
Current Price: 0.0068313
Price Position: Currently between the EMAs, showing consolidation and potential indecision.
🟪 Key Zones Identified
Entry Zone (Sell Area): Around 0.0068740
Stop Loss Zone: Above the resistance area at 0.0069118
First Target Zone (EA Resistance Point Target): Around 0.0067636
Final Target Zone (EA Target Point): Around 0.0066745
📉 Short Trade Plan
Entry Point: Price re-tests the resistance zone at 0.0068740
Stop Loss: Above key resistance at 0.0069118
Target 1 (TP1): 0.0067636
Target 2 (TP2): 0.0066745
Risk-to-Reward: Approx. 2.89x, with a -2.89% drop expected from entry to final target.
📊 Price Structure & Trend Insight
The chart shows bearish intent, with repeated rejections from the resistance zone.
A break below the 200 EMA and the support near 0.0067930 would signal stronger downside momentum.
The downward arrow and projection reflect a swing short setup based on market structure and key zones.
✅ Strategy Confirmation
Watch for:
Price rejection from the 0.0068740 level.
Bearish candlestick patterns in that zone (like bearish engulfing or shooting star).
Volume confirmation or momentum slowdown at resistance.

GOLD (XAUUSD) 30-Min Chart Analysis – Key Reversal & Breakout Zo200 EMA (blue): 3085.72 (bearish as price is below it)
30 EMA (red): 3033.52
Current Price: 3034.10
🟪 Key Zones (Highlighted in Purple)
Resistance Zone: Around 3045.54–3065.70
Support Zone: Around 2968.27
Previous High Zone / Target Area: 3158.42
📉 Short Trade Setup (Blue Arrow Going Down)
Entry Area: If price rejects the resistance zone around 3045–3065
Stop Loss: Above the zone, around 3065.70
Take Profit: At the support zone, 2968.27
Risk-to-Reward: Approx. 2.4x (shown as -2.43%)
📈 Long Trade Setup (Blue Arrow Going Up)
Entry Area: If price breaks and holds above the 3065.70 zone
Stop Loss: Below 3045.54 zone
Take Profit: 3158.42 (previous resistance)
Risk-to-Reward: Approx. 3.0x (shown as 3.00%)
💡 Analysis Summary
Price is currently ranging just below the resistance zone.
Two possible scenarios:
Rejection from the zone → short entry.
Breakout above zone → long opportunity.
Use EMA alignment for confirmation:
Bearish if price stays below both EMAs.
Bullish if price breaks above 200 EMA (3085.72).

This chart shows a potential bullish setup for Gold (XAUUSD) on This chart shows a potential bullish setup for Gold (XAUUSD) on the 15-minute timeframe, with some key technical elements and a projected trade idea. Here's a breakdown of the analysis:
1. Current Market Overview
Price: Trading around $3,038.51.
Trend: Recent downtrend followed by a minor recovery.
Indicators:
EMA 200 (Blue): Currently at $3,090.41, acting as a dynamic resistance.
EMA 30 (Red): Positioned below the EMA 200, indicating a still bearish trend but with potential for a pullback.
2. Key Zones & Labels
Limit Entry Zone: Highlighted around $3,025.72 (bottom purple zone)
Labeled as “LIMIT ENTRY”, indicating a potential buy entry.
This area corresponds with a fair value gap (fvg) — often used in smart money concepts as a sign of institutional interest.
Target Zone: Around $3,082.22 (top purple zone)
Labeled as “target point EA”.
Lies just below the EMA 200 resistance level, which is a likely take-profit area for a bullish move.
3. Projected Price Action
A possible bullish retracement is anticipated:
Dip into the limit entry/fvg zone at ~$3,025.
Then, a rally targeting the $3,082 zone, possibly extending toward the EMA 200 at ~$3,090.
4. Trade Setup (Based on the Chart)
Entry: Around $3,025.72 (limit buy)
Target: Between $3,082.22 - $3,090.41
Risk: Likely below the FVG zone (~$3,015–$3,020), depending on risk appetite.

Gold (XAU/USD) Technical Analysis: SMC Trading point update
This chart is a technical analysis of Gold (XAU/USD) on a 4-hour timeframe. Here’s a breakdown
1. Ascending Channel:
The price is moving within an upward channel, showing a bullish trend.
Higher highs and higher lows confirm the uptrend.
2. Support and Resistance Zones:
Yellow Boxes: Key support zones where price previously consolidated before moving higher.
Red Arrows: Marking resistance zones where the price faced rejection.
Green Arrows: Indicating support levels where the price bounced.
3. Current Price Action:
Price recently dropped to a key support zone (around $3,050).
A bullish reaction is expected from this level.
If support holds, the price may continue the uptrend toward the target of $3,186.
4. Projected Move:
The black zigzag line suggests a potential bounce from support.
If the support level holds, price could move back up within the channel.
Mr SMC Trading point
Conclusion:
If price respects the support zone, there could be a good buying opportunity.
A break below the support zone would signal potential bearish movement.
Monitoring price action around the yellow zone is crucial for confirming direction.
Pales support boost 🚀 analysis follow )

USD/JPY Bullish Reversal: Order Block & EMA 200 TargetSMC Trading point update
This chart presents a technical analysis of USD/JPY on the 1-hour timeframe. The key insights from this analysis are:
1. Order Block & Potential Reversal
The price has dropped significantly and reached a highlighted order block zone (a key demand area).
A potential inverse head and shoulders pattern is forming, indicating a possible bullish reversal.
2. Expected Bullish Movement
The price is expected to bounce from the order block, creating a bullish structure.
The projected move suggests a retracement toward a resistance zone, which aligns with previous price action.
Mr SMC Trading point
3. Target Zone & EMA 200
The target zone is around 148.946 - 149.178, aligning with the 200 EMA, a significant resistance level.
4. RSI Indicator
The RSI is currently low (~38.93), indicating potential for a reversal as the market may be oversold.
Conclusion
The chart suggests a bullish retracement after the recent drop, targeting the resistance zone near the 200 EMA. However, confirmation is needed (e.g., bullish price action, volume increase) before taking a trade. Keep an eye on fundamental news that may impact USD/JPY volatility.
Pales support boost 🚀 analysis follow)

EUR/USD Bearish Correction: Resistance Rejection & Support TargeTrading point update
This chart provides a technical analysis of EUR/USD on the 3-hour timeframe with key insights:
Analysis & Expectations
1. Overbought Condition & Rejection
Price reached a strong resistance zone (highlighted in yellow) around 1.11425 - 1.10751, leading to a sharp rejection.
The RSI is in the overbought zone (~68.43) and showing a downward slope, indicating a potential bearish correction.
Mr SMC Trading point
2. Expected Bearish Correction
A potential drop is expected toward the support level around 1.08501 - 1.07925, aligning with past price action.
The 200 EMA (1.07757) also serves as a significant support level, reinforcing a possible retracement.
3. Target Levels
Short-term Bearish Target: 1.08501 (Support level)
Key Support Zone: 1.07925 - 1.07757 (Near 200 EMA)
Conclusion
The analysis suggests a bearish retracement after the strong bullish move. Traders may look for short opportunities targeting the support level and 200 EMA while watching for confirmation signals before entering.
Pales support boost 🚀 analysis follow)

Gold (XAU/USD) Technical Analysis: Key Resistance Test Before BrThis chart represents a Gold (XAU/USD) 30-minute timeframe analysis from TradingView. Here are the key takeaways:
Technical Indicators & Levels
Exponential Moving Averages (EMAs)
200 EMA (Blue Line): 3,110.97 – A long-term trend indicator.
30 EMA (Red Line): 3,134.65 – A short-term trend indicator.
Key Levels
Resistance Point: Around 3,136.56.
Support Zone (Stop Loss Level): 3,103.16.
Target Point: 3,167.44, indicating a potential 1.62% upside.
Potential Trade Setup
Scenario 1 (Bullish Case):
If price breaks above resistance (3,136.56) and holds, the next target is 3,167.44.
A bullish breakout could indicate further momentum.
Scenario 2 (Bearish Case):
If price fails to break resistance and drops, it could test the support zone around 3,103.16.
A break below this level might lead to further downside.
Pattern Analysis:
The chart suggests a potential retest of resistance before a breakout.
A possible accumulation phase before a strong move.
Conclusion
Bullish above 3,136.56, targeting 3,167.44.
Bearish below 3,103.16, watching for downside risk.
The 200 EMA (3,110.97) could act as dynamic support.

Gold (XAUUSD) 30-Minute Trade Setup: Bullish Reversal from SuppoThis chart represents a trading analysis for Gold (XAUUSD) on a 30-minute timeframe. Here are the key points from the chart:
Technical Indicators:
EMA (30, close) - Red Line: 3,124.52 (shorter-term trend)
EMA (200, close) - Blue Line: 3,090.41 (longer-term trend)
Trade Setup:
Entry Point: 3,108.21
Stop Loss: 3,098.52 (just below the support zone)
Target Point: 3,149.04 (potential profit level)
Analysis:
The price is currently bouncing from a purple support zone, which aligns with a short-term retracement.
The 30 EMA (red) is currently above the price, indicating short-term resistance.
The 200 EMA (blue) is significantly lower, showing that the overall trend is still bullish.
A potential long (buy) trade is suggested, as price is expected to reverse from the support level towards the target point of 3,149.04.
Risk-to-Reward Ratio:
The stop loss is set below the key support level to minimize risk.
The target price provides a significant profit potential.
Conclusion:
If price holds above 3,108.21, there is a strong bullish case.
If price breaks below 3,098.52, the bullish setup may become invalid.
Monitoring the 30 EMA resistance will be crucial for confirmation.

Bitcoin (BTC/USD) Short Trade Setup: Resistance Rejection & TargThis chart is a Bitcoin (BTC/USD) 15-minute price chart from TradingView, showing a potential short trade setup based on technical analysis. Here’s a breakdown of the key elements:
1. Resistance Zone & Short Setup
The purple highlighted area represents a resistance level around $85,358.
Price is consolidating within this resistance zone, suggesting a potential reversal.
The expected scenario involves a price rejection from this resistance, leading to a downward move.
2. Moving Averages
EMA (200, blue line) at $83,433: A long-term trend indicator suggesting a strong support zone.
EMA (30, red line) at $84,657: A short-term trend indicator, currently above the price, indicating a potential bearish setup if the price moves below it.
3. Target & Stop-Loss Le

Gold (XAUUSD) Bullish Trade Setup: Demand Zone Entry & Target PrThis is a gold (XAUUSD) trading chart from TradingView, showing a technical analysis setup on the 1-hour timeframe.
Key Observations:
Uptrend: The chart shows a strong bullish trend, with price making higher highs and higher lows.
Demand Zone (Entry Point):
A highlighted yellow zone around $3,121.38 indicates a demand area where price is expected to bounce.
This could be a support level or a key order block.
Stop Loss: Placed at $3,112.40, below the demand zone, to minimize risk in case the trade fails.
Target Point:
Set at $3,177.94, which is 1.69% above the entry point.
The expected reward is 52.77 points.
Risk-Reward Ratio: This setup follows a risk-reward strategy, aiming for a potential gain significantly higher than the risk taken.
Trading Strategy:
If the price retraces into the demand zone, a long position (buy) is expected.
A bounce from this zone could lead to a price surge towards the target.
If price falls below the stop-loss level, the trade is invalidated.
Conclusion:
This is a bullish setup relying on a pullback to a key support zone before continuation. Traders may monitor price action in the yellow zone for confirmation before entering a trade

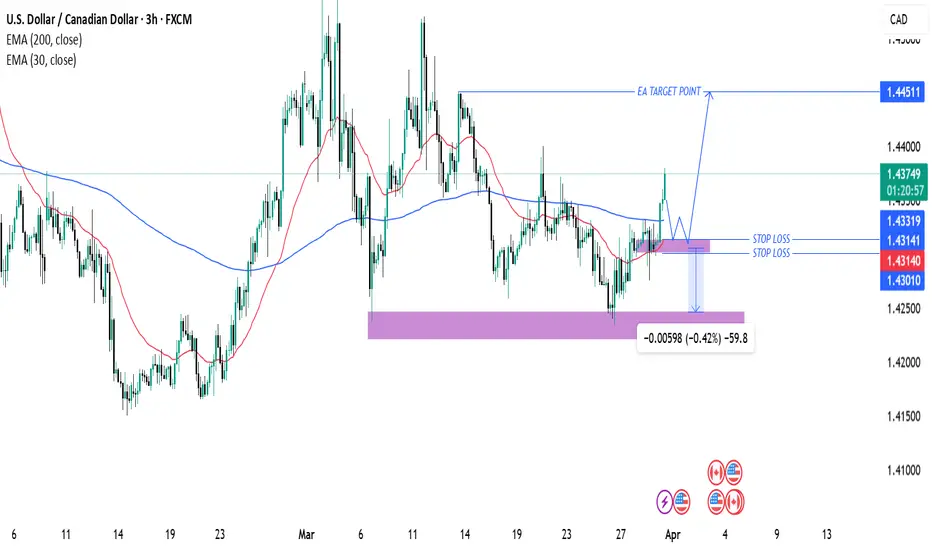
USD/CAD Bullish Trade Setup: Key Support, Entry, and Target AnalThis chart is a technical analysis of the USD/CAD currency pair on a 3-hour timeframe. Here’s a breakdown of the key elements:
Key Observations:
1. Exponential Moving Averages (EMAs):
200 EMA (Blue Line) at 1.43318 – A long-term trend indicator.
30 EMA (Red Line) at 1.43135 – A short-term trend indicator.
The price is currently trading above both EMAs, suggesting a bullish bias.
2. Support and Resistance Levels:
A support zone (purple box) around 1.43010 to 1.43141 has been identified, which the price is expected to respect.
The target level (EA TARGET POINT) is set at 1.44511, indicating a bullish price movement expectation.
3. Entry, Stop Loss & Take Profit:
Entry Point: Near the 1.43318 level (current price area).
Stop Loss: Placed below the supp
AUD/PLN Technical Analysis – Reversal Opportunity AUD/PLN Chart Analysis (1H) on TradingView 📊 🔴 Overall Trend: ➡️ The price is following a bearish trend 📉, trading below the 200 EMA (🔵 2.45308) and the 30 EMA (🔴 2.43309). ➡️ The market is showing selling pressure, but the price has reached a key support zone 🟣. 🟣 Support Zone (Possible Reversal) 🔵 Potential Entry: 📍 2.41633 (inside the support zone) 🔵 Stop Loss: ❌ 2.40157 (below support) 🔵 Take Profit: ✅ 2.46072 (near resistance and the 200 EMA) 📈 Movement Projection: 🔹 An upward movement of 1.82% 🚀 (0.04389 points) is expected. 🔹 To confirm the uptrend, the price must break above the 30 EMA 🔴 and the 200 EMA 🔵. 💡 Conclusion: 🔸 The chart suggests a buy strategy in the support zone with a target at the resistance. 🔸 If the price breaks the support, it could continue its decline 🚨.

Gold (XAUUSD) 15-Minute Chart Analysis: Bullish Setup with Key SGold (XAUUSD) 15-Minute Chart Analysis
Key Technical Indicators:
Current Price: $3,122.28
30 EMA (Red Line): $3,115.90 (Short-term trend indicator)
200 EMA (Blue Line): $3,081.17 (Long-term trend indicator)
Support Zone: Around $3,106.62
Target Point: $3,154.02
Analysis:
Trend:
The price is in an uptrend, as it is trading above both the 30 EMA and 200 EMA.
The 30 EMA is acting as dynamic support, showing strong buying interest at pullbacks.
Key Levels:
Support: $3,106.62 (marked in blue) is expected to hold as a key support level.
Resistance Zone (Previous Supply Area): Around $3,090-$3,100 (shaded purple) was previously a resistance zone but has now turned into support.
Target Level: $3,154.02 is the expected bullish target if the price respects the support zone.
Trade Setup:
Bullish Scenario: The price may pull back to the support zone (~$3,106.62) before bouncing higher towards the target.
Stop Loss: Below $3,106.62 to minimize risk.
Entry Point: A retest of the support area with bullish confirmation could provide an optimal entry for a long trade.
Risk Management:
Stop Loss: Set just below the support zone.
Reward-to-Risk Ratio: Favorable if targeting $3,154.02 with a stop at $3,106.62.
Conclusion:
The chart suggests a bullish outlook, with price expected to continue its upward momentum if support holds.
A breakout above $3,123 could further confirm bullish strength.
Caution: If the price breaks below $3,106, further downside movement toward the 200 EMA ($3,081.17) is possible.

USD/JPY Bullish Trade Setup – Key Support & Target ProjectionThe chart represents a USD/JPY (U.S. Dollar / Japanese Yen) 30-minute timeframe trade setup. Below is the analysis:
Technical Analysis:
Key EMAs:
200 EMA (Blue Line): 150.367 – Serves as dynamic support.
30 EMA (Red Line): 150.753 – Currently acting as resistance.
Support & Resistance Zones:
Entry Zone: 150.356 - 150.367 (Highlighted in purple).
Stop Loss: 150.022 (Below the key support).
Target Point: 151.269 (Near previous highs).
Market Structure & Price Action:
The price is pulling back into the highlighted demand zone.
A possible bullish reaction is expected at this level, leading to an upside push toward 151.269.
If the support holds, the price may bounce and confirm an uptrend continuation.
Trade Plan:
Entry: Around 150.367 after confirmation of price rejection.
Stop Loss: Below 150.022 (to protect against downside risk).
Take Profit: 151.269 (Aligns with previous high and resistance).
Conclusion:
The setup favors a buy trade if price action confirms a bounce from the demand zone.
A break below the stop-loss level may invalidate the setup, signaling a potential bearish continuation.

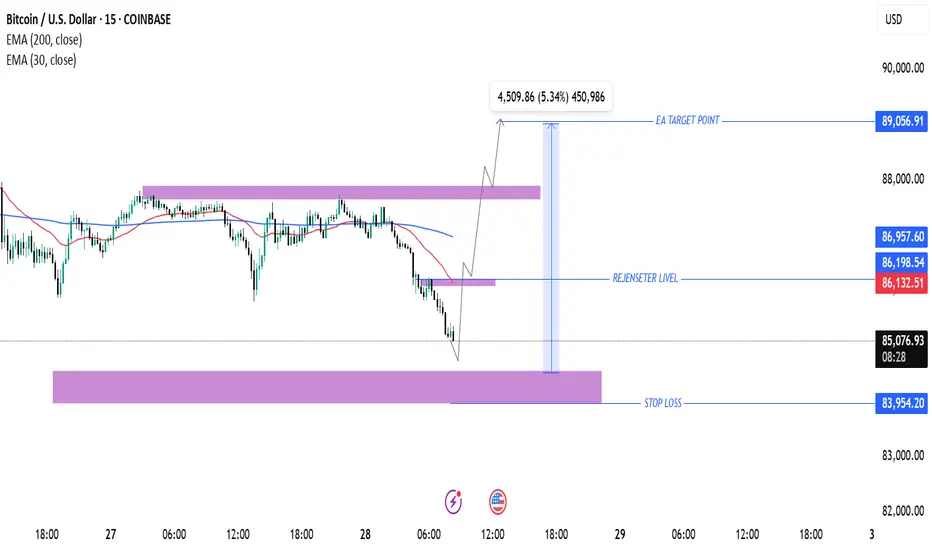
Bitcoin (BTC/USD) Trade Setup: Potential Reversal & Target Proje200 EMA (Blue): 86,960.21
30 EMA (Red): 86,149.39
The price is currently below both EMAs, indicating a short-term bearish trend.
Key Levels:
Stop Loss: 83,954.20 (marked in blue at the bottom)
Re-entry Level: 86,198.54 (near the 30 EMA)
Target Price: 89,056.91
Support & Resistance Zones:
Strong Support Zone: Around 83,954.20
Intermediate Resistance: Near 86,198.54
Major Resistance Zone: Close to 89,056.91
Trade Setup & Projection:
The chart suggests a potential reversal from the support zone.
The expected price movement shows a bounce from support, a breakthrough of the intermediate resistance, and a push toward the target price (89,056.91).
The expected gain is 4,509.86 points (5.34%).
Conclusion:
If BTC holds the support zone, an upside move is likely.
Breaking above 86,198.54 would confirm a bullish reversal.
Failing to hold support at 83,954.20 could lead to further downside.