XAUUSD – Potential Reversal Zone Forming After BOS & CHoCH StrucChart Analysis
Based on the structure shown in your TradingView screenshot:
1. Market Structure
The chart shows a clear bullish trend leading into the current price.
Multiple Break of Structure (BOS) marks confirm buyers have been in control.
The earlier CHoCH indicates a temporary shift, but price reclaimed bullish momentum afterward.
2. Current Zone
Price has pushed into a potential reversal or supply area, shown by the shaded region around the “ENTRY” label.
This suggests you are planning a sell (short) position from that zone.
3. Premium/Discount Logic
Price is currently in the premium zone of the swing leg.
The “50% TP” line marks the midpoint of the recent bullish impulse—typical target when expecting a corrective move.
4. Short Setup Elements
Entry: At the top of the shaded zone (likely an imbalance or order block).
Stop-Loss: Presumably above the swing high inside the grey shaded area.
Take-Profit: At the 50% retracement of the previous impulse, which aligns with structure.
5. Momentum & Candlestick Behavior
The latest candles show slowing momentum into your entry zone—wicks and smaller bodies indicate weakening buyer pressure.
This supports the idea of a potential short-term reversal.
6. What Would Invalidate the Setup?
A decisive close above the upper boundary of the shaded zone → would signal continuation upward and invalidate the short.
7. What Strengthens the Setup?
Rejection wicks
Bearish engulfing from the entry zone
Lower time-frame BOS to the downside as confirmation
Foryourpage

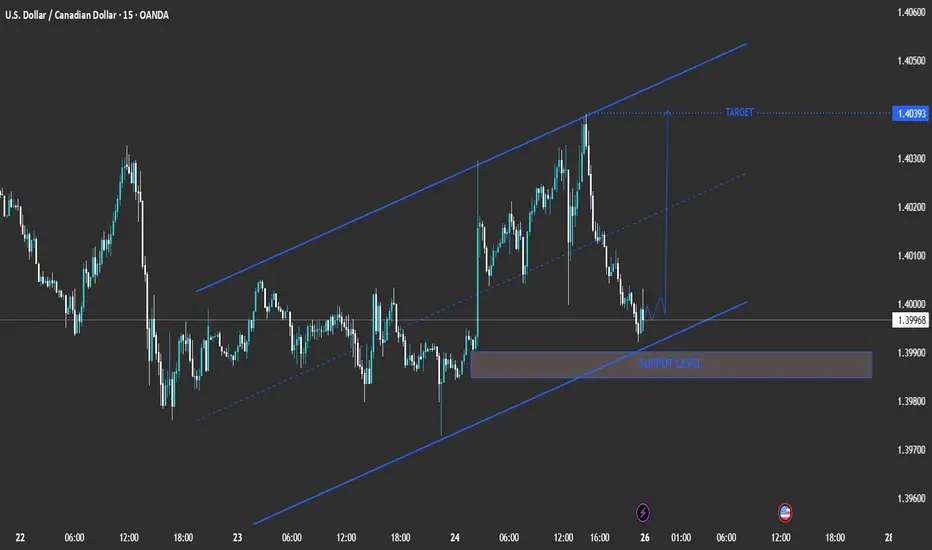
technical analysis of your chart for USD/CAD (15-minute timeframMarket Structure
The pair is moving within an ascending channel, indicating short-term bullish momentum.
Higher highs and higher lows confirm the ongoing uptrend structure.
🟦 Key Zone
Support Level: 1.3985 – 1.3990
This shaded zone represents a demand area where price previously found strong buying interest.
As long as this level holds, the short-term bullish bias remains valid.
🔹 Price Action Outlook
Price is currently testing the lower trendline of the channel and near the support zone.
A bullish reaction from this level could trigger a bounce toward the mid-channel and potentially the upper resistance.
🎯 Target
Upside Target: 1.4039
This corresponds to the upper boundary of the channel and a previous swing high area.
⚠️ Invalidation / Risk Level
A break below 1.3980 would invalidate the bullish setup and could lead to a bearish correction toward 1.3965 or lower.
📈 Trading Signal (Summary)
Bias: Bullish (short-term)
Entry Zone: 1.3985 – 1.3995 (support area)
Target: 1.4039
Stop-Loss: Below 1.3980 FX:EURUSD OANDA:EURUSD OANDA:GBPUSD FX:USDJPY OANDA:USDJPY OANDA:AUDUSD OANDA:GBPJPY OANDA:USDCAD OANDA:USDCHF FX_IDC:USDINR FOREXCOM:EURUSD OANDA:EURNZD
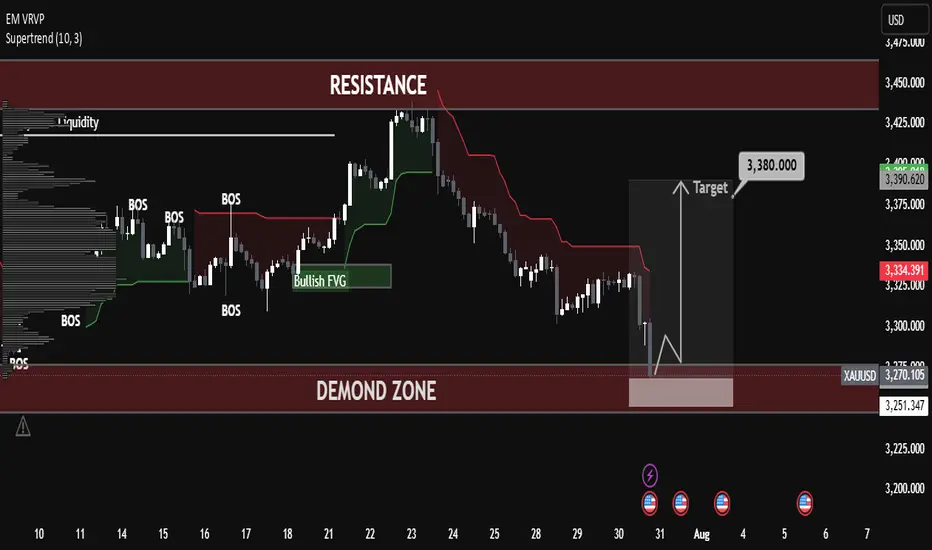
Gold Took Support – Now Bulls Are in Control! Gold Took Support – Now Bulls Are in Control!
Gold (XAUUSD) price has taken a strong bounce from the support zone, and now it’s looking bullish. Market reacted nicely from the demand zone, which means buyers are stepping in again.
📊 Technical Analysis:
✅ Strong Support Zone (3260–3280):
This area is acting like a strong base. Price touched here and immediately bounced — showing buying pressure.
🔄 Break of Structure (BOS):
Market broke the previous structure and gave signs of trend reversal. It also grabbed liquidity from the lows.
🟩 Bullish Fair Value Gap (FVG):
A clean FVG was formed and respected, which shows institutional activity and buying interest.
🎯 Target Level – 3366.984 USD:
If bullish momentum continues, gold can easily move towards this level. It’s also near a previous resistance.
📚 Educational Points:
Market took liquidity from the lows and reversed
Fair Value Gap is respected, adding confirmation
Structure break confirms buyers are in control
Price is heading towards the next resistance zone
📌 Conclusion:
Gold is now in a bullish phase. As long as the support zone is holding, buyers can stay confident. Target remains near 3366–3380 USD. Any pullback can give a good buy opportunity.
BTC Took Support – Big Move from Demand Zone Expected!🚀 BTC Took Support – Big Move from Demand Zone Expected!
Bitcoin (BTC/USD) has touched the demand zone and now showing signs of upside reversal. After taking out sell-side liquidity, price is getting ready for a bullish push toward higher targets.
📊 Technical Analysis:
🟤 Demand Zone (115,000 – 116,000):
Market came down and respected this zone. This is a strong area where buyers entered again.
🧲 Sell-Side Liquidity Grab:
Price formed equal lows, then broke them to collect liquidity before reversing — typical smart money behavior.
🔁 Break of Structure (BOS):
Structure break confirmed that trend might reverse now from bearish to bullish.
🟪 Fair Value Gap (FVG):
A clean FVG is also visible near the top side, and price may move to fill this imbalance.
🎯 Target: 119,000 USD:
If bulls hold the demand zone, BTC can easily move towards this resistance area. This is the short-term upside target.
📚 Key Learning Points:
Liquidity was collected below equal lows
Buyers stepped in from the demand zone
Break of structure confirms bullish pressure
FVG + Resistance area aligns with target
✅ Conclusion:
As long as BTC holds above 116,000, bulls are in control. This is a good zone for long entries, with a target near 119,000. Traders should watch for confirmation with minor BOS or strong bullish candles.

USD/JPY) LOGN TIME Analysis Read The captionSMC trading point update
Technical analysis of USD/JPY on the daily timeframe, highlighting a long-term downtrend reversal with potential for significant upside.
---
Analysis Summary
Pair: USD/JPY
Timeframe: Daily
Current Price: 147.442
Bias: Bullish breakout from a descending wedge structure.
---
Key Technical Insights
1. Descending Trendline Break:
Price has broken above the long-term downtrend line, signaling a reversal.
Breakout area is circled in yellow, confirming bullish intent.
2. Trendline & Structure Support:
Multiple rejections from the ascending support trendline (marked by green arrows) confirm accumulation and higher lows.
3. 200 EMA as Dynamic Resistance/Support:
Price is now above the 200 EMA (147.920) — a bullish signal, turning resistance into support.
4. RSI (14):
RSI at 62.99, approaching overbought territory, but still has room to push further.
---
Target Point
Target: 158.951
Based on measured move from wedge breakout and historical resistance level.
---
Trade Setup Idea
Direction Entry Stop-Loss Target
Buy 147.40–147.60 Below 145.80 158.95
Mr SMC Trading point
---
Summary
This chart signals a major bullish breakout on USD/JPY, with the break of a year-long downtrend structure, reclaiming the 200 EMA. If this breakout sustains, price could aim for 158.95 in the coming weeks.
Please support boost 🚀 this analysis)

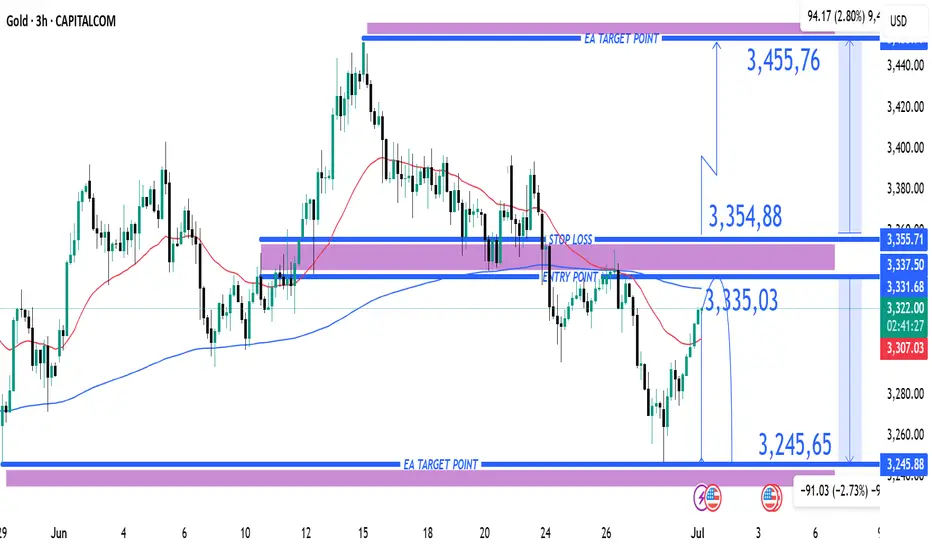
(XAU/USD) 3H Chart – Bearish Reversal Setup from Resistance Zone1. Entry Point (Sell):
Marked at 3,335.03
This is a key resistance level where price is expected to reverse downward.
2. Stop Loss:
Placed above at 3,354.88
This acts as a protection level in case the trade goes against the direction.
3. Take Profit Targets (EA Target Points):
TP1 (Downside): 3,245.65
TP2 (Upside - if Stop Loss is hit): 3,455.76 (in case of reversal or long position)
4. Price Action Observation:
Price is currently around 3,320.56, climbing back toward the entry zone.
The red 50-period moving average (EMA) and blue 200-period MA show convergence, often preceding volatility.
---
📉 Bearish Scenario (Main Setup)
Sell Bias is expected from the 3,335 region.
If price respects the resistance zone and breaks down again, the target is 3,245.65, yielding approximately 90-point move.
This is a risk-reward favorable setup, with:
Risk: ~20 points
Reward: ~90 points
RRR ≈ 1:4.5
---
⚠️ Bullish Invalidity (Stop Loss Hit)
If the price breaks and closes above 3,354.88, it invalidates the bearish setup.
Then, the market may shift towards targeting 3,455.76 — about 100 points to the upside.
---
🔧 Technical Factors Supporting the Setup
Supply zone marked by the purple box around the entry.
Trend previously bearish — recent upward move may just be a retracement.
Confluence with MAs: Price is testing MAs — rejection here would add bearish confirmation.
---
✅ Summary of Trade Setup
Element Value
Entry 3,335.03
Stop Loss 3,354.88
Take Profit 3,245.65
Alt Target 3,455.76 (if SL hit)
Risk-Reward ~1:4.5
Bias Bearish (Sell Setup)
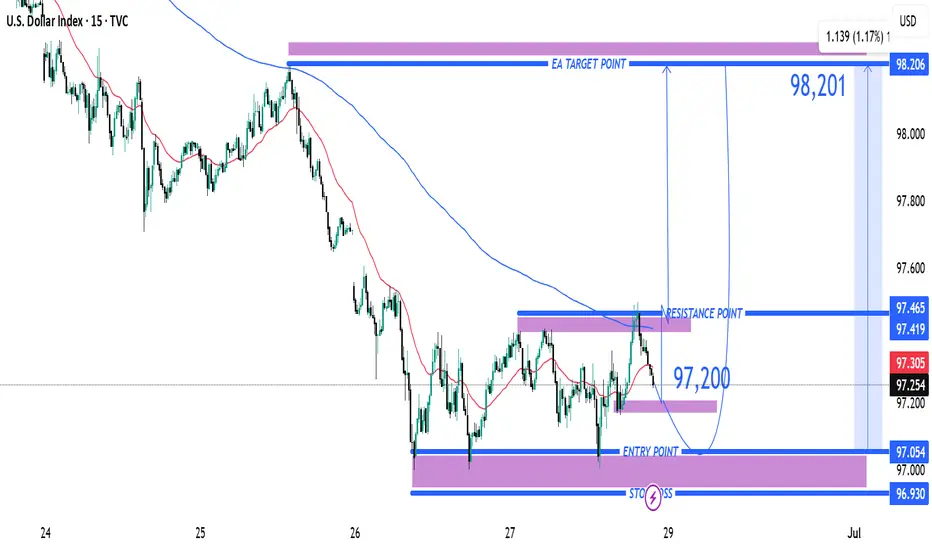
Entry Point Marked at: ~97.200 The price has already reacted m Entry Point
Marked at: ~97.200
The price has already reacted multiple times around this level, suggesting it's a key support zone.
🛑 Stop Loss
Placed at: ~96.930
Just below the support zone, protecting against a breakdown below recent lows.
This implies a risk of about 27 pips from the entry.
🎯 Target Point (TP)
Marked at: ~98.201
Strong resistance zone from previous price action.
Target implies a potential reward of 100+ pips, offering a risk-reward ratio (RRR) of ~3.7:1, which is favorable.
📊 Resistance Area
Around 97.419–97.465
This is the first obstacle the price must break through to confirm bullish continuation.
The 200 EMA (blue curve) is currently acting as dynamic resistance, aligning near this zone.
📉 Indicators
Moving Averages:
Red: Likely 50 EMA
Blue: Likely 200 EMA
Price is currently below both EMAs — so trend is still bearish, but trying to shift.
📌 Strategy Insight
The setup anticipates a bullish reversal from 97.200, aiming for a breakout above the 200 EMA and resistance to reach the 98.201 zone.
For confirmation, watch for a strong bullish candle close above 97.465, which would validate upside continuation.
⚠️ Risks
Price is still under both moving averages → downward momentum may persist.
If support at 97.00 breaks, downside acceleration could occur.
✅ Conclusion:
This is a bullish breakout setup on DXY with:
Defined entry and stop-loss.
Clear target.
High RRR.
But it’s crucial to wait for confirmation above resistance (97.465) before full conviction on the long trade.
ETHUSD Entry at $2,422 with Target at $2,521and Support at 2,3921. Entry Point: ~2,422.2
This is the suggested buy area based on a recent bounce from the support zone.
2. Support Zone (Purple Box):
Bottom boundary: ~2,392.4
Top boundary: ~2,408.4
Price has bounced multiple times here, showing strong buying interest.
3. Resistance Point: ~2,463.9
A clear horizontal resistance line, previously tested.
4. EA Target Point: ~2,522.1
A bullish target if the price breaks above the resistance level.
---
🔶 Highlighted Patterns / Markers
Orange Circles: Indicate key swing highs and lows — possibly used to identify double tops/bottoms or rejection/wick zones.
Blue Arrows: Illustrate the anticipated move from:
Entry (2,408.1) → Resistance (2,463.9) → Target (2,521.2)
Target gain = +111.7 USD (+4.64%)
---
🔻 Stop Loss Level
Set just below the support box at ~2,392.4
Protects from false breakouts or deeper pullbacks.
---
📈 Strategy Outlook
Bullish Bias: The setup expects a breakout from the current price range.
Risk-Reward Ratio: Appears favorable — tight stop and wide target.
Confirmation Needed: A solid breakout and hold above 2,423–2,425 may be the early confirmation signal.
---
📌 Summary
Element Value
Entry Point ~2,422.2
Stop Loss ~2,392.4
Resistance ~2,463.9
Target (TP) ~2,521.2
R:R Ratio Approx. 3:1
Bias Bullish

XAUUSD Setup Short Trade Opportunity Below ResistanceCurrent Price: 3,327.56 USD
Entry Point: 3,332.67 USD
Stop Loss: 3,342.45 USD
Take Profit Levels:
Target 1 (Downside): 3,294.45 USD (-1.17%)
Target 2 (Upside): 3,393.78 USD (+1.50%)
🔧 Technical Indicators & Tools
Trade Line: Upward sloping trendline connecting higher lows, supporting recent bullish structure.
Moving Averages:
Red: Short-term (likely 50-period EMA)
Blue: Long-term (likely 200-period EMA)
Price is still trading below the long-term MA, suggesting broader bearish pressure.
Resistance Zone: 3,334.96–3,341.30 — a key supply area marked in purple.
Support Zone: 3,294.45 — identified as a previous demand level.
⚖️ Risk-Reward Analysis
Short Setup:
Entry: 3,332.67
Stop Loss: 3,342.45 (Risk ~10 USD)
Target: 3,294.45 (Reward ~38 USD)
R:R Ratio ≈ 1:3.8, which is favorable for a short trade.
📌 Summary
Bias: Bearish intraday
Setup Type: Short-sell at resistance zone
Confirmation: Price rejection or bearish candle near 3,334–3,342 zone
Invalidation: Break and close above 3,351.06 (upper resistance)

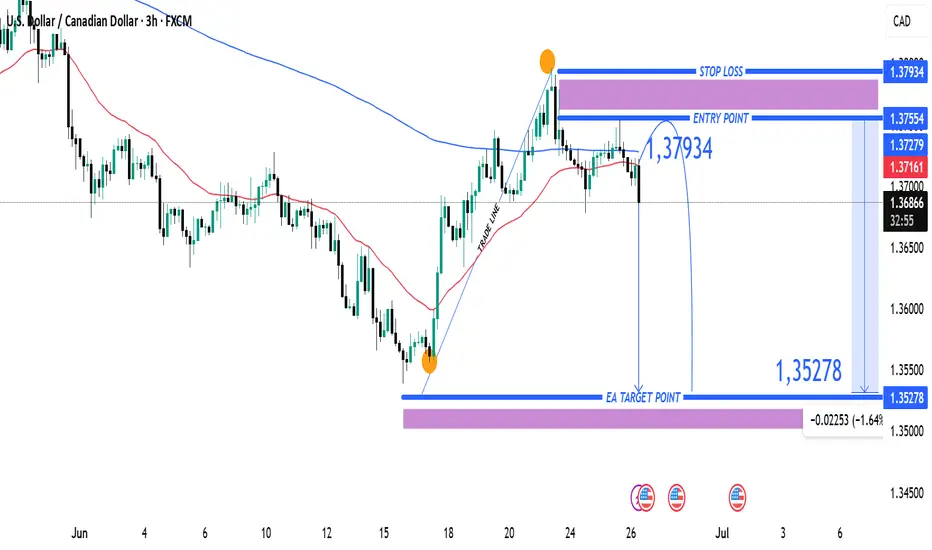
USDCAD Bearish Reversal Trade Setup – 3H Chart Analysis (June 26 Entry Zone: 1.37279 – 1.37554
🔹 Stop Loss: 1.37934
🔹 Target: 1.35278
🔹 Risk-to-Reward (RR): ~1:2.5
🧠 Technical Breakdown
Trend Overview:
Overall trend shows a downtrend from earlier June, followed by a corrective bullish move.
Price failed to sustain above the 200 EMA (blue line), indicating continued bearish pressure.
Trade Line Break:
A steep bullish trendline was broken, signaling a potential trend reversal or deeper pullback.
Bearish Rejection Zone:
The purple zone (1.37279 – 1.37554) acted as resistance.
Price formed a lower high and rejected this zone, confirming selling interest.
Entry Strategy:
Short entry is ideally within or just below the rejection zone.
Aggressive entry already in play at current market price (1.36909) after confirmation.
Target Zone:
Projected towards 1.35278, aligning with previous support and fib retracement zone.
Large purple support zone near the target suggests a potential reversal area.
⚠️ Risk Notes
Be cautious of USD volatility due to upcoming economic events (noted with icons on the chart).
Stop loss above previous swing high minimizes risk of fakeouts.
✅ Summary:
This is a bearish swing setup aiming for a significant drop toward 1.35278. The clean rejection from resistance and trendline break supports a high-probability short opportunity with favorable risk-reward.
USD/JPY Bullish Reversal Trade Setup – Key Support Test at 145.2Entry Point: 145.273 (highlighted in blue)
Stop Loss: ~144.817–145.260 (purple zone)
Target Point (TP): 148.133 (upper resistance zone)
📉 Recent Price Action:
Price peaked near 148.05 before reversing sharply and breaking the trendline.
The market is currently testing the support zone (near the 145.273 entry level).
Moving averages (red = short-term, blue = long-term) show a crossover to the downside, suggesting short-term bearish momentum.
📈 Trade Setup:
Strategy Type: Long (Buy) Setup
Risk/Reward: Favorable, approximately 1:2+
Entry Zone: The current price is close to the entry level at 145.273, making this a timely area to watch for a bounce or confirmation.
⚠️ Risk Factors:
If price breaks below 144.817, the setup becomes invalid.
Short-term momentum is still bearish; confirmation (like a bullish engulfing candle or support hold) is important before entering.
✅ Confirmation Triggers for Entry:
Strong bullish candlestick pattern near entry zone.
RSI or MACD bullish divergence (not shown but useful to check).
Volume spike on bounce from support.

Gold XAU/USD Bullish Reversal Setup – Targeting $3,454.65Price: $3,384.41
Strategy: Buy/Long
🟦 Key Levels:
Entry Zone: Around $3,345.76
This level aligns with a previously tested support zone marked in purple.
Stop Loss: $3,331.56
Below the support zone, providing downside protection if the setup fails.
Target (TP): $3,454.65
Marked as EA TARGET POINT, suggesting a potential upside of 3.16% (~$105.83 gain).
📊 Technical Indicators:
Moving Averages:
200 EMA (blue): Near the entry level, adds strength to the support zone.
50 EMA (red): Recently crossed below price, indicating early bullish momentum.
Price Action:
Sharp bounce from support suggests buying interest.
Potential inverse head and shoulders pattern forming, which is a bullish reversal pattern.
🧠 Trade Idea:
Buy near $3,345.76,
Stop Loss at $3,331.56,
Take Profit at $3,454.65
Risk/Reward Ratio ≈ 1:3.3 — favorable setup for long positions.

USD/JPY Long Trade Setup – Key Support Rebound Targeting 148.674Entry Point:
Price: 143.373
The chart suggests initiating a long (buy) position at this level, which is just slightly below the current market price.
Stop Loss:
Price: 141.707
Positioned below a strong support zone. This level protects the trade from excessive downside risk if the price breaks down.
Target Point:
Price: 148.674
The target is clearly defined, indicating a potential gain of approximately 5.991 points, or 4.20% from the entry.
🟪 Support/Resistance Zones
The purple boxes indicate demand (support) and supply (resistance) zones.
The lower zone (entry/stop area) shows a historically significant support range that has been tested multiple times (indicated with orange circles).
The upper purple zone marks the take-profit area, which coincides with previous resistance.
📊 Moving Averages
Blue Line: 200 EMA (Exponential Moving Average) – acting as dynamic resistance.
Red Line: 50 EMA – price is currently trading below it, indicating bearish short-term pressure but potential for reversal.
🧠 Trade Idea Summary
Bias: Bullish (long position)
Risk-Reward Ratio: Favorable
Risk: ~1.67 points (from 143.373 to 141.707)
Reward: ~5.3 points (from 143.373 to 148.674)
Approx. R:R = 1:3.17
Validation: The setup relies on the price holding the key support zone and bouncing higher, targeting the next major resistance.
⚠️ Considerations
Monitor for bullish candlestick patterns near the entry zone.
Keep an eye on macroeconomic news (like BoJ or Fed updates) that could cause volatility in USD/JPY.
Confirm momentum shift with RSI or MACD if using indicators.

BTC/USD Bullish Setup: Double Bottom Breakout Targeting $110,000 Trade Setup Analysis
1. Support & Resistance Zones
Support Zone (Buy Zone):
Highlighted in purple, between $103,764 and $104,633, with a noted stop loss area near $104,061.
Resistance/Target Zone (Take Profit Area):
Around $109,878 – $110,002 labeled as “EA TARGET POINT”.
2. Double Bottom Pattern (Bullish Signal)
There are two orange circles at the bottom, indicating a double bottom pattern—often a bullish reversal signal.
This is supported by a neckline break near the entry point at $104,534.
3. Moving Averages
Two moving averages are displayed:
Likely a short-term MA (red) and a medium/long-term MA (blue).
The price crossing above both suggests bullish momentum.
4. Trade Plan
Entry Point: Around $104,534
Stop Loss: Below $104,061
Take Profit (Target): $109,878 – $110,002
Risk/Reward Ratio: High, given the tight stop and wide target.
📈 Price Projection
The blue arrowed path suggests:
A minor dip or consolidation near $104,534, followed by a strong upward move toward the target zone.
The movement outlines a classic cup-and-handle or double-bottom breakout pattern.
🧠 Conclusion
This is a bullish trading setup for BTC/USD with a favorable risk-reward ratio. The chart suggests:
Buying near $104,534
Stop loss just below support
Targeting a move to ~$110,000

Gold (XAU/USD) Bullish Breakout Trade Setup – Targeting $3,4201. Entry Point Zone (~3,302.88 - 3,317.09):
This is the area where a long position (buy) is suggested.
The price has already moved slightly above this zone, indicating the trade may have already been triggered.
2. Stop Loss (~3,260.41 - 3,299.02):
Positioned below the entry zone to limit downside risk.
Suggests that if the price drops below this support zone, the trade idea is invalidated.
3. Target Point (3,420.41):
A bullish target suggesting a potential upside move of ~117.62 points (or ~3.56%).
This zone acts as a take-profit level.
4. Technical Indicators:
Moving averages (possibly 50 EMA in red and 200 EMA in blue) show a bullish crossover recently, supporting the upward momentum.
5. Pattern Outlook:
The chart implies a possible cup-and-handle or bullish consolidation breakout pattern, anticipating continuation upward.
Summary:
The strategy depicted is a bullish breakout setup:
Buy near 3,302.88–3,317.09
Stop Loss near 3,260–3,299
Take Profit near 3,420
This setup favors buyers as long as the price remains above the stop-loss zone. If the market holds this structure, there's a good risk-reward ratio for a move to 3,420.41.

XAUUSD Bearish Setup with Key Entry, Stop Loss & Target LevelEntry Point: $3,235.94
Stop Loss: $3,235.94 (above current price, suggesting a SELL trade)
Target Points:
EA Target Point (Downside): $2,974.71 (Short target)
EA Target Point (Upside): $3,505.03 (Long target — likely alternate scenario)
Resistance Level: $3,121.49
Nearby Support Zone: Around $3,000–$2,975
📉 Trade Strategy Implied
This appears to be a short position setup:
Sell at: ~$3,220–$3,235
Stop Loss: $3,235.94
Take Profit: $2,974.71
Risk/Reward Ratio: ~1:3 (very favorable setup if thesis holds)
The upside target ($3,505.03) might be for a different scenario — if price reverses and breaks above resistance.
🧠 Market Structure Observations
Trend: A bearish break from a previous ascending channel.
Momentum: Price has bounced slightly after hitting support, but the moving averages suggest bearish momentum may persist.
Key Risk: If price breaks above $3,236 convincingly, it could invalidate the short setup and trigger a bullish run.
📌 Summary
Bias: Bearish (based on current setup)
Setup: Short with tight stop above resistance
Confirmation Needed: Watch for rejection at the $3,220–$3,236 zone and a breakdown below $3,200 for follow-through.
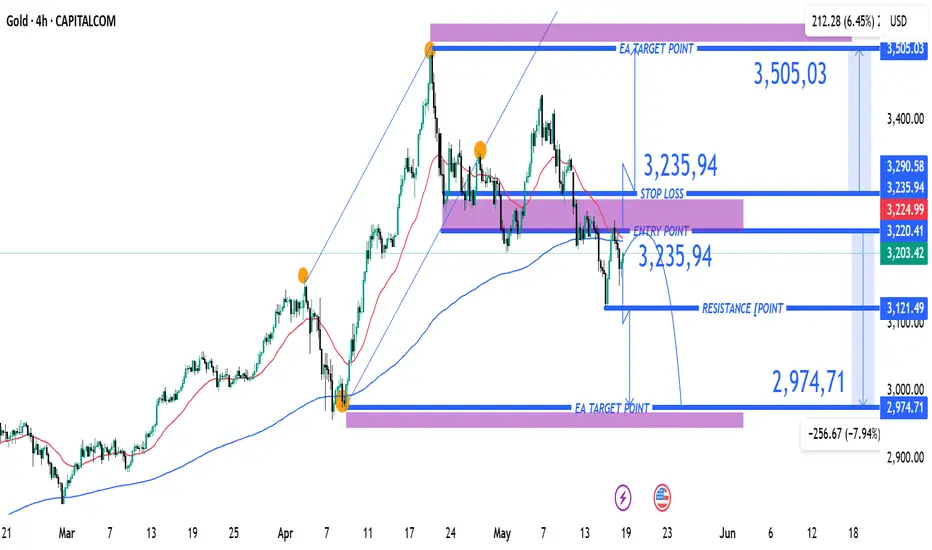
XAU/USD) Bullish Trade Setup – Targeting $3,506.52 with Entry atEntry Point: $3,221.19
Stop Loss: $3,169.80
Resistance Zone: Around $3,277.98 to $3,280.64
Target (TP) Point: $3,506.52 (Approx. 9.05% upside)
📊 Technical Indicators and Markings:
Moving Averages:
Likely a 50-period (blue) and 200-period (red) moving average.
Price is currently below both MAs, signaling a short-term downtrend.
Support & Resistance Zones:
Strong support around $3,207.67–$3,221.19 (entry area).
Resistance at $3,244.25–$3,280.64.
Stop-loss is strategically placed below support to limit downside risk.
Target Area:
Projected upside target is $3,506.52, with a potential 9.05% gain from the entry.
This is marked as the EA (Expert Advisor) Target Point, possibly suggesting this is a strategy from an automated trading system.
Orange Circles:
Likely indicate swing highs and lows, used to identify trend patterns and potential reversal points.
📈 Trading Idea Summary:
Bullish Setup: Buying at support, aiming for breakout above resistance to reach target.
Risk-Reward Ratio: Favorable, assuming price holds above $3,207.
Watch for Confirmation: Price needs to break above resistance around $3,280 for momentum continuation

EUR/JPY Long Setup – Bullish Reversal from Key Support ZoneEntry Point: 162.227
Stop Loss: 161.629
Take Profit (Target): 166.778
Current Price: ~162.798
Risk/Reward Ratio:
Risk: ~60 pips
Reward: ~455 pips
Risk/Reward ≈ 1:7.6 (strong setup)
🔍 Technical Insights
Support Zone:
The purple rectangle around 162.227 to 162.000 is identified as a key demand zone or support area.
Price has tested this zone previously and appears to be bouncing off it.
Price Structure:
The pattern suggests a potential double-bottom or reversal structure forming.
A rounded recovery projection is drawn, implying bullish momentum is expected.
Moving Averages:
A red (shorter period) moving average is crossing below the price.
A blue (longer period) moving average near the support zone could act as dynamic support.
Target Area:
166.778 marks a clear resistance or prior high and is labeled as the “EA Target Point”.
This is a logical profit-taking zone based on past price action.
✅ Bullish Trade Bias Justification
Strong support reaction near entry.
Favorable risk/reward ratio.
Reversal pattern potential.
Confluence with moving average support.
⚠️ Considerations
Ensure confirmation from a bullish candle or reversal signal before entry.
Be mindful of macroeconomic events or EUR/JPY fundamentals that might impact volatility.

WTI Crude Oil (USOIL) Bullish Pullback Setup – Targeting $66.70Entry Point: Around $62.30 - $62.26
Stop Loss: Set below the entry zone at $61.65, with a potential lower buffer at $60.90
Target Zone (EA TARGET POINT): Between $66.62 and $67.00
A projected gain of 4.22 points (~6.77%)
📈 Price Action & Indicators:
The price had a strong bullish run recently and is now consolidating or pulling back slightly.
The red and blue moving averages (likely short-term and medium-term MAs) show a bullish crossover and trend.
There's a potential bullish setup if the price pulls back to the entry zone and finds support.
The blue curved arrow indicates a projected bounce from the $62.30 support region back up toward the $66.70 target.
🛠️ Strategy Implied:
Wait for pullback to the entry zone (~$62.30).
Enter long at or around that level.
Set Stop Loss at $61.65 to limit downside risk.
Take Profit at $66.70 for a solid risk-reward ratio.
⚠️ Risks:
If support at $62.30 fails, price may head toward $61.65 or lower.
Market volatility (especially with crude oil) can invalidate setups quickly.
Economic events (e.g., U.S. inventory reports, OPEC news) can disrupt technical patterns.

"BTC/USD Short from 104,855 – Target 93,159. Entry Point
104,855 USD is marked as the entry point (likely for a short position).
The current price is around 103,775 USD, slightly below the entry level.
2. Resistance Zone
Highlighted just below the entry point (~103,000–104,855 USD).
Price is currently testing this zone, possibly indicating a failed breakout or pullback setup.
3. Stop Loss
Placed around 104,807 USD, just above the resistance area, in a shaded purple zone.
Suggests the trade strategy is based on shorting near resistance with a tight stop.
4. Target
EA Target Point is marked at 93,159 USD.
Implies a projected downward move of about −11,264 USD (−10.76%) from entry.
5. Indicators & Tools Used
Moving Averages: 200-period (blue) and a shorter MA (red), showing bullish momentum.
Support/Resistance Zones: Multiple purple rectangles denote demand/supply areas.
Trend Lines: Used to capture recent bullish momentum; a break of the lower line may confirm a trend reversal.
6. Pattern Recognition
Series of lower highs forming after a strong uptrend could suggest bearish divergence or distribution phase.
The price appears to be stalling at the resistance area, aligning with a potential short setup.
🧾 Trade Setup Analysis:
Bias: Bearish (short position).
Entry: 104,855
Stop Loss: 104,807 (tight SL above resistance zone)
Take Profit: 93,159
Risk-Reward Ratio (RRR): Roughly 1:10, which is aggressive and would require high conviction or confirmation

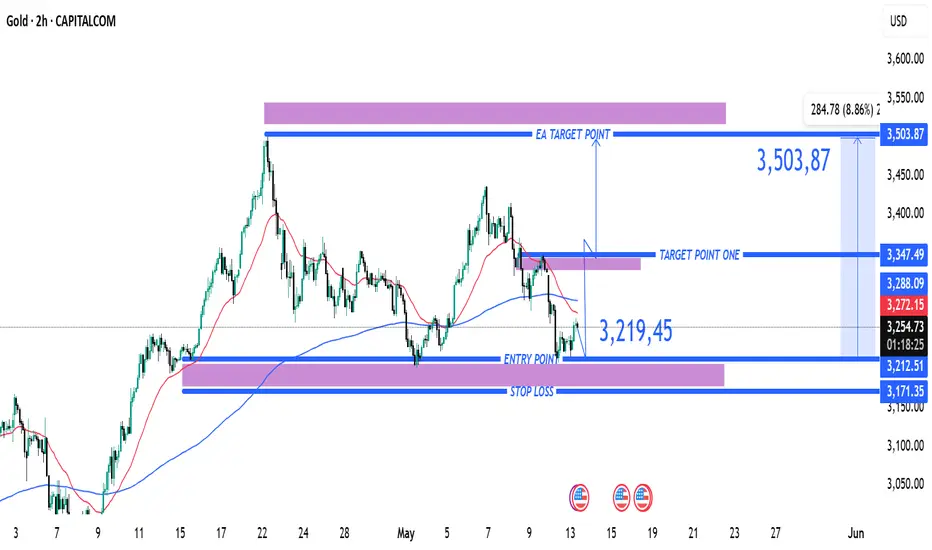
XAU/USD) 2H Trade Setup – Long Entry from Support with Targets aEntry Point: 3,219.45
Stop Loss: 3,171.35
Target Point One: 3,347.49
EA Target Point (Final Target): 3,503.87
Trade Plan:
Risk Zone: Between entry (3,219.45) and stop loss (3,171.35). The trader risks roughly 48.1 points.
Reward Zone: From entry to:
Target Point One: ~128 points.
Final Target (EA Target): ~284.4 points.
Risk-Reward Ratios:
To Target Point One: ~2.66:1
To EA Target Point: ~5.9:1
Indicators and Signals:
Price appears to be bouncing off a support zone near 3,212–3,219, indicating a potential reversal.
200 EMA (blue) and 50 EMA (red) are shown; price is slightly above the 200 EMA, suggesting long-term support.
There is a downtrend before the bounce, so this might be a counter-trend trade or the start of a new trend.
Summary:
This setup is a classic bounce from a demand/support zone with a clear upside potential. The risk is tightly managed, and the reward is significantly higher, aligning with favorable risk-reward principles. However, the position is speculative and relies on bullish follow-through from the support level. Watch price behavior near the 3,288 and 3,347 resistance zones to assess momentum.
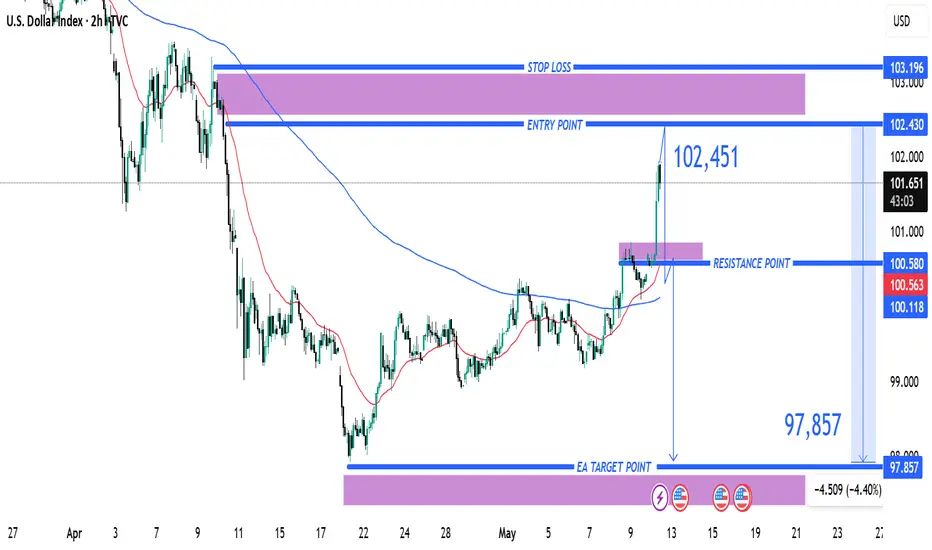
(DXY) Short Setup: Reversal Expected from Resistance Zone1. Entry Point: ~102.430
The price is currently below this level at 101.583, suggesting a potential short setup once the entry level is reached or confirmed.
2. Stop Loss: ~103.196
This is the price level where losses are limited if the trade moves against the intended direction. It's placed above a strong resistance zone.
3. Resistance Point: ~100.580
This was a previous resistance level which has now been broken, indicating a bullish push. The current price is above this, which may signal a breakout.
4. EA Target Point: ~97.857
The take-profit level, significantly lower, indicating a bearish target. This suggests a short position is intended from the entry point.
Indicators and Signals
The chart uses moving averages (likely 50 EMA and 200 EMA), and the price has surged above them, often a bullish signal.
However, the analysis seems to anticipate a reversal from the 102.430 level, expecting a drop back down toward 97.857.
The move from the current price to the target would be a 4.40% decline, a significant move for an index.
Trade Plan Summary
Trade Type: Likely a short/sell from the 102.430 level.
Risk: ~0.77 (103.196 - 102.430)
Reward: ~4.57 (102.430 - 97.857)
Risk-to-Reward Ratio: Approx. 1:6, which is favorable if the setup works out.
(XAU/USD) Bearish Trade Setup – Targeting $3,222 with 1:6 Risk/R(Sell) setup.
Entry Point: Around 3,409.33 - 3,408.41 USD.
Stop Loss: 3,437.87 USD.
Target (Take Profit): 3,222.53 USD.
Risk/Reward Ratio: Approximately 1:6, which is favorable.
📉 Price Action & Trend Analysis:
A rising wedge (or channel) appears to have formed and broken to the downside — a bearish signal.
The current price at 3,341.47 has broken below a minor support zone (highlighted in purple), indicating bearish momentum.
Price is now approaching the 200 EMA, which is acting as potential dynamic support.
📌 Key Levels Highlighted:
Support Zones: Near 3,347.47 (previous minor support) and 3,222.53 (main target zone).
Resistance Zones: At the entry level and above, near 3,437.87 (Stop Loss zone).
🔄 Indicators:
Moving Averages (Red and Blue Lines): Shorter-term moving average (red) is below the longer-term (blue), indicating downward pressure.
Momentum Shift: The sharp drop suggests a likely continuation of the bearish trend.
