UK100-Short Setup After Supply Zone RejectionPrice rallied sharply from the lows after a Buy signal, showing strong momentum into resistance.
After the rally, a Sell signal has emerged near local highs and beneath a defined structure zone.
Price has started to reject from the zone, with EMAs flattening out — hinting at short-term weakness.
🔍 Educational Setup (Short Bias):
Observed Entry Area: Near 9,146.80
Stop Reference: Above 9,155.96 (supply invalidation point)
Target Zone: 9,092.29 — aligned with previous demand base and structural retest
🧠 SignalPro Observations:
Earlier Buy sequence led to momentum burst — now fading as price meets resistance
EMA behavior suggests potential for mean reversion or short-term correction
Liquidity cluster below may act as a draw in the near term
⚠️ This chart and analysis are for educational purposes only. This is not financial advice. Please conduct your own analysis and manage risk before making any trading decisions.
Ftse100

UK100 (FTSE) - LIKELY TO DO A THIRD UPWARDS?UK100 has a clear 5 wave up from COVID-19 lows.
This is either an ABC pattern or a five-wave impulse. In either case, we should anticipate a significant move. Such big moves sometimes come after sentimental extremes or events - which is much awaited.
If this transpires, would be led by a commodity-led rally, which would in turn imply a weak dollar, loose liquidity, and high inflation. Let's keep a close watch on this.

FTSE100 indexIs the UK index or the FTSE100 index ready for a big rally in the coming days ??charts show a highly bullish breakout and also sustaining above the resistance of 7600 levels , index has almost 20% upside open before any major hurdles , 6 days to go for monthly candle closing and a closing above 7600 levels can give a confirmation of coming rally , view invalid if monthly candle closes below

Comparison of leading markets to anticipate the future movementAn attempt to anticipate the future movement of different markets over next 5 to 10 years. If we see the movement of 6 markets, we can have some insights.
Among the 6, Germany (DAX- purple) and India (NIFTY50 - red) look like being in the middle zone of the direction of movement since 1991.
Hong Kong (HSI - green ) came down gradually from around early 2018 to 2022, now looks at a fair level (may fall further to form a bottom).
USA(DJI - blue ) has recently started falling after forming a sharp peak, I am expecting a fall probably to 27500 levels or may go to 22000.
India (Nifty50 - red ) looks bullish for long term but may see a pullback to 15000 levels or even to 12000 levels in coming years.
UK (UKX - yellow) looks sideways and lacks long term strength as evident in the economy in recent times for United Kingdom.
France (CAC40-brown) looks sideways from a long term perspective.
Germany(Dax-purple) looks the most balanced in terms of bear and bull phases.
Overall it looks like the bear phase has started for most markets and it may take several years for healthy bull phase to be back.

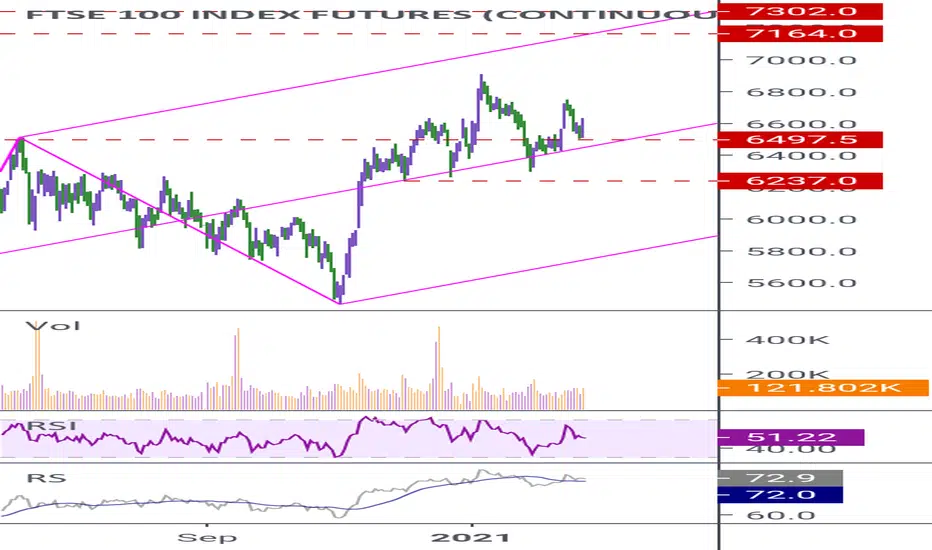
BuyFTSe 100 is looking good for 7300. It has reversed from mid line of trend channel. 6200 is the SL on daily closing basis.
BKG (BERKELEY GROUP HOLDINGS) go long for target 3955BKG (BERKELEY GROUP HOLDINGS) has recently bounced from 50 EMA twice and is now looking set to reach a target 1 of 3955. Target 2 is 4240. Stoploss levels are 3750 and 3670. Exit the half the stock if it falls below 3750. Exit full if it falls below 3670.
