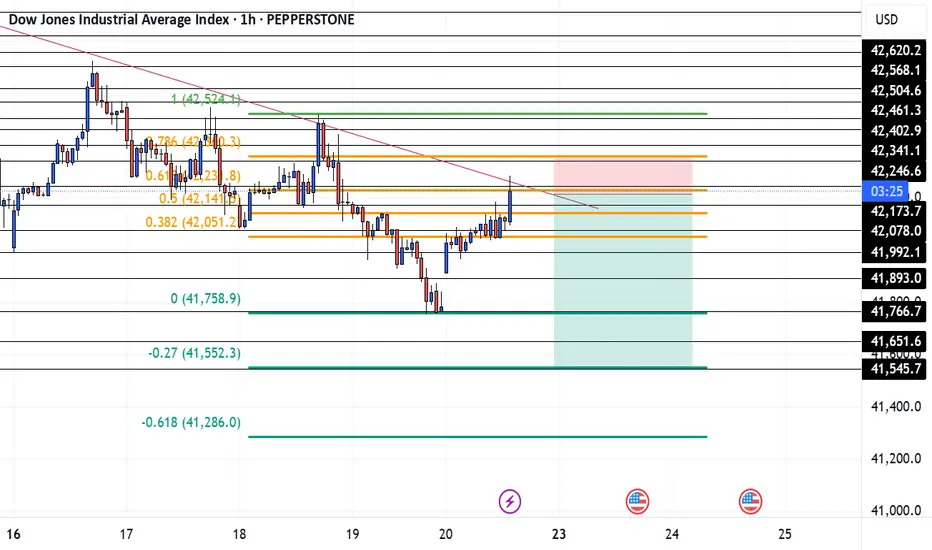
US30 JUNE 20Happy Friday, I see that price is around my key area, the top of the trendline and on my Fib extension. Everything about this trade is telling me to sell. But at the end of the day price does what she wants. So be careful and wait for a break and retest of the key level or trendline before you get in. If you have any questions don't be afraid to ask. Have fun and trust yourself
FUN
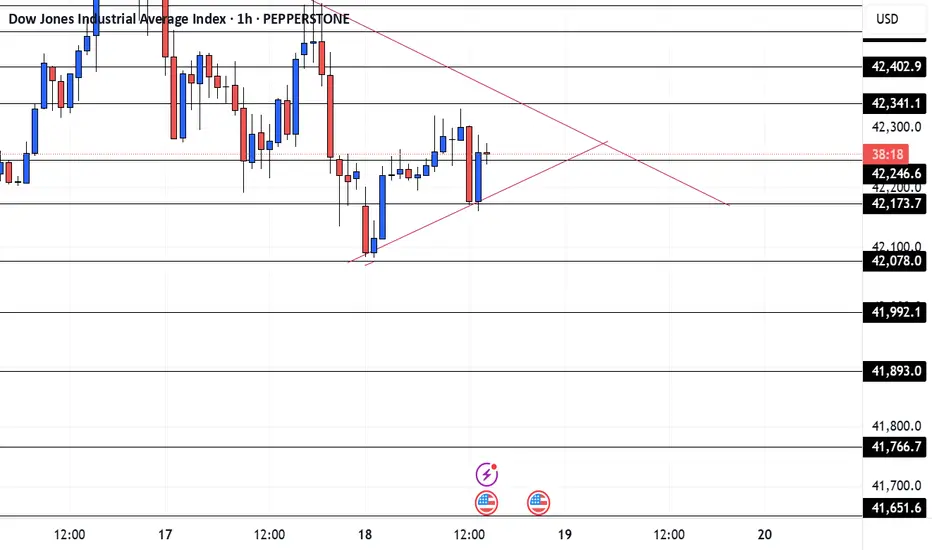
US30 JUNE 18Price looking fine like lemon lime in the summertime. I am just going to follow the trendlines today. I'm either going to wait for a bounce to sell or buy or a break and retest through the trendline. And my take profit will just be the next key area.
I hope this helps. LMK is you don't understand.
Stay safe and have fun
BANK NIFTY 2019 ELECTION RESULT WEEK VOLATILITYThis chart shows the volatility in BANK NIFTY during the Election Results week in the last General Elections 2019

Banknifty for 11th nov 2022👉 Banknifty took support at last swing low 41333
and brack huge resistance level 41500
👉 Market may open huge gapup above to all time
High and may it came down to take support at
previous all time highlevels 41200
👉 little bit bearish due to. Huge gapup
At all time high
Next 2 days holidays
👉Squreing off and build new position in last market
hours
All the best have a great day 😊

Banknifty levels for 4th nov 2022👉Banknifty face resistance at 41500 multiple time (it becomes week)
👉 Look like ovrall market bullish
👉 Banknifty form trendline
👉 Enter with half quantity ofter brack trend line
Add another half quantity ofter brack 41500
👉 Target near 41650
Have a happy trading day 🥰

Banknifty selling Flag for 3rd nov 2022 expired day👉Banknifty support and resistance levels mentioned
👉May be tomorrow little volatile with sideways
(Weekly expiry day)
👉Have a great trading day

Banknifty head and shoulder pattern 👉Banknifty head and shoulder pattern
👉Base of the shoulder also form at support levels 41200
41200 brack down took half quantity
👉Another support at 41120 if it Brock down build another half quantity
👉Target near 40800
Have a happy trading day 🥰

Banknifty 20 octNutral point 38442-38785
R1- 39061
R2- 39166
R3-39605
S1- 37966
S2-37370
37000 & 38000 physclogical levels

Postmortem on #BankNifty - 06 OCT 2022 - Weekly Expiry Bank nifty opened 39343 right at the resistance line made a long wick 5mts 1st candle. The 2nd candle broke the SR line. At 09.40 after seeing the red candle i assumed BN will trade lower and exited the 39500 iron fly at the cost price.
I was not expecting BN to go up and the 4 candles from 09.45 to 10.00 really surprised me. And all the trade that happened till 12.55 was against the trades i had in my mind. The reason i thought BN would not go up was because of the long wick and the immediate break in SR during the first 15 to 20mts.
The trades from 13.00 to close was something that really comforted me. Eventhough i did not make big money trading today’s expiry - the closing price action was inline with the opening pattern.
Again all these trades would be positional as it was the weekly expiry, to know if the trend is continuing or not we need to watch the trades of tomorrow & monday.
For traders who would have taken an intraday straddle or strangle - there is a high possibility that their stop loss would have been hit. If for some reason they forgot to put the SL or simply didnt have one - they would have made money as the opening & close was almost the same.
5mts TF shows no specific direction. If tomorrow also BN stays in this range - then i would prefer to plan for a range bound expiry for 13th.
15mts TF shows a W bottom pattern
1hr TF shows the W pattern with much more clarity.
This need not be taken so seriously as BN just came out from a double top M pattern last week. So we would need to wait for further sessions to confirm if its trend continuation or reversal.
Bank nifty important support and resistance lines
s1:38698, s2: 37946
r1: 39326, r2: 39739
Thanks for reading Viswaram Finance! No recommendations, No predictions !

BANKNIFTY INTRADAY TRADE SETUPExpectations for Today: Volatile Day.
Intraday Levels are in chart.
We will update time to time.
To motivate us, Please like the idea If you agree with the analysis.
Happy Trading!
Call Of Trader!!

Niftybank 22 September closing Banknifty nutral points 40888to 41067
R1 41248
R2 41478
R3 41837
S1 40626
S2 40289
S3 40000
Important point
1.We are not SEBI registered advisor.
2. Theses support and resistance is for education purpose only.
3. We are not responsible for any profit and losses.
4. Kindly take trade according to your risk appetite.


Bank-nifty is Xerox-Machine of pattern?This post is for fun only!
We can prove from this repeating : " The history repeat itself in price. "

There is a possibility for the beginning of an uptrend in FUNETHTechnical analysis:
. FUNFAIR/ethereum is in a range bound and the beginning of uptrend is expected.
. The price is above the 21-Day WEMA which acts as a dynamic support.
. The RSI is at 53.
Trading suggestion:
. There is a possibility of temporary retracement to suggested support zone (0.00003140 to 0.00002810). if so, traders can set orders based on Price Action and expect to reach short-term targets.
Beginning of entry zone (0.00003140)
Ending of entry zone (0.00002810)
Entry signal:
Signal to enter the market occurs when the price comes to " Buy zone " then forms one of the reversal patterns, whether " Bullish Engulfing ", " Hammer " or " Valley " in other words, NO entry signal when the price comes to the zone BUT after any of reversal patterns is formed in the zone. To learn more about " Entry signal " and the special version of our " Price Action " strategy FOLLOW our lessons :
Take Profits:
TP1= @ 0.00003770
TP2= @ 0.00004260
TP3= @ 0.00004740
TP4= @ 0.00005130
TP5= @ 0.00005740
TP6= @ 0.00006150
TP7= @ 0.00007300
TP8= @ 0.00008430
TP9= Free

There is a possibility for the beginning of an uptrend in FUNETHTechnical analysis:
. FUNFAIR/ETHEREUM is in a range bound and the beginning of uptrend is expected.
. The price is above the 21-Day WEMA which acts as a dynamic support.
. The RSI is at 54.
. While the RSI and the price downtrend in the Daily chart are not broken, bearish wave in price would continue .
Trading suggestion:
. There is a possibility of temporary retracement to suggested support zone (0.00005860 to 0.00005040). if so, traders can set orders based on Price Action and expect to reach short-term targets.
Beginning of entry zone (0.00005860)
Ending of entry zone (0.00005040)
Entry signal:
Signal to enter the market occurs when the price comes to "Buy zone" then forms one of the reversal patterns, whether "Bullish Engulfing" , "Hammer" or "Valley" in other words,
NO entry signal when the price comes to the zone BUT after any of the reversal patterns is formed in the zone.
To learn more about "Entry signal" and the special version of our "Price Action" strategy FOLLOW our lessons:
Take Profits:
TP1= @ 0.0000664
TP2= @ 0.0000711
TP3= @ 0.0000792
TP4= @ 0.0000845
TP5= @ 0.0000897
TP6= @ 0.0001340
TP7= Free
