Intraday Institution Trading in Nifty and Banknifty BANKNIFTY Institutional Behavior
BANKNIFTY moves faster due to lower liquidity + banking stock hedging.
Institutions:
Accumulate ATM options early
Trigger stop hunts near high OI strikes
Expand range post 11:30 AM when gamma pressure builds
High-Probability Institutional Intraday Trades
VWAP Reclaim + OI Unwinding → Trend day setup
High OI Rejection + IV Drop → Mean reversion
Break of Call-Writer Zone with Volume → Momentum expansion
Institutional Rulebook
Trade levels, not emotions
Follow option writers, not candles
Price moves to hurt the maximum number of option holders
Fundamental-analysis

Advanced Intraday Institution Option TradingAdvanced Intraday Institutional Option Trading
Institutional intraday option trading focuses on order flow, volatility expansion, and hedging behavior, not prediction. Institutions deploy capital where liquidity, gamma, and vega sensitivity allow fast risk adjustment—usually in near-expiry (0DTE–3DTE) index options.
Institutional Interpretation
Max Call OI at 21,500 → Heavy call writing → Resistance
Rising Put OI at 21,400 → Strong downside hedge → Support
IV spike on Calls above 21,500 → Short covering risk → Breakout fuel
Balanced IV at ATM → Volatility expansion likely
High-Probability Intraday Trades
Gamma Scalping: Buy ATM options when IV expands + price holds VWAP
Directional Break: Long calls above call-writer resistance with OI unwinding
Volatility Fade: Sell options after IV spikes near key levels
Key Rule
Institutions trade structure, not direction.
Retail trades candles. Smart money trades the option chain.

Long Term Investment What is Bank Nifty (for long-term view)
Nifty Bank tracks India’s top banking stocks (HDFC Bank, ICICI Bank, SBI, Axis, etc.).
It’s:
🚀 High growth–oriented
📉 More volatile than Nifty 50
💰 Strongly linked to credit growth, interest rates, and the economy
Long-term verdict:
Great for growth if you can tolerate volatility.
Best ways to invest in Bank Nifty for the long term
1️⃣ Bank Nifty Index Mutual Funds (BEST for most people)
Passive funds that track Bank Nifty
Ideal for SIP + long horizon (7–10+ years)
Why this works
No stock picking risk
Lower expense ratio
Automatic rebalancing
👉 Suitable if you want set it and forget it

Option TradingRetail and Institutional Option Trading
Retail traders usually focus on buying options, hoping for fast price movement. Institutions, on the other hand, mostly sell options because time decay (Theta) works in their favor.
Key differences:
Retail traders chase momentum and news
Institutions focus on probability, statistics, and data
Retail uses indicators
Institutions use Option Chain, OI, volume, and volatility
Retail looks for big wins
Institutions look for consistent returns
Institutions understand that 90% of options expire worthless, which is why option writing dominates institutional strategies.

Technical Analysis Vs Institutional Trading Option Trading Part1Technical Analysis (TA):
Uses charts & indicators to time entries/exits.
Best for directional option trades (calls/puts), short-term moves.
Institutional Trading:
Focuses on liquidity, options flow, open interest, gamma.
Best for selling premium and trading ranges with lower risk.
Bottom line:
👉 TA = when to trade
👉 Institutional = where & why price moves
👉 Best edge = use both together
Professional Reality (Important)
📌 Institutions don’t predict direction — they manage risk
📌 Retail traders try to be right — institutions try to get paid
📌 Options are a probability business, not a prediction game

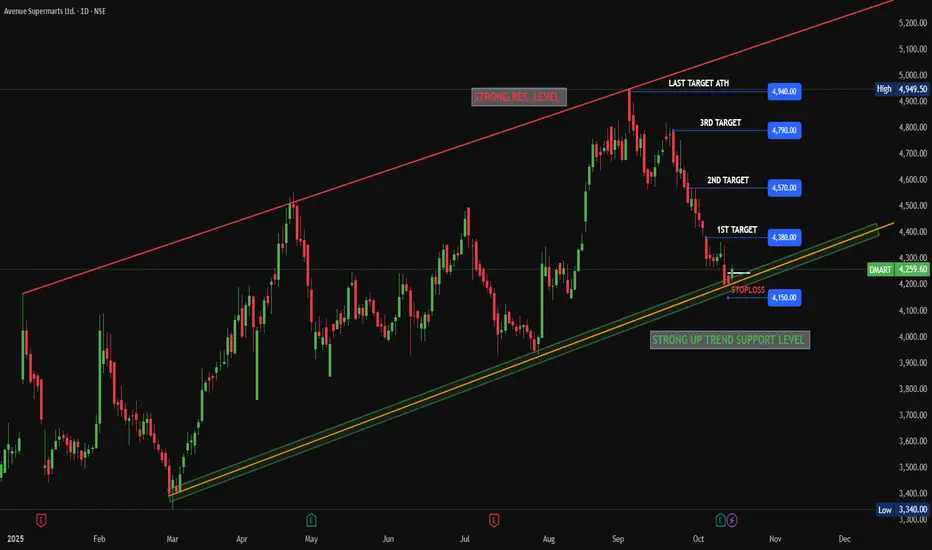
DMART - What can you possibly expect next......💹 Avenue Supermarts Ltd (DMart)
Context: Q3 FY26 Results vs Market Expectations
Chart View: Daily
Market Context: When Good Results Are Not Enough
DMart reported growth in both revenue and profit in its latest quarterly results. The company continues to add stores, customer demand remains steady, and the business model is stable. There was no major negative surprise in the results, and the long-term business story remains intact.
However, the stock market does not react only to whether results are good or bad. It reacts to whether results are better or worse than what the market was expecting. Before the results, many participants were expecting faster sales growth, better margin improvement, and clearer signs of stronger earnings momentum.
The reported numbers, although positive, did not go much beyond these expectations. Because of this, the stock price did not show a strong positive reaction. When a stock is already trading at higher valuations, the market looks for improvement, not just stability.
This difference between expectations and actual results explains the price behaviour. When expectations are high and results only meet them, prices often move sideways or see short-term selling. This does not mean the business is weak — it simply means the market is adjusting its expectations.
From a chart point of view, the stock is facing selling pressure near earlier price levels. Buying interest is limited for now, and price action suggests the stock is taking time to absorb the results rather than moving in a clear direction.
While DMart continues to report double-digit growth, the market is becoming cautious about the pace of that growth. Revenue growth in the latest quarter was lower than the company’s longer-term average and also slower than the rate at which new stores are being added. This suggests pressure on same-store sales. In addition, margins are facing challenges due to intense competition, price cuts in daily-use products, and changes in GST rates. These factors explain why the stock price has remained under pressure despite healthy headline numbers.
The key learning for beginners is simple: stocks do not always go up after good results. Sometimes prices move sideways to allow expectations to cool down. Patience and understanding the bigger picture are more important than reacting emotionally to quarterly numbers.
⚠️ Disclosure & Disclaimer
This post is shared only for educational and informational purposes. It is not investment advice or a recommendation. Stock market investments involve risk. Please consult a SEBI-registered financial advisor before making any investment or trading decisions.
🚀 Stay Calm. Stay Clean. Trade With Patience. Trade Smart | Learn Zones | Be Self-Reliant

IndusInd Bank Ltd || 1 Day || Cup and handle IndusInd Bank Ltd — Detailed Analysis
Company Intro:
IndusInd Bank Ltd is one of India’s leading private sector banks offering retail, corporate, and digital banking services across the country. The bank has a strong footprint in consumer credit, deposits, and transaction banking, catering to millions of customers across urban and semi-urban regions.
Technical Perspective — Cup & Handle Breakout
The daily chart shows a classic Cup & Handle pattern, a bullish continuation setup formed over several months.Price has decisively broken above the key breakout level ~₹890, validating the pattern’s breakout.This breakout suggests a shift from consolidation to an upward trend re-acceleration.
Sustained trading above ₹890 keeps the structure bullish in the short to medium term.
📍 Resistance Levels (Upside):
• ₹930 — immediate minor resistance
• ₹1,030 — major resistance zone above
📍 Support Levels (Downside):
• ₹830 — key support if price retraces below ( Bearish)
• ₹710 — structural support
Trend Bias:
• Bullish above ₹890
• Neutral to Bearish below ₹830 / ₹710
Latest Update
Some macro/sector views indicate a softer Q3 earnings outlook relative to peers.
Source _Business Today
Broader corporate news includes regulatory probes related to past accounting discrepancies which the company is cooperating with.
Source _The Economic Times
👉 If you need analysis on any company or stock, comment below.
This analysis is for educational purposes only and should not be considered as investment advice. The author is not responsible for any losses arising from the use of this information. Investors are advised to consult a SEBI-registered investment advisor before taking any trading or investment decisions.

CONCOR – 1D | 10-Year Support & Trendline BreakoutCompany Intro:
Container Corporation of India Ltd (CONCOR) is a Navratna PSU and India’s largest integrated logistics company, operating inland container depots (ICDs), container freight stations (CFS), and rail-based logistics services. It plays a key role in India’s EXIM trade and domestic freight movement.
Technical View (Daily Chart):
CONCOR has broken out above a 10-year long-term support trendline, indicating a structural trend reversal, The stock has given a strong close near ₹525, confirming bullish intent and acceptance above the breakout zone.
Levels to Watch:
CMP: ₹523
Immediate Resistance / Target: ₹600
Breakout Confirmation Level: ₹525 (strong close above this keeps momentum positive)
Immediate Support: ₹480
Major Support: ₹446
As long as the stock holds above ₹480, the trend remains positive with a higher probability of moving towards ₹600 in the near term.
Positive Triggers
Government’s continued push for rail-led logistics, DFC (Dedicated Freight Corridor) and multimodal transport benefits CONCOR directly.
Volume recovery in EXIM and domestic logistics improves revenue visibility.
PSU logistics stocks are seeing renewed investor interest due to valuation comfort and long-term infrastructure growth.
For analysis of any stock, feel free to comment the stock name below.
This analysis is for educational and informational purposes only. It does not constitute investment advice or a recommendation to buy or sell any security. Market investments are subject to risk, and past performance does not guarantee future results. Please consult a SEBI-registered financial advisor before making any investment decisions. The author is not responsible for any losses arising from the use of this information.

Fundamental Analysis Basics (P/E, P/B, ROE, ROCE)1. Price-to-Earnings Ratio (P/E Ratio)
What it Means
The P/E ratio tells you how much investors are willing to pay today for ₹1 of a company’s earnings. It connects a company’s market price with its profit generation ability.
Formula:
P/E = Current Market Price ÷ Earnings Per Share (EPS)
Why P/E Matters
A high P/E suggests that investors expect strong future growth.
A low P/E may indicate undervaluation, or that the company is facing growth challenges.
How to Interpret P/E
High P/E (>30): Market is optimistic, often seen in growth sectors like technology or consumer internet companies.
Moderate P/E (15–30): Indicates stable performance, common in quality midcaps and blue-chip stocks.
Low P/E (<15): Might indicate a value pick or a fundamentally weak company.
Limitations
P/E does not work well if profits are volatile or negative.
P/E differs widely across sectors—comparing a bank with a tech company is misleading.
Best Use Cases
Compare P/E with the stock’s historical average.
Compare P/E with the industry average.
Use Forward P/E (P/E using estimated future earnings) to understand growth visibility.
2. Price-to-Book Ratio (P/B Ratio)
What it Means
The P/B ratio compares the company’s market value with its book value (net assets). It tells how many times investors are paying relative to assets.
Formula:
P/B = Market Price per Share ÷ Book Value per Share
Book Value per Share = (Total Assets – Total Liabilities) ÷ Number of Shares
Why P/B Matters
Useful for asset-heavy sectors such as banks, NBFCs, manufacturing, and PSU companies.
Helps understand whether the stock trades above or below its actual net worth.
How to Interpret P/B
P/B < 1: Stock may be undervalued; the company trades below its net worth.
P/B between 1–3: Normal valuation for most companies.
P/B > 3: Indicates premium valuation; market expects strong future returns.
Limitations
Not useful for asset-light businesses like IT, FMCG, or digital companies where the real value lies in brand and intellectual property.
P/B alone does not measure profitability or efficiency.
Best Use Cases
Combine P/B with ROE to judge whether a company is generating strong returns on its net assets.
Valuable for evaluating banks and financial institutions.
3. Return on Equity (ROE)
What it Means
ROE shows how efficiently a company generates profits using shareholder equity. It reflects management’s ability to create value.
Formula:
ROE = Net Profit ÷ Shareholder’s Equity × 100
Why ROE Matters
High ROE indicates that the company uses shareholder money efficiently.
It reflects competitive advantage, pricing power, and strong demand.
How to Interpret ROE
ROE > 20%: Excellent – shows strong efficiency and high margins.
ROE 15–20%: Good – typical for stable companies.
ROE < 10%: Weak – indicates poor profitability or inefficient use of equity.
Limitations
ROE can be misleading if the company has very high debt; equity becomes smaller because debt funds the assets.
A temporary profit spike can artificially inflate ROE.
Best Use Cases
Compare ROE with the industry average.
Use ROE along with P/B to identify high-quality compounders.
Check 5–10 year ROE trends for consistency.
4. Return on Capital Employed (ROCE)
What it Means
ROCE measures profitability based on all capital employed, including equity and debt. It gives a more holistic view than ROE.
Formula:
ROCE = EBIT ÷ (Equity + Debt) × 100
Here, EBIT (Earnings Before Interest and Taxes) measures operating profit.
Why ROCE Matters
Shows how efficiently the company generates profits using both debt and equity.
Crucial for capital-heavy industries like manufacturing, steel, energy, or infrastructure.
How to Interpret ROCE
ROCE > 20%: Excellent capital allocation, highly efficient.
ROCE 15–20%: Good and sustainable.
ROCE < 12%: Weak returns relative to capital employed.
Limitations
ROCE may fluctuate due to capital expansion cycles.
Not very useful for debt-free companies where ROE already gives similar insight.
Best Use Cases
Compare ROCE with the company’s cost of capital (WACC).
High ROCE indicates strong pricing power and effective management.
How These Ratios Work Together
Using P/E, P/B, ROE, and ROCE in isolation is incomplete. Successful investors combine them for a full picture of valuation and performance.
1. P/E + ROE → Identifying Growth at Reasonable Price (GARP)
High ROE + reasonable P/E = High-quality stock at fair valuation.
Example: A company with ROE 20% and P/E 18 is usually attractive.
2. P/B + ROE → Banking and Financial Analysis
High ROE + moderate P/B = efficient bank with good asset quality.
A bank with ROE 17% and P/B 1.5 is stronger than a bank with ROE 10% and P/B 1.
3. ROCE + P/E → Capital-Intensive Business Screening
High ROCE suggests strong return on capital.
If P/E is low while ROCE is high, the stock may be undervalued.
4. ROE vs ROCE → Debt Analysis
ROE > ROCE: Company uses leverage (debt) to boost shareholder returns.
ROCE > ROE: Limited debt; equity is used more efficiently.
Practical Example (Simplified)
Suppose a company has the following metrics:
P/E = 20
P/B = 3
ROE = 22%
ROCE = 18%
Interpretation:
P/E 20 → Fair valuation.
P/B 3 → Market expects strong future performance.
ROE 22% → Very efficient with shareholder capital.
ROCE 18% → Strong use of total capital.
Conclusion:
This is a high-quality growth company trading at a fair-to-premium valuation.
How Investors Use These Ratios in Real World
1. For Long-Term Investors
Focus on businesses with consistently high ROE and ROCE.
Avoid companies with declining profitability, even if valuation looks low.
2. For Value Investors
Look for low P/E and low P/B stocks with improving ROE/ROCE.
These indicate potential turnarounds.
3. For Growth Investors
Accept high P/E if ROE and ROCE remain elevated for multiple years.
Growth sustainability is more important than cheap valuation.
4. For Traders
Use ratios to identify strong fundamentally-backed stocks for swing or positional trades.
Conclusion
P/E, P/B, ROE, and ROCE are essential tools of fundamental analysis. P/E and P/B help measure valuation, while ROE and ROCE measure profitability and efficiency. Together, they determine whether a stock is fundamentally sound, fairly priced, and capable of delivering long-term returns. When used consistently and compared with historical data, sector averages, and market conditions, these ratios give investors a powerful framework for making informed decisions.

Understanding the Fundamental MarketCore Principles of the Fundamental Market
Intrinsic Value Assessment:
The central idea in the fundamental market is that every asset has an intrinsic or “true” value. Investors compare this intrinsic value with the current market price to determine whether the asset is undervalued, fairly valued, or overvalued. Buying undervalued assets or selling overvalued ones forms the basis of long-term profit strategies.
Focus on Economic Fundamentals:
Fundamental markets heavily rely on macroeconomic and microeconomic indicators. For example, GDP growth, inflation rates, employment statistics, interest rates, and government fiscal policies are crucial in assessing the overall economic environment. At the micro level, company-specific data such as revenue, earnings, debt levels, cash flow, and competitive positioning are analyzed to determine the financial health and growth potential of individual firms.
Long-term Investment Horizon:
Unlike traders who operate in the short-term, the fundamental market favors long-term investments. Investors anticipate that while short-term price fluctuations may occur due to market sentiment or technical factors, in the long run, the market price of an asset will converge with its intrinsic value.
Key Components of Fundamental Market Analysis
Company Analysis (Equity Market):
In the stock market, fundamental analysis involves examining a company’s financial statements—balance sheet, income statement, and cash flow statement. Key metrics include:
Earnings per Share (EPS): Indicates profitability on a per-share basis.
Price-to-Earnings Ratio (P/E): Measures whether a stock is overvalued or undervalued relative to its earnings.
Debt-to-Equity Ratio: Assesses financial leverage and risk.
Return on Equity (ROE) and Return on Assets (ROA): Evaluate efficiency in using shareholders’ capital or assets to generate profits.
Beyond numbers, qualitative factors such as management quality, brand strength, market share, regulatory environment, and competitive advantages are also critical in assessing long-term growth potential.
Macroeconomic Analysis:
The broader economy directly influences asset prices. Factors such as:
Interest rates: Higher rates may reduce borrowing and consumer spending, negatively affecting company profits.
Inflation: Rising inflation can erode the real value of returns and affect purchasing power.
Fiscal and Monetary Policies: Government spending, tax policies, and central bank interventions can stimulate or constrain market growth.
Global Events: Geopolitical events, pandemics, and trade policies also play a significant role in determining market trends.
Industry Analysis:
Understanding the industry in which a company operates helps investors identify growth opportunities or potential risks. Factors to consider include:
Market size and growth potential
Competitive dynamics
Technological innovations
Regulatory constraints
Cyclical vs. non-cyclical industry characteristics
Valuation Models:
Investors use various models to estimate intrinsic value, including:
Discounted Cash Flow (DCF) Analysis: Projects future cash flows and discounts them to present value.
Dividend Discount Model (DDM): Focuses on the present value of expected dividends.
Comparable Company Analysis: Compares valuation multiples (like P/E, EV/EBITDA) with peers.
Asset-Based Valuation: Evaluates the net asset value of a company by subtracting liabilities from total assets.
Participants in the Fundamental Market
The fundamental market attracts a wide array of participants, including:
Long-term investors: Individual and institutional investors who seek wealth accumulation over years or decades.
Mutual funds and pension funds: These funds invest in fundamentally strong companies with sustainable growth.
Value investors: Investors who follow the philosophy of buying undervalued stocks with a margin of safety, popularized by Benjamin Graham and Warren Buffett.
Corporate analysts and research houses: Professionals who provide insights into company performance and macroeconomic trends.
Advantages of Operating in the Fundamental Market
Reduced Speculative Risk: By focusing on intrinsic value, investors can avoid the herd mentality and irrational exuberance often seen in speculative trading.
Long-Term Wealth Creation: Fundamental market investments are typically more stable and generate wealth over extended periods through price appreciation and dividends.
Informed Decision-Making: Thorough research and analysis ensure that investment decisions are grounded in reality rather than market sentiment.
Alignment with Economic Growth: Investments in fundamentally strong companies often mirror real economic growth, providing consistent returns.
Challenges of the Fundamental Market
Time-Consuming Analysis: Evaluating financial statements, industry dynamics, and macroeconomic trends requires significant effort and expertise.
Market Inefficiency: In the short term, market prices may deviate from intrinsic value due to speculation, news events, or investor sentiment.
Information Overload: Investors must filter vast amounts of data to focus on meaningful indicators.
Globalization and Complexity: International exposure introduces currency risks, geopolitical factors, and cross-border regulatory challenges.
Examples of Fundamental Market Strategies
Value Investing: Buying stocks that trade below their intrinsic value and holding until the market recognizes their true worth.
Growth Investing: Identifying companies with strong revenue and earnings growth potential even if current valuations are high.
Income Investing: Focusing on companies that provide regular dividend income alongside steady capital appreciation.
Sector Rotation: Moving investments across sectors based on macroeconomic cycles and industry trends.
Conclusion
The fundamental market is the backbone of rational, long-term investing. It emphasizes in-depth research, economic understanding, and valuation analysis to identify assets with sustainable growth potential. By concentrating on intrinsic value, participants in the fundamental market can mitigate short-term volatility and speculation, building wealth steadily over time. While it requires patience, diligence, and expertise, the fundamental market offers one of the most robust approaches to navigating the complexities of modern financial markets.
Ultimately, the fundamental market is not just about buying and selling assets—it’s about understanding the economy, businesses, and human behavior to make informed decisions that align with long-term financial goals.

Consolidation happening in BBTC (Bombay burmah trading)1. is having consolidation pattern between 1750 - 2100 levels
2. One can watch for breakout above 2100 with good Risk : Reward
3. stock has give strong results attracting buyers and accumulation seen at 1850 levels
with strong buyer coming taking stock to 2050 levels in single day
4. stock may test its all time high if breaches 2400 levels

Pressured Below 4050$ as Bears Target the 4,000$ Liquidity BreakGold continues to trade under heavy selling pressure, staying capped beneath 4,050$ and hovering just above the major liquidity floor at 4,000$.
With fading expectations for a December Fed cut and cautious global sentiment, buyers remain defensive while sellers maintain structural control.
📊 Technical Outlook (H1)
Price remains inside a tight 4,053$ → 4,000$ distribution zone, with the descending trendline keeping gold suppressed.
The POC around 4,053$ is acting as a firm ceiling; every retest so far has been rejected.
Fibonacci projections from the last drop highlight two major downside liquidity zones:
3,945$ → first liquidity cluster
3,876$ → deeper extension and key demand
Current structure resembles a bear flag, hinting that the market may be preparing for another downside expansion.
🎯 Key Scenarios
1️⃣ Bearish Breakdown (Primary Scenario)
If gold loses 4,000$, expect momentum to accelerate into:
3,945$
3,876$
This remains the most probable path while price holds below 4,053$.
2️⃣ Liquidity Sweep → Short-Covering Bounce
If price sweeps 3,945$ and forms bullish rejection wicks:
A relief bounce could develop back toward 4,000$,
Then 4,053$ (POC)
And possibly 4,098$ if buyers gain traction.
Still a corrective move unless bulls reclaim the upper structure.
❌ Invalidation (Bearish Bias Weakens)
H4 acceptance above 4,098$
→ would shift the narrative and force a reassessment of trend direction.
⚜️ MMFLOW TRADING Insight
Gold is still trading below value and below the trendline — this is not a bullish environment yet.
The market must either break 4,000$ or reclaim 4,053$–4,098$ before any stronger directional conviction returns.
“Let the market show its hand. In a downtrend, weak rallies are opportunities — not reversals.”

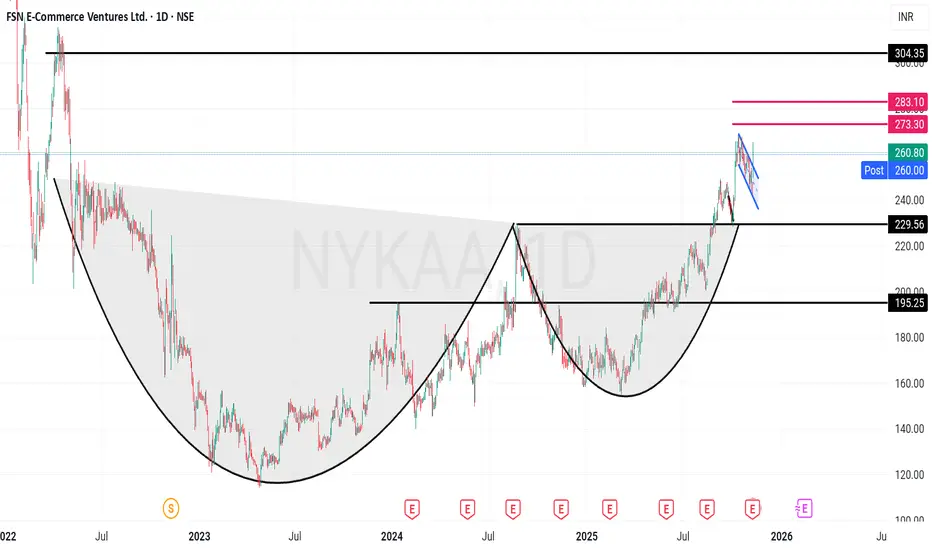
Nykaa - Strong Growth Cup & Handle with Detailed fundamentalsFSN E-Commerce Ventures Limited (Nykaa) – Technical & Fundamental Analysis
Company Overview:
FSN E-Commerce Ventures Limited (Nykaa) is a digitally native consumer technology platform, delivering a content-led, lifestyle retail experience. Since its incorporation in 2012, the company has focused on designing a differentiated brand discovery journey for its consumers. It offers a diverse portfolio of beauty, personal care, and fashion products, including owned-brand products manufactured in-house. Nykaa provides an omnichannel experience to cater to consumer preferences and convenience.
Technical Analysis
Chart Patterns: Cup and handle breakout; Today 1-hour parallel channel breakout
Current Market Price (CMP): ₹260
Targets: ₹301, ₹350
Support Levels: ₹230, ₹195
Recent News & Highlights
✅Q1 FY26 Results: Consolidated net profit surged 142% YoY to ₹23.30 Cr; revenue up 23.4% to ₹2,155 Cr
✅Arbitration Win: Nykaa Fashion received ₹10 Cr compensation from arbitration award
Q1 FY26 Guidance: Management anticipates consolidated net revenue growth at lower end of mid-twenties range YoY
✅Fashion Segment Target: Company expects EBITDA breakeven in fashion by FY26
✅Organic Portfolio Expansion: Aims to increase organic portfolio by 30% annually to reach ₹6,000 Cr GMV
✅Q4 FY25 Performance: EBITDA ₹133 Cr vs ₹93.28 Cr YoY; EBITDA margin improved to 6.47% from 5.59%
✅Corporate Action: NCLT approved merger of Iluminar Media (LBB) into Nykaa Fashion
Analytical Summary
Operational Excellence: Revenue growth of 24.5% YoY with net profit doubling to ₹66.08 Cr demonstrates strong execution and operating leverage. The company is scaling both beauty and fashion verticals while expanding margins.
Capital Structure: Debt increased 41% to ₹961 Cr, but debt-to-equity remains negligible at 0.04, showing conservative leverage. ROE at 5.9% suggests room for improvement in capital efficiency.
Valuation Risk: PE of 675.77 and PB of 40.5 reflect aggressive growth expectations. EV/EBITDA of 117.5 leaves minimal margin of safety, requiring caution for long-term investors.
SWOT Analysis
Strengths (16 Factors):
Rising net and operating cash flows for 2 consecutive years
Strong EPS growth; quarterly profit margins expanding
Improving RoCE, ROE, and ROA
Consistent revenue growth for past 2 quarters
Clean governance; zero promoter pledge
Weaknesses (3 Factors):
Promoter shareholding dilution
Expensive valuation (PE > 40) limits margin of safety
Opportunities (1 Factor):
Increasing FII/FPI shareholding validates institutional interest
Disclaimer
This analysis is for educational and informational purposes only. It does not constitute investment advice. Trading and investing in stocks involve risks, and individuals should conduct their own due diligence or consult with a qualified financial advisor before making any investment decisions. The author is not responsible for any gains or losses arising from the use of this analysis.
Cholamandalam Financial Holdings Ltd (CFHL) Triangle Breakout 1DCholamandalam Financial Holdings Ltd (CFHL) – Triangle Breakout & 1-Year Resistance Breakout 🚀
📊 Technical View:
CFHL has given a triangle breakout along with a 1-year resistance breakout, indicating strong bullish momentum. If Trend continues, The price action also shows a successful retest of the breakout zone, shows trend continuation.
Resistance Turned Support: ₹1650 – previously a resistance, now acting as strong support.
Current Action: Price broke above the ₹1650 range, retested the level today , and is now moving upward again.
Next Resistance Targets Levels: ₹1824 / ₹2004
Support Levels: ₹1536 / ₹1410
🏦 Company Overview:
Cholamandalam Financial Holdings Limited (CFHL), incorporated in 1949, is a part of the Murugappa Group, one of India’s most diversified business conglomerates.
CFHL is a Non-Deposit Taking Systemically Important Core Investment Company (CIC) registered with the Reserve Bank of India (RBI).
The company holds substantial investments in group companies and provides a diverse range of financial products and risk management services to individual and corporate clients through its subsidiaries and group companies.
📈 For educational purpose only. Not a buy/sell recommendation.

Tamilnad Mercantile Bank (TMB) – Update | 3.5% Move from Our Lvl🟢 Tamilnad Mercantile Bank (TMB) – Update | 3.5% Move from Our Level 🚀
Latest Update : Our analysis shared around ₹499 has played out well — TMB made an intraday high of ₹517, gaining nearly 3.5% from the mentioned level.
🏦 Company Overview:
Tamilnad Mercantile Bank Limited is one of the oldest and leading old private sector banks in India. The bank offers a wide range of banking products and services to retail, MSME, agricultural, and corporate customers.
Retail Products: Home loans, personal loans, auto loans, educational loans, business loans, and security-backed loans.
MSME Portfolio: Loans for manufacturing, traders, and service sector enterprises.
Agricultural Loans: Offered to individual farmers, farmer groups, agri-businesses, and agri-corporates.
📊 Technical View:
High Reached: ₹517 (▲3.5%)
Resistance: ₹510 – price tested and faced mild rejection here.
Supports: ₹466 / ₹440
💡 View: The stock showed strong momentum from the support zone and approached its major 1-year resistance area near ₹510–₹515. A sustained close above ₹515 can confirm a breakout and open the next upside targets of ₹535 / ₹600.
📈 For educational purpose only. Not a buy/sell recommendation.

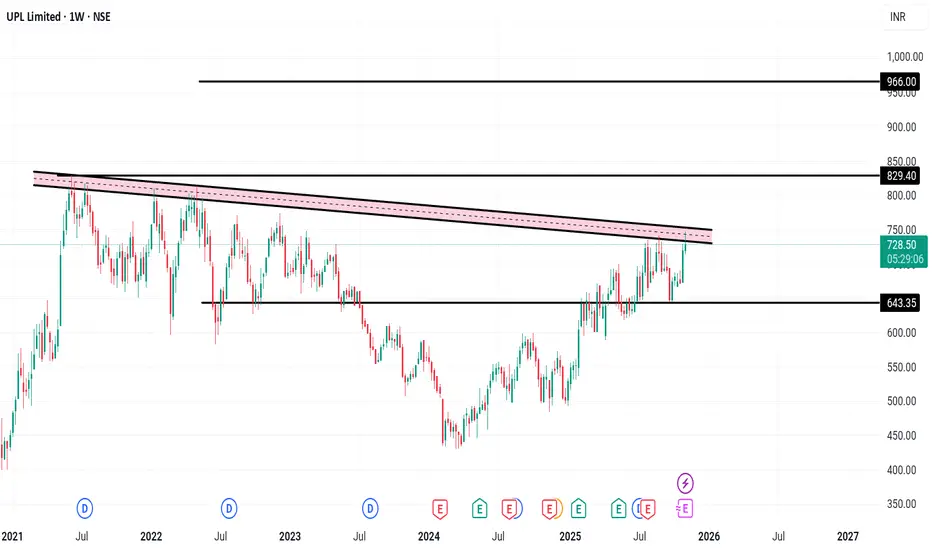
UPL Limited – Weekly Chart Analysis
📊 UPL Limited – Weekly Chart Analysis
Company Overview:
UPL Limited is a global leader in sustainable agricultural solutions, ranked among the top five agricultural solutions companies worldwide. The company operates across multiple countries, offering an integrated portfolio of patented and post-patent agricultural solutions for both arable and specialty crops — including biologicals, crop protection, seed treatment, and post-harvest solutions.
UPL is principally engaged in:
Production and sale of agrochemicals, field crops, and vegetable seeds
Non-agro business of industrial chemicals, chemical intermediates, and speciality chemicals
With market access across the world’s food basket, UPL is focused on driving growth and innovation throughout the entire agricultural value chain — from growers to distributors and partners. 🌱
📈 Technical View (1-Week Chart):
A trendline formation is observed on the weekly timeframe, indicating a potential breakout setup.
Resistance: ₹830 – strong resistance zone. A breakout above this level can trigger the next target near ₹930.
Support: ₹643 – strong support base.
This formation suggests the move could take time to play out, as it’s developing over the weekly chart.
📊 Key Financial Snapshot:
UPL’s current market price is around ₹724.15 with a P/E ratio of 11.65. The company holds a market capitalization of ₹61,068.53 crore and offers a dividend yield of 0.83%.
In the latest quarter, net profit stood at ₹612 crore, reflecting a 125.74% increase compared to the previous quarter. Quarterly sales were ₹12,019 crore, showing an 8.38% rise. The company’s Return on Capital Employed (ROCE) is 7.66%, indicating stable operational efficiency.
Disclaimer: For educational purposes only, not investment advice
DMART LONGDMART (Avenue Supermarts) has reached a strong trend support level. Additionally, in the daily timeframe, the current candle closed at the previous day's candle level.
Therefore, we can go long in DMART for a swing trade. Fundamentally, the quarterly results are already out, so there is no immediate issue regarding upcoming events.
Go long on DMART, but make sure to manage your trade quantity, risk, and reward based on your risk appetite. This is for educational purposes only and does not guarantee returns.
Real value of Market # Entry #Exit #Trail # StoplossThe phrase "Market # Entry #Exit #Trail # Stoploss" refers to the core parameters of a structured trading plan. The "real value" does not imply a single numerical figure, but rather the monetary gain or loss realized from a trade based on how these elements are defined and executed, combined with the discipline to follow them consistently.
Market: The specific financial instrument or market being traded (e.g., a particular stock, currency pair, or commodity).
Entry: The predefined price level or condition at which a trader opens a position. A good entry can offer a favorable risk-to-reward ratio from the start.
Exit: The predefined strategy or points at which a trader closes a position, either to take a profit or to limit a loss. Exits are crucial as they determine the final profit or loss.
Trail: Refers to a trailing stop-loss order, a dynamic risk management tool that automatically adjusts the stop-loss level as the market price moves in the trader's favor. This locks in profits while allowing the trade to continue if the price keeps moving favorably.
Stoploss (SL): A pre-determined price level or percentage below (for a long position) or above (for a short position) the entry price where the position is automatically closed to prevent further losses if the market moves against the trader.

Tamilnad Mercantile Bank – 1D Chart | Strong Resistance Zone🟢 Tamilnad Mercantile Bank (TMB) – 1D Chart | Strong Resistance Zone Ahead
📊 Chart Setup:
TMB is testing its major 1-year resistance zone around ₹510, a key level that has capped price movements for months. A strong daily close above ₹510 could trigger momentum towards higher targets.
🔹 Resistance: ₹510 (Major 1-year resistance)
🔹 Targets on Breakout: ₹535 / ₹600
🔹 Supports: ₹466 / ₹440
🔹 View: Price consolidating near breakout zone. Sustained close above ₹510 can signal trend continuation.
🏦 Fundamental Update – Q2 FY26 Results Highlights:
Tamilnad Mercantile Bank delivered steady performance with profit growth and improved asset quality.
• Net Profit: ₹318 Cr ↑ (▲4.95% YoY)
• Total Business: ↑11.40%
• Deposits: ₹55,421 Cr ↑12.32%
• Advances: ↑10.5%
• Net Interest Income: ₹597 Cr ↑0.17%
• Gross NPA: ↓ to 1.01%
• Net NPA: ↓ to 0.26%
• Capital Adequacy Ratio (CAR): Strong at 30.96%
➡️ Stable performance, improving asset quality, and strong capital base add confidence to the technical setup.
📈 For educational purpose only. Not a buy/sell recommendation.

TechnoFunda Analysis: ASK Automotive Ltd(ASKAUTOLTD)In the ever-evolving automotive landscape, ASK Automotive Ltd stands out as a powerful blend of technical resilience and fundamental strength. With strong operational performance, expanding margins, and rising institutional confidence, the company has emerged as one of India’s leading auto component players specializing in braking systems, aluminum precision parts, and EV-compatible components.
Let’s decode ASK Automotive from both Technical and Fundamental perspectives to assess its investment potential for long-term investors and swing traders alike.
**************Technical Analysis*******************
ASK Automotive is currently in a buy zone, with a favorable risk-reward setup supported by higher timeframe structure. Traders can accumulate near supports with a stop loss below ₹470 for targets up to ₹540–560.
For investors, the current price offers a good entry point for long-term compounding given the synergy between chart strength and business fundamentals.
Trend: Uptrend remains intact across all major timeframes.
Momentum Indicators: RSI is recovering from the 40–45 zone, hinting at renewed bullish momentum.
Volume Action: Rising volume near the 200 EMA suggests smart money accumulation.
Short-Term View: A decisive close above ₹500 could lead to a near-term rally towards ₹540–560.
Medium-Term View: Sustained trading above ₹560 may open the path toward ₹600+ in the coming months.
**************Fundamental Analysis***************
1. Company Overview
Incorporated in 1988, ASK Automotive Ltd is one of India’s largest manufacturers of Advanced Braking Systems, supplying critical friction and safety components to leading two-wheeler and four-wheeler OEMs such as Hero MotoCorp, Honda, Suzuki, TVS, Bajaj, and Royal Enfield.
The company has diversified into lightweight aluminum precision solutions and EV-compatible products, making it a forward-looking player in India’s auto ancillary space.
2. Industry Analysis
India’s auto component industry is projected to grow at a CAGR of 10–12% over the next 5 years, driven by:
Increasing domestic vehicle production
Strong aftermarket demand
Rapid adoption of EVs and hybrid vehicles
Export opportunities due to global supply chain realignments
Within this context, ASK Automotive’s leadership in braking and aluminum lightweighting places it at the core of this structural growth story. With its 50% market share in 2W braking systems, it stands to benefit significantly from the 2W and EV upcycle.
3. Economic Conditions
The broader Indian economy provides a supportive backdrop:
GDP growth above 7% ensuring stable demand
Falling input inflation, aiding margin expansion
Government PLI schemes promoting domestic manufacturing
EV policy tailwinds, increasing OEM collaboration opportunities
Thus, macroeconomic conditions currently favor sustained growth in the auto ancillary sector.
4. Qualitative Analysis
Strengths:
Market leader with 50% share in the 2W braking system segment
Diversified product portfolio: braking, aluminum, safety cables, and EV components
Strong OEM relationships ensuring steady order flow
17 manufacturing facilities across India + 1 JV
Strategic partnerships with AISIN (Japan), LIOHO (Taiwan), and FRAS-LE (Brazil)
Focused R&D investments in EV and lightweight solutions
Weaknesses / Risks:
Heavy dependence on the two-wheeler segment (76% of OEM revenue)
High P/E valuation limits near-term upside
Raw material cost volatility could impact margins
Export contribution (5%) remains relatively small
5. Quantitative Analysis
Compounded Growth Ratios:
Sales CAGR (3Y): 21%
Profit CAGR (3Y): 44%
ROE (Last Year): 27%
Stock Price CAGR (1Y): 17%
ASK Automotive’s growth trajectory reflects consistent expansion in both topline and bottom-line metrics, alongside superior capital efficiency.
6. Past, Present & Future Growth Outlook
Past (FY19–FY21):
The company faced headwinds due to an industry slowdown and pandemic impact. Sales fell marginally but profitability remained intact, proving operational resilience.
Present (FY22–FY25):
Strong recovery phase driven by OEM revival, export traction, and margin expansion. FY25 saw record revenue of ₹3,630 Cr with 12% OPM and 27% ROE — its best performance yet.
Future (FY26–FY28):
ASK Automotive’s focus on EV-compatible lightweighting, thermal management systems, and global JVs positions it for 15–18% CAGR growth.
The upcoming Bengaluru plant (₹200 Cr capex) and 9.9 MW solar facility are expected to boost both capacity and sustainability credentials.
ASK Automotive represents a rare blend of technical strength, financial soundness, and industry leadership. With a clear growth trajectory, expanding institutional interest, and consistent operational excellence, it holds the potential to become one of India’s top-performing auto ancillary stocks in the coming decade.

XAUUSD – Gold Trading Plan: Fresh Record Highs & Fibo Zone React📊 Market Context
Gold regained strong bullish momentum on Monday, surging to a new record high above 3,720 USD/oz. The Fed’s dovish outlook, signaling the possibility of two additional rate cuts this year, continues to support non-yielding assets like gold. At the same time, geopolitical risks remain a tailwind for safe-haven demand.
🔢 Technical Analysis (H2)
Immediate Resistance / SELL Zones:
3,818.769 – Key reaction zone where sellers may defend aggressively.
3,754.890 – Secondary SELL zone reaction area for short-term pullbacks.
Mid-Level Support / BUY Zone:
3,694.521 – First key area to watch for dips and potential buy reactions.
3,660.130 – Stronger support level if price pulls back deeper.
Major BUY Zone Reaction:
3,583.663 – Critical confluence of structure and Fibonacci support, a potential bounce zone if a major correction unfolds.
📈 Suggested Trading Scenarios
1️⃣ Bullish Continuation Setup
BUY: Look for pullbacks to 3,694–3,660 with bullish candlestick confirmation.
Targets: 3,754 → 3,818, leave partial position open if momentum breaks higher.
Stop Loss: Below 3,645 for safer positioning.
2️⃣ Countertrend SELL Setup
SELL: Enter short at 3,754–3,818 zones only with strong rejection signals.
Targets: 3,694 → 3,660, trail stops aggressively to lock profits.
3️⃣ Deep Correction Opportunity
BUY: If price flushes to 3,583–3,585, consider scaling into longs.
Targets: 3,660 → 3,754, aligning with the broader uptrend.
⚠ Key Trading Notes
Expect increased volatility with Fed guidance and ongoing geopolitical risks.
Use smaller position sizes near resistance zones and employ stop-loss discipline.
Avoid mid-range entries; focus on well-defined zones for optimal risk-to-reward setups.
💬 Community Discussion
📊 Will gold sustain its rally toward 3,818 or see a deep pullback before another leg higher? Share your charts and insights below so we can compare strategies!

SEBI Expedites IPO Approvals: A Deep Dive into India’s Capital SEBI Expedites IPO Approvals: A Deep Dive into India’s Capital Market Shift
1. Introduction
The Securities and Exchange Board of India (SEBI) has recently undertaken a significant step—fast-tracking Initial Public Offering (IPO) approvals. Traditionally, IPO approval in India has been a lengthy process, often stretching to six months. But SEBI’s new measures aim to cut this time nearly in half, potentially bringing it down to three months or less.
This shift comes at a time when India’s equity markets are booming, with record levels of fundraising expected in 2025. After raising around $20.5 billion through IPOs in 2024, analysts predict that 2025 could surpass this figure. According to reports, $8.2 billion has already been raised so far in 2025, with an additional $13 billion in IPOs already approved and nearly ₹18.7 billion pending approval.
2. Why SEBI is Expediting IPO Approvals
Several factors are driving SEBI to accelerate the IPO pipeline:
Surging Investor Appetite
Indian retail participation in stock markets has seen an explosion in recent years.
Over 11 crore Demat accounts are active as of 2025, compared to just 3.6 crore in 2019.
More retail investors mean more demand for IPOs, making faster approvals essential.
Global Capital Flows
India is seen as one of the fastest-growing large economies.
With global investors diversifying away from China, India is attracting billions in Foreign Portfolio Investments (FPIs).
A streamlined IPO process will help India capture this liquidity flow before it moves elsewhere.
Boosting Startup Ecosystem
Unicorns like PhysicsWallah, Urban Company, and WeWork India are preparing for listings.
Startups require quicker capital-raising routes to compete globally.
Regulatory Efficiency and AI Adoption
SEBI is now deploying AI-powered document screening tools to check IPO filings.
This reduces human delays and allows faster compliance checks.
Collaboration with merchant bankers and exchanges has also been strengthened.
Record Fundraising Target
SEBI expects India to break the $20B mark again in 2025, possibly setting an all-time record.
Expedited approvals are central to making this happen.
3. How the New Approval System Works
Traditionally, IPO approvals involved multiple manual steps:
Filing of Draft Red Herring Prospectus (DRHP).
SEBI reviews disclosures, company financials, risk factors, and governance.
Queries are raised with the company, leading to back-and-forth communication.
Final approval takes 4–6 months.
Now under the fast-track mechanism:
AI Pre-Screening: Automated checks scan filings for missing data, compliance issues, and inconsistencies.
Concurrent Review: Instead of sequential reviews, SEBI, merchant bankers, and exchanges review documents simultaneously.
Time-Bound Queries: Companies are given strict deadlines to respond to SEBI’s queries.
Standardization: Risk disclosure formats and governance checks are now standardized across sectors.
This is expected to cut approval timelines by 40–50%.
4. IPO Pipeline for 2025
Some big-ticket IPOs in the pipeline include:
PhysicsWallah (₹3,820 crore) – Edtech unicorn expanding into AI-driven education.
Urban Company – Already raised ₹854 crore from anchor investors; IPO opening soon.
LG Electronics India – Large consumer electronics brand targeting India’s growing tech-savvy population.
WeWork India – Despite global challenges, the Indian arm remains profitable and expansion-focused.
Credila Financial Services – Education loan subsidiary of HDFC, a high-demand financial segment.
The SME IPO market is equally hot with listings like Goel Construction debuting at a 15% premium and Prozeal Green Energy getting SEBI approval.
5. Benefits of Faster IPO Approvals
For Companies
Quicker access to capital for expansion.
Ability to capitalize on favorable market sentiment without delays.
Reduced costs of prolonged regulatory processes.
For Investors
More frequent and diverse IPO opportunities.
Increased transparency due to standardized disclosures.
Higher liquidity as more firms enter the public market.
For Indian Markets
Strengthened image of India as an investment hub.
Alignment with global best practices (US SEC and Hong Kong’s IPO process are faster).
Improved global competitiveness for Indian startups.
6. Risks and Challenges
Speed vs. Quality
Faster approvals must not compromise on due diligence.
Weak companies slipping through could hurt investor trust.
Market Saturation
Too many IPOs in a short span could lead to oversupply, reducing listing gains.
Retail Investor Overexposure
Retail investors may flock to IPOs without understanding fundamentals, increasing risk of losses.
Global Volatility
Geopolitical tensions, US interest rate decisions, or oil price shocks can derail IPO plans.
7. Global Context
Globally, IPO markets have been mixed:
US Markets: Tech IPOs are recovering but still face valuation pressure.
China: Tighter regulations have slowed down IPO fundraising.
Middle East: Saudi Arabia and UAE continue to see large IPOs in energy and infrastructure.
In this scenario, India is positioning itself as a global IPO leader, especially in the tech and services sector.
8. Investor Strategy for 2025 IPOs
For investors, the IPO rush creates both opportunities and challenges. Some strategies include:
Focus on Fundamentals
Look for companies with strong financials, governance, and growth potential.
Avoid IPOs driven purely by hype.
Anchor Investor Signals
Strong anchor participation (like Urban Company’s ₹854 Cr funding) signals institutional confidence.
Sector Plays
Edtech, Renewable Energy, Fintech, and Consumer Services are hot sectors.
Traditional sectors like construction and manufacturing are also showing resilience.
Listing Gains vs. Long-Term Holding
Some IPOs (like Goel Construction SME) deliver quick listing pops.
Larger IPOs (like PhysicsWallah, Urban Company) may be better for long-term growth.
9. Case Study: Urban Company IPO
Urban Company is a prime example of SEBI’s faster approval ecosystem.
Filed DRHP earlier in 2025.
Received SEBI approval within 12 weeks.
Raised ₹854 crore from anchors before IPO launch.
Price band set at the higher end, reflecting strong demand.
Market analysts project strong long-term growth given India’s rising demand for home services.
This showcases how SEBI’s new process benefits both issuers and investors.
10. Conclusion
SEBI’s decision to expedite IPO approvals is a game-changer for India’s financial markets. By cutting approval times, using AI-driven compliance, and standardizing processes, SEBI is creating a faster, more transparent, and investor-friendly IPO environment.
With major companies like PhysicsWallah, Urban Company, Neilsoft, and Prozeal entering the market, and regulatory support from SEBI, 2025 is poised to be a record-breaking year for IPO fundraising in India.
However, investors must balance enthusiasm with caution—choosing fundamentally strong IPOs, monitoring global market conditions, and avoiding blind bets driven by hype.
In essence, SEBI’s move reflects India’s ambition to emerge as a global capital-raising hub, connecting domestic growth stories with global capital at unprecedented speed and scale.
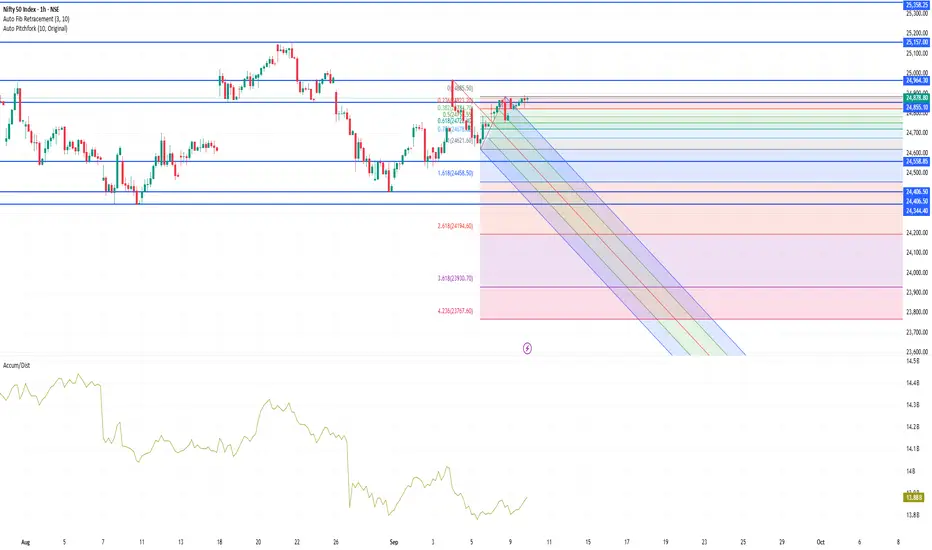
NIFTY50 index levelsKey Levels & Swing Trade Outlook (1-Hour Timeframe)
Resistance & Support (Broader Technical View)
Key Resistance Zones:
24,900–25,000 range (daily level)—a critical breakout area
Slightly higher potential if breakout occurs, toward 25,200+
Immediate Support Zones:
24,750–24,800 level
Broader range support at 24,620–24,700
More defensive base near 24,400 (longer-term)
Intraday Pivot Levels (Based on latest derived pivots)
From Moneycontrol, for the current trading session:
Classic Pivot R1: 24,855 | R2: 24,937 | R3: 24,989
Classic Pivot S1: 24,721 | S2: 24,669 | S3: 24,587
1-Hour Swing Trading Perspective
Although explicit 1-hour pivot data is not readily available, we can infer swing strategies using the broader technical context and typical indicators:
1-Hour Swing Fundamentals:
Use short-term moving averages (e.g., 20/50 EMA) to gauge trend direction. The index is trading above these on shorter timeframes, suggesting intraday bullish bias
Common indicators: RSI, Bollinger Bands, MACD, etc.