Trade Catalyst Series - Episode 2 // GOKALDAS EXPORTSHey folks,
Today in new developing events in US-India deals, I have come with another stock to lookout.
This one is focused only for long-term window with the latest Reciprocal tariffs in talk.
1. Macro Overview
The US-India Interim Trade Agreement published today is a structural game changer for Indian textiles.
The Headline: US Reciprocal Tariffs on Indian exports (apparel) slashed from ~50% to 18%.
The Significance: This is not just a rollback; it is a competitive flip. For the last decade, India (tariff ~20%+) lost share to Vietnam and Bangladesh (zero or low duty).
But now new Hierarchy we have :
India: ~18% Duty
Vietnam/Bangladesh: ~20% Duty
China: ~30-35%+ Duty
Result: India is now the most cost-efficient sourcing hub for US brands.
2. Sector Impact: The "China+1" Accelerator
The entire Indian textile export sector moves from "survival mode" to "growth mode."
Exporters were absorbing 10-15% of the tariff burden to keep clients. This cost instantly vanishes, flowing directly to the bottom line.
US brands will likely to shift volume from Vietnam to India capturing the 2% duty spread.
3. Stock Spotlight: Why GOKEX you ask?
Gokaldas Exports is the highest-beta play on this specific catalyst.
~70% of GOKEX’s revenue comes from the US. No other major listed player (KPR Mill, Trident) has this level of direct sensitivity to US tariffs.
GOKEX recently acquired Atraco (Kenya) and Matrix (India). These assets were dragging earnings due to low utilization. With the tariff barrier removed, GOKEX can fill these factories with high-margin US orders.
4. Fundamental Check
Q3 FY26 (Bottom): Net profit crashed 71% YoY to inr14.6 Cr; Margins slumped to 7.7%. This is now priced in as the worst-case scenario.
FY27 Outlook (Recovery):
Revenue is expected to grow 15-20% as order books swell.
Margins: Projected to reduce back to 11-13% + tariff savings.
Valuation: Trading at ~26x depressed earnings. If earnings double in FY27 (base case on margin normalization), forward P/E drops to an attractive 13-15x.
5. Technical Setup - Daily Chart
The stock has already rallied ~40% this week.
Now on daily frame the RSI shows it is in overbought zone due to rush buying of the stock.
Next to watch out is for a minor pull back to the near support zone (here 0.786 level of fib) to make an entry.
the next resistance to watch will be 900. for that I would be monitoring the order book of the company in the next quarter.
6. Key Risks
-> The stock already rallied ~40% on rumors. A short-term dip is highly likely as other traders book profits.
->US Recession: Lower tariffs don't matter if US consumers stop buying clothes. Monitor US retail data closely.
-> A strengthening of rupee could eat into the new margin gains.
7. Final Verdict
I am long on this one so will be keep buying on Dips.
first Entry : 700-720
T1 : 1000
T2 : 1150
SL : 650
The 18% tariff rate is giving Indian exports distinct edge over Vietnam. so major focus after entry will be on the management commentary of order book visibility for Q1 FY27. If this all confirms volume shifts from Vietnam, the stock heads to inr1,000+, achieving our t2 or a new ATH.
Future episodes will explore additional sectors and companies that could emerge as beneficiaries of evolving global trade partnerships. If your eye catches on to some particular stock reflecting on the same let me know in the comments below I will do a episode on it too.
Fundamentalanalsysis

Market Fundamentals: A Comprehensive Overview1. Definition and Importance of Market Fundamentals
Market fundamentals can be defined as the underlying forces or conditions that influence the supply and demand of financial instruments, ultimately determining their prices. These fundamentals are rooted in economic indicators, corporate performance, geopolitical developments, and investor sentiment.
The importance of market fundamentals lies in their ability to:
Provide a rational basis for valuing securities.
Help predict long-term trends in asset prices.
Allow investors to identify mispriced assets and investment opportunities.
Assist in understanding macroeconomic conditions and their impact on various sectors.
By studying market fundamentals, investors can make informed decisions rather than relying solely on speculation or short-term price fluctuations.
2. Key Components of Market Fundamentals
Market fundamentals consist of various factors that can be broadly categorized into economic fundamentals, financial fundamentals, and qualitative factors.
a) Economic Fundamentals
Economic fundamentals are indicators that reflect the overall health of an economy and influence market performance. These include:
Gross Domestic Product (GDP): GDP measures the total value of goods and services produced within a country. A growing GDP signals economic expansion, increased corporate earnings, and potentially higher stock prices. Conversely, declining GDP indicates a slowdown or recession, which can negatively affect markets.
Inflation Rates: Inflation measures the general rise in prices over time. Moderate inflation is often a sign of a healthy economy, but high inflation erodes purchasing power and can lead central banks to raise interest rates, impacting asset prices.
Interest Rates: Set by central banks, interest rates influence borrowing costs, corporate profits, and consumer spending. Lower interest rates encourage investment and spending, typically boosting stock markets, whereas higher rates can dampen economic activity.
Employment Data: Employment levels, wages, and unemployment rates reflect economic productivity and consumer purchasing power. Strong employment data usually boosts market confidence, while rising unemployment may lead to reduced spending and market corrections.
Trade Balance and Currency Strength: A country’s imports, exports, and currency value affect corporate earnings, particularly for multinational companies. A strong currency can reduce export competitiveness but lower import costs.
b) Financial Fundamentals
Financial fundamentals focus on the health, performance, and valuation of individual companies or sectors. Key metrics include:
Revenue and Earnings Growth: The primary indicators of corporate performance are revenue (sales) and net income (profit). Consistent growth signals strong management and potential for long-term stock appreciation.
Profit Margins: Profitability ratios, such as gross, operating, and net profit margins, measure efficiency and cost management. High margins often indicate competitive advantage and financial strength.
Return on Equity (ROE) and Return on Assets (ROA): ROE shows how effectively a company uses shareholder capital, while ROA measures how efficiently assets generate profits. Higher returns typically attract investors.
Debt Levels: The debt-to-equity ratio and other leverage indicators reveal financial risk. Excessive debt can lead to solvency issues, especially in economic downturns, while manageable debt supports growth and expansion.
Cash Flow: Cash flow from operations reflects a company’s ability to generate liquidity for reinvestment, debt servicing, and dividends. Strong cash flow indicates financial stability.
Valuation Metrics: Ratios such as Price-to-Earnings (P/E), Price-to-Book (P/B), and Price-to-Sales (P/S) help investors assess whether a stock is overvalued, undervalued, or fairly priced relative to its fundamentals.
c) Qualitative Factors
Not all market fundamentals are quantitative. Qualitative factors also play a crucial role in determining asset value:
Management Quality: The experience, strategy, and integrity of a company’s leadership affect its long-term success. Good management can navigate market challenges effectively.
Industry Position and Competitive Advantage: Companies with strong brand recognition, technological superiority, or unique market niches tend to outperform competitors.
Regulatory Environment: Government policies, taxation, and regulations can impact profitability and market behavior. For instance, subsidies or trade tariffs can boost or hinder specific sectors.
Geopolitical Stability: Political unrest, international conflicts, and diplomatic relations influence investor confidence and capital flows, affecting markets.
3. Market Fundamentals in Different Asset Classes
Market fundamentals apply across various financial markets:
Equities (Stocks): Stock prices are influenced by company earnings, sector performance, and macroeconomic indicators. Strong fundamentals often indicate long-term investment potential.
Bonds: Bond prices are affected by interest rates, inflation, and credit ratings. Investors look for stable returns and low default risk.
Commodities: Commodity prices depend on supply-demand dynamics, production costs, geopolitical events, and weather conditions. For example, oil prices are highly sensitive to OPEC decisions and global demand trends.
Foreign Exchange (Forex): Currency values are influenced by trade balances, interest rates, inflation, and political stability. Strong economies and fiscal policies attract foreign investment, strengthening the currency.
4. Fundamental Analysis vs. Technical Analysis
While market fundamentals focus on intrinsic value, technical analysis examines historical price patterns and trading volumes to predict short-term market movements. Both approaches complement each other:
Fundamental analysis is long-term oriented, aiming to identify undervalued or overvalued assets.
Technical analysis is short-term oriented, useful for timing entries and exits based on market psychology and trends.
Savvy investors often combine both to make well-informed decisions.
5. Challenges and Limitations of Market Fundamentals
Despite their importance, relying solely on fundamentals has challenges:
Market Sentiment: Emotional behavior, speculation, and herd mentality can cause prices to deviate from fundamental values. For example, during a bubble, assets may be overvalued despite weak fundamentals.
Data Accuracy: Economic and corporate data can be revised, delayed, or manipulated, affecting analysis accuracy.
Complex Interdependencies: Globalization means that local economic changes can have far-reaching effects, making prediction more complicated.
Time Lag: Fundamental changes often take time to reflect in market prices, leading to potential short-term volatility.
6. Practical Applications of Market Fundamentals
Investors and traders use fundamentals to:
Identify long-term investment opportunities by spotting undervalued assets.
Develop portfolio strategies that align with economic cycles and sector performance.
Assess risk by evaluating financial stability, debt levels, and external threats.
Make informed decisions during mergers, acquisitions, and capital investments.
For institutions, market fundamentals guide policy-making, monetary decisions, and strategic planning.
7. Conclusion
Market fundamentals form the backbone of informed investment decision-making. By examining economic indicators, corporate financial health, and qualitative factors, investors can assess the intrinsic value of assets and anticipate market trends. While markets can be influenced by sentiment and speculation, a strong grasp of fundamentals provides a reliable framework for long-term financial success.
In an increasingly complex and interconnected world, understanding market fundamentals is not just a tool for investors but a necessity for navigating the dynamic landscape of global finance. By combining analytical rigor with strategic insight, individuals and institutions alike can make smarter, more sustainable decisions, achieving financial growth while mitigating risk.

Technical vs. Fundamental AnalysisIntroduction
In the world of investing and trading, understanding the value and timing of financial instruments is crucial. Investors and traders often rely on two primary methods to guide their decisions: technical analysis and fundamental analysis. While both aim to inform decisions about buying, holding, or selling securities, they differ fundamentally in approach, methodology, and application. Understanding the strengths, limitations, and appropriate use cases of each is vital for anyone participating in financial markets.
1. Fundamental Analysis
Fundamental analysis focuses on evaluating a security’s intrinsic value. It attempts to determine whether a stock, bond, or other asset is overvalued, undervalued, or fairly priced based on the underlying economic and financial factors.
1.1 Core Principles
At its core, fundamental analysis is about understanding the “health” of a company or asset. Analysts examine various factors, including:
Financial Statements: Income statements, balance sheets, and cash flow statements are analyzed to assess profitability, liquidity, solvency, and efficiency. Key metrics include earnings per share (EPS), price-to-earnings (P/E) ratio, debt-to-equity ratio, and return on equity (ROE).
Industry Conditions: The sector in which a company operates affects its potential. Market share, competitive advantages, regulatory environment, and industry growth trends are critical considerations.
Macroeconomic Factors: Interest rates, inflation, GDP growth, and fiscal policies can significantly influence asset prices.
Management Quality: Leadership decisions, corporate governance, and strategic vision often determine long-term success.
1.2 Methods
There are two primary approaches to fundamental analysis:
Top-Down Approach: Analysts first study macroeconomic conditions, then industry trends, and finally specific companies.
Bottom-Up Approach: Focuses on analyzing individual companies, often ignoring broader economic conditions, to identify investment opportunities.
1.3 Example
Suppose an investor evaluates Company X, a technology firm. By analyzing its revenue growth, profit margins, R&D spending, and competitive position, the investor determines the intrinsic value of the stock to be $150. If the current market price is $120, the stock may be considered undervalued, presenting a potential buying opportunity.
1.4 Advantages of Fundamental Analysis
Long-Term Perspective: Helps investors identify securities that may generate sustainable returns over years.
Value Identification: Can reveal undervalued or overvalued assets relative to intrinsic value.
Economic Insight: Offers a comprehensive understanding of industry and macroeconomic impacts on investments.
1.5 Limitations of Fundamental Analysis
Time-Consuming: Requires deep research, data collection, and analysis.
Subjectivity: Estimating intrinsic value involves assumptions that may differ among analysts.
Less Effective for Short-Term Trading: Market prices may diverge from fundamental values for extended periods.
2. Technical Analysis
Technical analysis, on the other hand, focuses on price movements and trading patterns rather than the underlying business. It assumes that all relevant information is already reflected in the asset’s price, and that historical patterns tend to repeat over time.
2.1 Core Principles
Technical analysis is based on three key assumptions:
Market Action Discounts Everything: Prices reflect all available information, including fundamentals, market sentiment, and news.
Prices Move in Trends: Once established, trends are more likely to continue than reverse, at least until proven otherwise.
History Tends to Repeat Itself: Human psychology leads to recurring price patterns.
2.2 Tools and Techniques
Technical analysts use charts, patterns, and indicators to forecast price movements:
Charts: Line charts, bar charts, and candlestick charts visualize price action over different time frames.
Indicators: Moving averages, relative strength index (RSI), MACD, Bollinger Bands, and Fibonacci retracement levels help identify trends and momentum.
Patterns: Head-and-shoulders, double tops/bottoms, triangles, and flags signal potential reversals or continuations.
Volume Analysis: Helps confirm trends or warn of potential reversals.
2.3 Example
A trader observes that Stock Y has formed a “double bottom” pattern on its daily chart, signaling a potential upward reversal. Using this information, the trader may enter a long position, anticipating a price increase based on historical pattern behavior rather than the company’s earnings or fundamentals.
2.4 Advantages of Technical Analysis
Timing and Short-Term Opportunities: Helps traders make decisions based on market trends and entry/exit points.
Quantitative Approach: Uses measurable price data and mathematical indicators.
Market Sentiment Insight: Captures emotions and behaviors that drive short-term price movements.
2.5 Limitations of Technical Analysis
Does Not Measure Intrinsic Value: Focuses purely on price action without regard to a company’s financial health.
False Signals: Patterns and indicators can fail, leading to losses.
Short-Term Focus: Often unsuitable for long-term investment strategies.
3. Fundamental vs. Technical Analysis: Key Differences
Feature Fundamental Analysis Technical Analysis
Focus Intrinsic value of the asset Price movements and trends
Time Horizon Long-term Short- to medium-term
Basis Financial statements, economic indicators, industry trends Price charts, volume, technical indicators
Assumption Market prices eventually reflect true value History tends to repeat; price trends continue
Tools Ratios, financial models, macroeconomic data Charts, trend lines, moving averages, oscillators
Decision Making Buy undervalued, sell overvalued Buy when patterns signal upward trend, sell on reversal signals
Use Case Investment (long-term) Trading (short-term or swing trading)
4. Integrating Both Approaches
Many successful investors and traders combine both fundamental and technical analysis:
Long-Term Investors: Use fundamental analysis to identify undervalued stocks, then apply technical analysis to optimize entry points.
Swing Traders: May rely primarily on technical analysis but consider fundamental news (earnings, economic data) to anticipate volatility.
Portfolio Management: Combining both can improve risk management and timing of trades.
Example of Integration
Consider a tech company showing strong earnings growth (fundamental analysis). A technical analyst may wait for a price breakout above a resistance level before entering a trade. By combining both approaches, the investor aligns value with optimal timing.
5. Market Psychology and Behavioral Insights
Fundamental Analysis: Relies on rational evaluation of financial health, assuming markets are logical over the long term.
Technical Analysis: Captures human psychology, fear, and greed, which often dominate short-term market behavior.
This difference reflects the broader tension between value investing and trend trading. Technical analysis often thrives in volatile, sentiment-driven markets, whereas fundamental analysis provides a grounded assessment during stable, growth-oriented periods.
6. Conclusion
Both fundamental and technical analysis offer valuable insights, but they serve different purposes. Fundamental analysis is ideal for long-term investors seeking intrinsic value, focusing on company performance, industry trends, and economic conditions. Technical analysis suits short-term traders aiming to exploit market trends and price patterns, focusing on timing and market sentiment.
While some purists favor one approach over the other, the most successful market participants often blend the two. Fundamental analysis provides the “why” behind an investment, while technical analysis provides the “when.” By understanding the strengths and limitations of each method, investors and traders can make more informed, strategic, and disciplined financial decisions.
In today’s dynamic financial markets, a holistic approach that considers both fundamentals and technical signals can enhance profitability, reduce risk, and provide a robust framework for navigating complexity. Knowledge of both allows market participants to adapt to changing conditions, combine long-term insight with short-term strategy, and ultimately make more confident decisions in the face of uncertainty.

Fundamental Analysis Basics (P/E, P/B, ROE, ROCE)1. Price-to-Earnings Ratio (P/E Ratio)
What it Means
The P/E ratio tells you how much investors are willing to pay today for ₹1 of a company’s earnings. It connects a company’s market price with its profit generation ability.
Formula:
P/E = Current Market Price ÷ Earnings Per Share (EPS)
Why P/E Matters
A high P/E suggests that investors expect strong future growth.
A low P/E may indicate undervaluation, or that the company is facing growth challenges.
How to Interpret P/E
High P/E (>30): Market is optimistic, often seen in growth sectors like technology or consumer internet companies.
Moderate P/E (15–30): Indicates stable performance, common in quality midcaps and blue-chip stocks.
Low P/E (<15): Might indicate a value pick or a fundamentally weak company.
Limitations
P/E does not work well if profits are volatile or negative.
P/E differs widely across sectors—comparing a bank with a tech company is misleading.
Best Use Cases
Compare P/E with the stock’s historical average.
Compare P/E with the industry average.
Use Forward P/E (P/E using estimated future earnings) to understand growth visibility.
2. Price-to-Book Ratio (P/B Ratio)
What it Means
The P/B ratio compares the company’s market value with its book value (net assets). It tells how many times investors are paying relative to assets.
Formula:
P/B = Market Price per Share ÷ Book Value per Share
Book Value per Share = (Total Assets – Total Liabilities) ÷ Number of Shares
Why P/B Matters
Useful for asset-heavy sectors such as banks, NBFCs, manufacturing, and PSU companies.
Helps understand whether the stock trades above or below its actual net worth.
How to Interpret P/B
P/B < 1: Stock may be undervalued; the company trades below its net worth.
P/B between 1–3: Normal valuation for most companies.
P/B > 3: Indicates premium valuation; market expects strong future returns.
Limitations
Not useful for asset-light businesses like IT, FMCG, or digital companies where the real value lies in brand and intellectual property.
P/B alone does not measure profitability or efficiency.
Best Use Cases
Combine P/B with ROE to judge whether a company is generating strong returns on its net assets.
Valuable for evaluating banks and financial institutions.
3. Return on Equity (ROE)
What it Means
ROE shows how efficiently a company generates profits using shareholder equity. It reflects management’s ability to create value.
Formula:
ROE = Net Profit ÷ Shareholder’s Equity × 100
Why ROE Matters
High ROE indicates that the company uses shareholder money efficiently.
It reflects competitive advantage, pricing power, and strong demand.
How to Interpret ROE
ROE > 20%: Excellent – shows strong efficiency and high margins.
ROE 15–20%: Good – typical for stable companies.
ROE < 10%: Weak – indicates poor profitability or inefficient use of equity.
Limitations
ROE can be misleading if the company has very high debt; equity becomes smaller because debt funds the assets.
A temporary profit spike can artificially inflate ROE.
Best Use Cases
Compare ROE with the industry average.
Use ROE along with P/B to identify high-quality compounders.
Check 5–10 year ROE trends for consistency.
4. Return on Capital Employed (ROCE)
What it Means
ROCE measures profitability based on all capital employed, including equity and debt. It gives a more holistic view than ROE.
Formula:
ROCE = EBIT ÷ (Equity + Debt) × 100
Here, EBIT (Earnings Before Interest and Taxes) measures operating profit.
Why ROCE Matters
Shows how efficiently the company generates profits using both debt and equity.
Crucial for capital-heavy industries like manufacturing, steel, energy, or infrastructure.
How to Interpret ROCE
ROCE > 20%: Excellent capital allocation, highly efficient.
ROCE 15–20%: Good and sustainable.
ROCE < 12%: Weak returns relative to capital employed.
Limitations
ROCE may fluctuate due to capital expansion cycles.
Not very useful for debt-free companies where ROE already gives similar insight.
Best Use Cases
Compare ROCE with the company’s cost of capital (WACC).
High ROCE indicates strong pricing power and effective management.
How These Ratios Work Together
Using P/E, P/B, ROE, and ROCE in isolation is incomplete. Successful investors combine them for a full picture of valuation and performance.
1. P/E + ROE → Identifying Growth at Reasonable Price (GARP)
High ROE + reasonable P/E = High-quality stock at fair valuation.
Example: A company with ROE 20% and P/E 18 is usually attractive.
2. P/B + ROE → Banking and Financial Analysis
High ROE + moderate P/B = efficient bank with good asset quality.
A bank with ROE 17% and P/B 1.5 is stronger than a bank with ROE 10% and P/B 1.
3. ROCE + P/E → Capital-Intensive Business Screening
High ROCE suggests strong return on capital.
If P/E is low while ROCE is high, the stock may be undervalued.
4. ROE vs ROCE → Debt Analysis
ROE > ROCE: Company uses leverage (debt) to boost shareholder returns.
ROCE > ROE: Limited debt; equity is used more efficiently.
Practical Example (Simplified)
Suppose a company has the following metrics:
P/E = 20
P/B = 3
ROE = 22%
ROCE = 18%
Interpretation:
P/E 20 → Fair valuation.
P/B 3 → Market expects strong future performance.
ROE 22% → Very efficient with shareholder capital.
ROCE 18% → Strong use of total capital.
Conclusion:
This is a high-quality growth company trading at a fair-to-premium valuation.
How Investors Use These Ratios in Real World
1. For Long-Term Investors
Focus on businesses with consistently high ROE and ROCE.
Avoid companies with declining profitability, even if valuation looks low.
2. For Value Investors
Look for low P/E and low P/B stocks with improving ROE/ROCE.
These indicate potential turnarounds.
3. For Growth Investors
Accept high P/E if ROE and ROCE remain elevated for multiple years.
Growth sustainability is more important than cheap valuation.
4. For Traders
Use ratios to identify strong fundamentally-backed stocks for swing or positional trades.
Conclusion
P/E, P/B, ROE, and ROCE are essential tools of fundamental analysis. P/E and P/B help measure valuation, while ROE and ROCE measure profitability and efficiency. Together, they determine whether a stock is fundamentally sound, fairly priced, and capable of delivering long-term returns. When used consistently and compared with historical data, sector averages, and market conditions, these ratios give investors a powerful framework for making informed decisions.

Understanding the Fundamental MarketCore Principles of the Fundamental Market
Intrinsic Value Assessment:
The central idea in the fundamental market is that every asset has an intrinsic or “true” value. Investors compare this intrinsic value with the current market price to determine whether the asset is undervalued, fairly valued, or overvalued. Buying undervalued assets or selling overvalued ones forms the basis of long-term profit strategies.
Focus on Economic Fundamentals:
Fundamental markets heavily rely on macroeconomic and microeconomic indicators. For example, GDP growth, inflation rates, employment statistics, interest rates, and government fiscal policies are crucial in assessing the overall economic environment. At the micro level, company-specific data such as revenue, earnings, debt levels, cash flow, and competitive positioning are analyzed to determine the financial health and growth potential of individual firms.
Long-term Investment Horizon:
Unlike traders who operate in the short-term, the fundamental market favors long-term investments. Investors anticipate that while short-term price fluctuations may occur due to market sentiment or technical factors, in the long run, the market price of an asset will converge with its intrinsic value.
Key Components of Fundamental Market Analysis
Company Analysis (Equity Market):
In the stock market, fundamental analysis involves examining a company’s financial statements—balance sheet, income statement, and cash flow statement. Key metrics include:
Earnings per Share (EPS): Indicates profitability on a per-share basis.
Price-to-Earnings Ratio (P/E): Measures whether a stock is overvalued or undervalued relative to its earnings.
Debt-to-Equity Ratio: Assesses financial leverage and risk.
Return on Equity (ROE) and Return on Assets (ROA): Evaluate efficiency in using shareholders’ capital or assets to generate profits.
Beyond numbers, qualitative factors such as management quality, brand strength, market share, regulatory environment, and competitive advantages are also critical in assessing long-term growth potential.
Macroeconomic Analysis:
The broader economy directly influences asset prices. Factors such as:
Interest rates: Higher rates may reduce borrowing and consumer spending, negatively affecting company profits.
Inflation: Rising inflation can erode the real value of returns and affect purchasing power.
Fiscal and Monetary Policies: Government spending, tax policies, and central bank interventions can stimulate or constrain market growth.
Global Events: Geopolitical events, pandemics, and trade policies also play a significant role in determining market trends.
Industry Analysis:
Understanding the industry in which a company operates helps investors identify growth opportunities or potential risks. Factors to consider include:
Market size and growth potential
Competitive dynamics
Technological innovations
Regulatory constraints
Cyclical vs. non-cyclical industry characteristics
Valuation Models:
Investors use various models to estimate intrinsic value, including:
Discounted Cash Flow (DCF) Analysis: Projects future cash flows and discounts them to present value.
Dividend Discount Model (DDM): Focuses on the present value of expected dividends.
Comparable Company Analysis: Compares valuation multiples (like P/E, EV/EBITDA) with peers.
Asset-Based Valuation: Evaluates the net asset value of a company by subtracting liabilities from total assets.
Participants in the Fundamental Market
The fundamental market attracts a wide array of participants, including:
Long-term investors: Individual and institutional investors who seek wealth accumulation over years or decades.
Mutual funds and pension funds: These funds invest in fundamentally strong companies with sustainable growth.
Value investors: Investors who follow the philosophy of buying undervalued stocks with a margin of safety, popularized by Benjamin Graham and Warren Buffett.
Corporate analysts and research houses: Professionals who provide insights into company performance and macroeconomic trends.
Advantages of Operating in the Fundamental Market
Reduced Speculative Risk: By focusing on intrinsic value, investors can avoid the herd mentality and irrational exuberance often seen in speculative trading.
Long-Term Wealth Creation: Fundamental market investments are typically more stable and generate wealth over extended periods through price appreciation and dividends.
Informed Decision-Making: Thorough research and analysis ensure that investment decisions are grounded in reality rather than market sentiment.
Alignment with Economic Growth: Investments in fundamentally strong companies often mirror real economic growth, providing consistent returns.
Challenges of the Fundamental Market
Time-Consuming Analysis: Evaluating financial statements, industry dynamics, and macroeconomic trends requires significant effort and expertise.
Market Inefficiency: In the short term, market prices may deviate from intrinsic value due to speculation, news events, or investor sentiment.
Information Overload: Investors must filter vast amounts of data to focus on meaningful indicators.
Globalization and Complexity: International exposure introduces currency risks, geopolitical factors, and cross-border regulatory challenges.
Examples of Fundamental Market Strategies
Value Investing: Buying stocks that trade below their intrinsic value and holding until the market recognizes their true worth.
Growth Investing: Identifying companies with strong revenue and earnings growth potential even if current valuations are high.
Income Investing: Focusing on companies that provide regular dividend income alongside steady capital appreciation.
Sector Rotation: Moving investments across sectors based on macroeconomic cycles and industry trends.
Conclusion
The fundamental market is the backbone of rational, long-term investing. It emphasizes in-depth research, economic understanding, and valuation analysis to identify assets with sustainable growth potential. By concentrating on intrinsic value, participants in the fundamental market can mitigate short-term volatility and speculation, building wealth steadily over time. While it requires patience, diligence, and expertise, the fundamental market offers one of the most robust approaches to navigating the complexities of modern financial markets.
Ultimately, the fundamental market is not just about buying and selling assets—it’s about understanding the economy, businesses, and human behavior to make informed decisions that align with long-term financial goals.
STWP Analysis | ICICI Bank Showing Classic Breakout Behavior________________________________________
💼 ICICI BANK (NSE: ICICIBANK) | CMP ₹1436.60 (+1.36%)
Sector: Banking & Financial Services | Date: 19 Oct 2025
________________________________________
📊 Chart Summary
ICICI Bank closed strong at ₹1436.60, gaining +1.36% from its previous close of ₹1417.30.
Price made a high of ₹1439.60 — exactly around the Fibonacci resistance zone of ₹1439.85.
Volumes surged to 1.76x the average, with 1.70 crore shares traded against an average of 1.35 crore — indicating strong participation and renewed interest.
________________________________________
🟡 Technical Indicators Summary (Yellow Label Insight)
The chart highlights Bullish Momentum supported by a Strong Bullish Candle, indicating renewed buying interest.
A clear RSI breakout (68.36) confirms strengthening momentum, while the Bollinger Band breakout signals expanding volatility — often a precursor to a sharp directional move.
MACD at 8.33, CCI at 203.06, and Stochastic at 96.91 collectively point to short-term strength, while VWAP at 1427.77 serves as immediate support.
This confluence of volume + structure + volatility aligns perfectly for a potential breakout continuation.
________________________________________
📈 Price Action & Key Levels
The stock has been moving within a base range of ₹1342.6 – ₹1500, and has now approached the upper resistance band.
Immediate Resistance: 1447 / 1458 / 1476
Immediate Support: 1418 / 1400 / 1390
VWAP: 1427.77
A sustained close above 1439.60–1440 can confirm a bullish breakout, with upside potential toward 1466.30 → 1500 zone.
________________________________________
🧭 STWP Trade Analysis
Bias: Bullish
Breakout Level: Above 1439.60
Intraday Support: 1428
Swing Support: 1384
Intermediate Support: 1342
Momentum: Moderate
Trend: Bullish
Risk: Low
Volume: High
📌 Observation: The candle structure suggests a “volume-backed breakout” that may see short-term profit-booking near 1447 but remains structurally bullish if above VWAP.
________________________________________
🧾 Quick View: Q2 FY26 Results Snapshot
ICICI Bank reported a 5% YoY rise in PAT to ₹12,359 crore, supported by a 7.4% rise in Net Interest Income (₹21,529 crore) and improved asset quality.
Lower provisions and healthy loan growth kept the bottom line stable, while core operating profit rose 6.5% YoY.
With a clean balance sheet and improving credit metrics, the results complement the ongoing bullish technical setup — reinforcing confidence in trend continuation.
________________________________________
🧩 Final Outlook
ICICI Bank exhibits bullish momentum with low-risk positioning.
The current move represents a technical + fundamental confluence breakout, supported by strong volumes and improving financial health.
Traders may watch for price action near 1439–1447 zone for confirmation and potential swing continuation toward ₹1500 in the coming sessions.
________________________________________
🧠 Learning Note (Educational Purpose)
This setup perfectly demonstrates how volume expansion + momentum oscillator alignment + earnings strength often precedes meaningful breakouts in large-cap banking stocks.
Always track VWAP & RSI stability post-breakout — they often determine whether the move sustains or fades.
________________________________________
⚠️ Disclosure & Disclaimer (SEBI-Compliant)
This content is created solely for educational and informational purposes to help readers understand technical analysis and market structure.
It does not constitute investment advice, research recommendation, or a solicitation to buy or sell any security.
The author is not a SEBI-registered investment adviser or research analyst.
All charts, patterns, and levels are based on personal study and historical data available from public sources such as TradingView and NSE India.
Position Status: No active position in ICICIBANK at the time of publication.
Trading and investing involve risk. Market movements can be unpredictable, and losses may exceed invested capital.
Readers are strongly advised to consult a SEBI-registered investment adviser before making any trading or investment decisions.
By engaging with this post, you acknowledge that you take full responsibility for your own trades, decisions, and outcomes.
________________________________________
💬 Found this useful?
🔼 Boost this post to support structured learning content.
✍️ Share your thoughts, questions, or observations — let’s grow together!
🔁 Share with learners and traders to promote responsible market education.
👉 “If you liked this breakdown, follow for more disciplined, educational trade setups.”
🚀 Stay Calm. Stay Clean. Trade With Patience.
Trade Smart | Learn Zones | Be Self-Reliant 📊

Importance of Understanding Market Fundamentals1. Definition of Market Fundamentals
Market fundamentals refer to the core economic, financial, and quantitative factors that influence the price and value of financial instruments. In equities, fundamentals typically include revenue, earnings, debt levels, and management quality. In commodities, supply and demand dynamics, production costs, geopolitical events, and seasonal trends play a pivotal role. For currencies, factors like interest rates, inflation, trade balances, and central bank policies dominate price behavior. Understanding these elements provides insight into why prices move in a certain direction and helps participants make informed decisions rather than relying solely on market sentiment or speculation.
2. Informed Investment Decisions
Investing without understanding market fundamentals is akin to navigating a stormy sea without a compass. Fundamentals provide the analytical foundation for evaluating the intrinsic value of an asset. For example, in equity markets, price-to-earnings (P/E) ratios, return on equity (ROE), and earnings growth rates help investors assess whether a stock is overvalued or undervalued. Similarly, commodity traders examine production data, inventory levels, and global consumption patterns to gauge potential price trends. By relying on fundamentals, investors can make decisions grounded in logic and data, rather than reacting impulsively to short-term price fluctuations.
3. Risk Management and Protection Against Volatility
Financial markets are inherently volatile, and prices can swing dramatically due to economic, political, or social developments. Understanding market fundamentals helps participants anticipate potential risks and adopt strategies to mitigate them. For instance, if an investor recognizes that rising interest rates may depress stock valuations, they can adjust their portfolio allocation to minimize losses. In commodities, awareness of seasonal production cycles and geopolitical risks can prevent exposure to adverse price movements. A strong grasp of fundamentals enables participants to develop contingency plans, hedge their positions, and navigate uncertainty with confidence.
4. Long-Term Investment Strategy
While technical analysis can be effective for short-term trading, long-term investing heavily relies on fundamentals. Investors focused on building wealth over years or decades benefit from understanding the underlying economic health of a company, sector, or country. For example, an investor considering an emerging market must evaluate GDP growth, political stability, inflation trends, and currency strength to make a prudent decision. Fundamental analysis allows investors to identify undervalued assets with growth potential, which can outperform the market over the long run. In essence, understanding fundamentals aligns investment choices with sustainable economic realities rather than temporary market hype.
5. Understanding Market Cycles
Markets operate in cycles influenced by macroeconomic factors such as inflation, interest rates, employment levels, and consumer sentiment. Recognizing these cycles is crucial for effective timing and strategy. For instance, during an economic expansion, stocks and commodities typically rise due to increased demand and corporate profitability. Conversely, during recessions, defensive assets like bonds, gold, or utilities may outperform. By analyzing market fundamentals, participants can anticipate cyclical patterns, position their portfolios accordingly, and capitalize on opportunities while minimizing losses during downturns.
6. Identification of Investment Opportunities
Market fundamentals serve as a powerful tool for spotting profitable opportunities. By studying supply-demand dynamics, global economic trends, and sector-specific developments, investors can identify assets poised for growth. For example, a surge in electric vehicle adoption can signal increased demand for lithium and cobalt, guiding commodity investors toward related markets. Similarly, technological innovation in healthcare or AI may indicate potential winners in the stock market. Without an understanding of these fundamentals, such opportunities may go unnoticed or be exploited poorly, leading to suboptimal returns.
7. Behavioral Discipline and Emotional Control
Emotions such as fear and greed often drive irrational decision-making in financial markets. Market participants frequently react impulsively to price volatility, rumors, or news headlines. A strong grasp of fundamentals instills discipline by providing a rational framework for evaluating opportunities and risks. When an investor understands the intrinsic value of an asset, they are less likely to panic during market dips or chase overpriced securities during rallies. This emotional control is critical for consistent performance and long-term success in the markets.
8. Adapting to Global Economic Trends
In today’s interconnected world, local markets are influenced by global events. Trade policies, geopolitical tensions, currency fluctuations, and international interest rates can affect asset prices worldwide. Understanding market fundamentals enables participants to interpret these global trends and adjust strategies accordingly. For instance, a rise in crude oil prices due to Middle Eastern tensions may impact not only energy companies but also sectors dependent on transportation or manufacturing. Traders and investors who comprehend these linkages can position themselves advantageously in response to global developments.
9. Enhanced Analytical Skills
Studying market fundamentals cultivates analytical thinking and critical reasoning. Investors learn to interpret financial statements, macroeconomic reports, and industry data to form actionable insights. These skills are transferable across different asset classes and markets, allowing participants to adapt to evolving financial landscapes. Furthermore, the ability to analyze fundamentals objectively reduces reliance on hearsay or speculative tips, empowering investors to take responsibility for their decisions.
10. Foundation for Technical Analysis
While technical analysis focuses on price patterns and market psychology, it becomes far more effective when combined with fundamental understanding. Knowledge of the underlying factors driving price movements provides context to technical signals. For example, a breakout in a stock chart may be more meaningful if supported by strong earnings growth or favorable industry trends. Conversely, ignoring fundamentals may lead to misinterpretation of technical patterns and result in costly mistakes. Integrating fundamental and technical analysis creates a holistic approach that maximizes the likelihood of successful trades.
11. Navigating Uncertainty and Market Crises
Markets are often affected by unexpected events such as financial crises, political upheavals, natural disasters, or pandemics. During such periods, prices may deviate significantly from historical norms. Investors who understand market fundamentals can differentiate between short-term shocks and long-term value, preventing panic-induced decisions. For instance, during the 2008 financial crisis, those who focused on the fundamental health of companies were able to identify undervalued stocks and make profitable investments while others succumbed to fear-driven selling.
12. Practical Applications Across Asset Classes
Understanding market fundamentals is not limited to stocks; it applies across all asset classes. In commodities, evaluating production, storage, consumption, and weather patterns is essential. In forex markets, analyzing interest rate differentials, inflation trends, and trade balances informs currency valuation. In bonds, credit ratings, yield curves, and monetary policies determine risk and return. Real estate investors consider macroeconomic growth, demographic trends, and regulatory policies. Across all these sectors, fundamental analysis forms the backbone of strategic decision-making, highlighting its universal importance.
13. Contributing to Financial Literacy
Finally, mastering market fundamentals contributes to broader financial literacy. Individuals become better equipped to understand economic news, corporate reports, and investment opportunities. This knowledge promotes responsible financial behavior, enabling informed decision-making in personal finance, retirement planning, and wealth management. Beyond individual benefits, widespread financial literacy fosters a more efficient and stable market, as participants base decisions on informed analysis rather than speculation and rumor.
Conclusion
In conclusion, understanding market fundamentals is indispensable for anyone participating in financial markets. It equips investors and traders with the knowledge to make informed decisions, manage risk, and develop long-term strategies. Fundamentals provide a lens to interpret market cycles, identify investment opportunities, and maintain discipline amid volatility. Moreover, they enhance analytical skills, facilitate integration with technical analysis, and enable navigation through global economic trends and crises. Across all asset classes, a deep comprehension of market fundamentals is the foundation upon which sustainable financial success is built. Ignoring these principles leaves participants vulnerable to speculation, emotional decision-making, and missed opportunities, whereas mastery of fundamentals fosters confidence, prudence, and consistent performance in the ever-evolving world of financial markets.
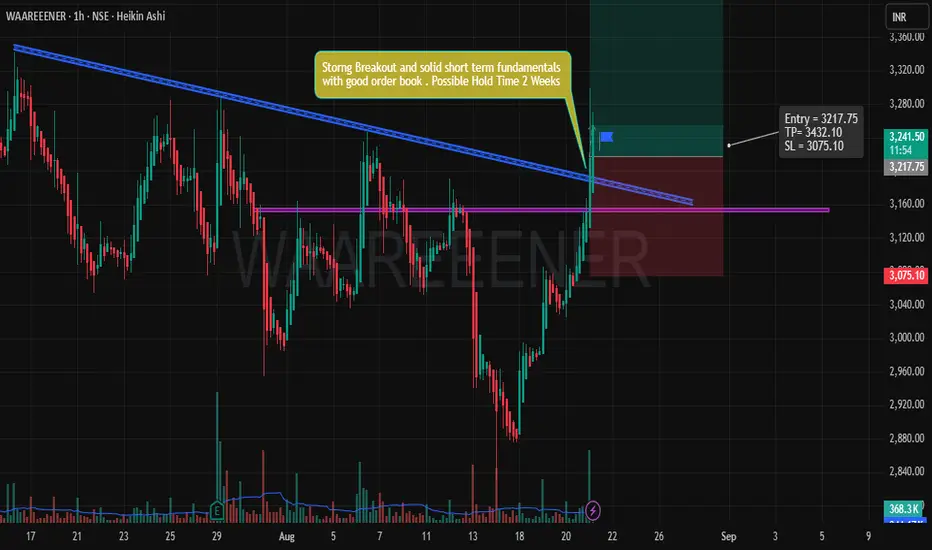
Trade Idea: Bullish Breakout for WAAREEENER (NSE)** IF you like my observation, please boost and follow for more content."
Trade Overview:
Instrument: WAAREEENER
Timeframe: 1-hour chart
Trade Type: Bullish Breakout
Entry Price: ₹3217.75
Stop Loss: ₹3075.10
Take Profit (TP): ₹3432.10
Target Duration: Possible hold time of 2 weeks.
1. Technical Analysis:
Breakout from Resistance:
The price action has shown a clear breakout from the resistance zone, depicted by the purple horizontal line at ₹3120. The breakout was supported by increasing volume, which is an important confirmation of strength in the upward movement. A breakout above this level suggests strong bullish momentum.
Strong Fundamentals:
This breakout is not just a technical move; there are solid short-term fundamentals backing this position. The order book is healthy, indicating strong buying interest at higher levels. Additionally, the current market sentiment seems to favor growth, which aligns well with the price action.
Trend Confirmation:
We’re witnessing a bullish trend confirmation. The current price movement is above the previous highs, which suggests further upward potential. The chart indicates the start of a trend that could continue for the next few weeks, aligning with the projected hold time of 2 weeks.
2. Risk-Reward Setup:
Risk:
The trade is managed with a reasonable stop loss of ₹3075.10. This is placed below the recent low, where the price seems to find support. A stop loss at this level helps protect from large losses in case the breakout fails.
Reward:
The potential reward is set at ₹3432.10, which is well above the breakout level. This level corresponds to a key resistance, and reaching it would offer a solid profit potential. The risk-to-reward ratio of this trade is favorable, providing a good opportunity for risk management.
3. Volume Confirmation:
Volume has been increasing as the price moves higher. This is a strong signal of institutional buying or significant market interest, which further strengthens the case for this breakout to hold and reach the take profit levels.
4. Conclusion:
This is a solid bullish setup based on the breakout above the resistance, accompanied by increasing volume, healthy market sentiment, and strong short-term fundamentals. The risk-reward ratio supports this trade idea, and the target of ₹3432.10 offers a clear upside.
Important Notes:
The trade might be subject to market fluctuations; therefore, ensure to monitor the price action closely.
If the price re-enters the resistance zone or shows signs of weakening, consider adjusting the stop loss or exit strategy accordingly.
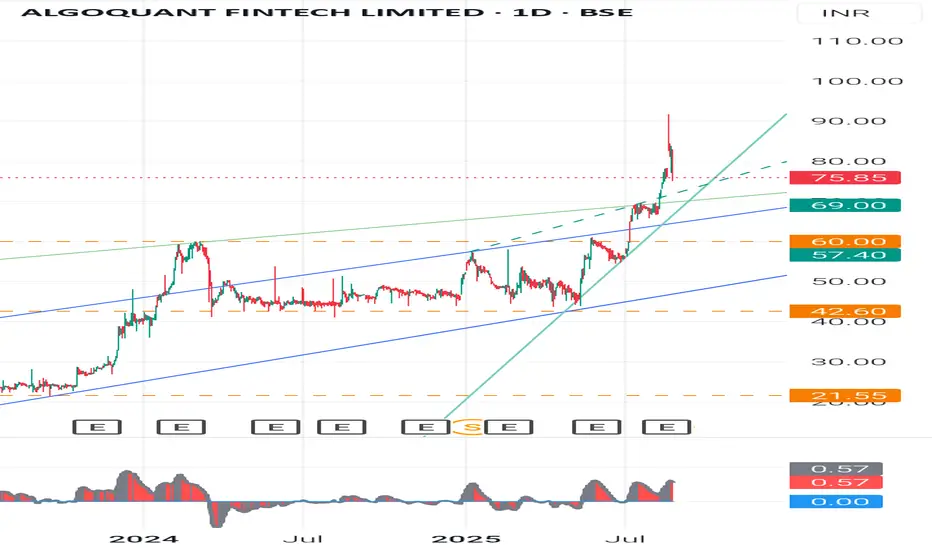
Stock Analysis - chart pattern analysis & fundamepinchStock Analysis - step by step for Algoquant Fintech Ltd.
Chart & Price Action Analysis (Weekly Chart)-:
-Current Price: 78.95 (-3.84%)
+Recent Move: Stock gave a strong breakout above its long consolidation channel ( 42- 69).
-Candlestick: The latest candle is a long wick candle after a strong breakout - This signals profit booking after a sharp rally.
- Support Levels
69 - Recent breakout retest zone
60 - Strong support from previous swing highs
42.6 - Major base support (long-term)
- Resistance Levels
85- 88 - Immediate resistance (due to long upper wick supply)
100+ - Psychological round level
120 - Next major target if momentum sustains
🕯️ Candlestick & Swing Analysis
Pattern: Breakout candle with long wick - suggests short-term profit booking, but trend remains positive.
Swing Trend: Stock formed higher highs & higher lows since mid-2023, a sign of strong uptrend.
Risk: If it falls below 69 on weekly closing, trend may weaken.
- Fundamental Comparison (with Fintech peers like Infibeam Avenues, IndiaMart, and small fintech players)
Metric Algoquant Fintech Infibeam Avenues IndiaMart Intermesh
P/E Ratio Very High (Loss-making / low EPS stage) -38x -45x
Revenue Growth Very high (small base effect) Moderate Stable
Debt Low Low Very Low
Business Stage Emerging (High growth, high risk) Mid-sized, stable Established, B2B stronghold
👉 Learning: Algoquant is in an early stage compared to peers - higher growth potential but also higher risk.
📘 Basic Learnings for Students (Investment Education)
1. Candlestick Learning - Long upper wicks after breakout = profit booking - watch for retest of breakout levels.
2. Swing Analysis - Trend is up as long as higher highs-higher lows structure is maintained.
3. Chart Pattern - Breakout from long channel = momentum can continue if volumes sustain.
4. Fundamental Insight - Always compare with industry peers on P/E, revenue growth, debt, margins.
5. Risk Management - In emerging companies, volatility is high. Always keep a stop-loss.
⚠️ Disclaimer
This analysis is for educational purposes only. It is not investment advice. Stock markets are subject to risks. Please do your own research (DYOR) or consult a SEBI-registered advisor before investing.
#Algoquant #FintechStocks #StockMarketIndia #TechnicalAnalysis #CandlestickPatterns #SwingTrading #InvestingForBeginners #FundamentalAnalysis #StockMarketEducation #DYOR
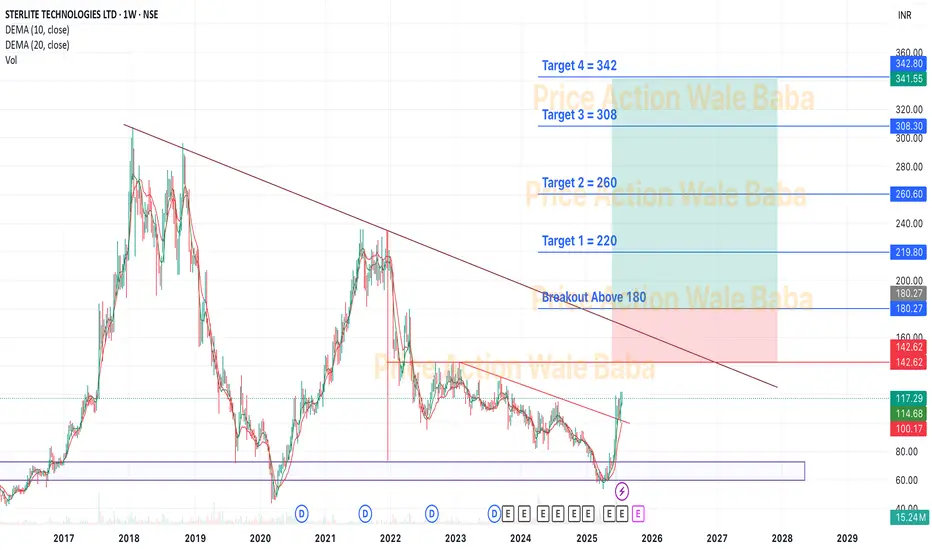
Sterlite Technologies Ltd - Near Breakout.Sterlite Technologies Limited was established in July 2001 after the demerger of the telecom division of Sterlite Industries Ltd (SIL). In July 2006, STL acquired the transmission line business of SIL to foray into the power transmission cables business. STL has grown over the years to become the largest Optical Fiber and Optical Fiber Cables manufacturer in the country. The company also has sizeable presence in the overseas markets with an established presence in the global optical fiber market.
The company’s global ex-China Optical Fiber Cables (OFC) market share was 8% in FY24 vs 12% in FY23. It is among the largest and lowest-cost producers of Optical Fibre and OFC in India because of extensive backward integration.
Order Book
As of Q4 FY24, the company's order book stood at Rs. ~10,200 Cr vs Rs. ~9,800 Cr in Q3 FY24.
Telcos: 59%
Citizen Networks: 22%
Enterprises: 19%.
Optical Connectivity portfolio in US
On 29 July 24, the company announce the expansion of its Optical Networking capability with the addition of its Optical Connectivity portfolio in the US market.
Market Cap: ₹ 5,723 Cr.
Promoter holding: 44.4 %
FII holding: 6.74 %
DII holding: 11.3 %
Public holding: 37.5 %
Debt: ₹ 1,926 Cr.
Debt 3 Years back: ₹ 3,475 Cr.
Note: Debt is decreasing
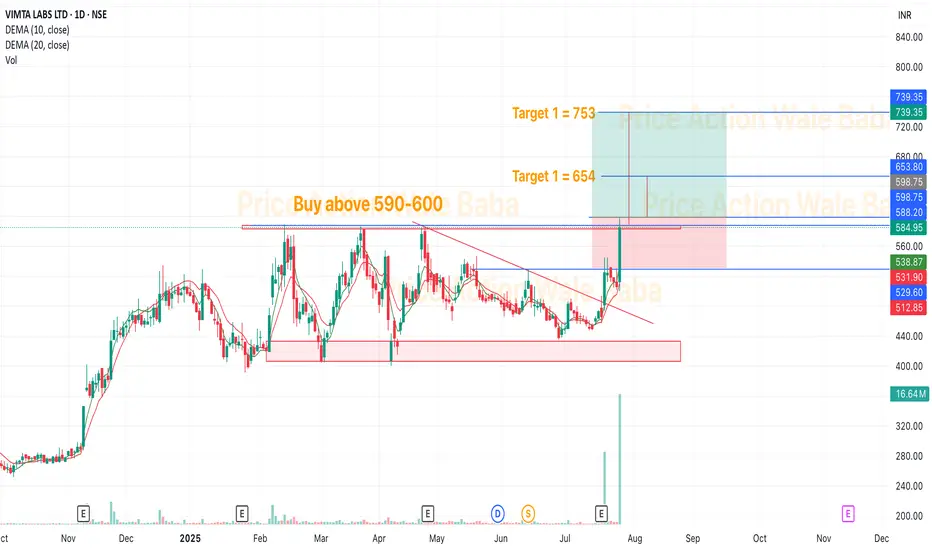
Vimta LabsVimta Labs
VLL is is in the business of contract research and testing in the fields of biologics, small molecules, agro -chemicals, food & beverages, electronics, clinical diagnostics, medical devices, home and personal care products, and environment testing
On July 12th 2024, company approved the scheme of amalgamation of its Wholly Owned Subsidiary company viz. Emtac Laboratories Pvt. Ltd. with the Holding Company
Market Cap: ₹ 2,603 Cr.
Promoter holding: 36.7 %
FII holding: 3.49 %
DII holding: 1.42 %
Public holding: 58.4 %
Debt: ₹ 8.52 Cr.
Debt 3Years back: ₹ 19.0 Cr.
Looks good to buy and hold for the given Targets.
G G Automotive Gears Ltd One-Page Equity ResearchInvestment Thesis – BUY | Target Price ₹300 | Upside ~24%
India’s only listed pure-play traction–gear specialist with 50-year pedigree and >500 OE customers
Rail & Metro orders at record high; Indian Railways raising locomotive build plan by 27% for FY26, driving multi-year volume visibility
Successful diversification into wind-energy, mining & industrial forgings lowers cyclicality and lifts blended margins
Balance-sheet repair complete; net-debt / equity down to 0.53× vs 1.52× in FY23
Snapshot (Standalone)
CommentRevenue (₹ Cr)95.377.336%
EBITDA Margin12.7%10.0%
PAT (₹ Cr)4.431.9497%
EPS (₹)5.322.4544%
ROCE14.9%8.2%
P/E (TTM)26.5×
Market Cap₹ 241 C
Valuation & Target
We apply 32× FY26E EPS (₹9.4) – a 30% discount to peer Elecon (45×) to reflect smaller scale but superior growth trajectory.
Derived Target Price ₹300 (prior ₹241 close), implying 24% upside plus optionality from export traction gears.
Key Catalysts
Indian Railways 100% electrification → higher demand for reduction gearboxes
Metro build-out (20+ cities) – first export order executed FY24 proves capability
Unit-III & IV capacity added FY24 (+30k sq ft) unlocks 35% volume expansion without major capex
Potential government PLI scheme for rail components may grant 6% incentive on sales (not in model).
Risks to Thesis
Lumpy order inflow from Railways could stretch working capital
Alloy-steel price spikes may compress gross margin; 65% raw-material cost is steel
Customer concentration: top-three PSU units >55% of revenue
Small free float → liquidity risk in sharp market Initiate BUY with ₹300 target; accumulate on dips toward ₹220. Recommend watch on quarterly order-book disclosures for traction confirmation.

GBP/JPY 4H Chart Analysis – Bullish Channel Setup📈 Trend:
Price is moving in an ascending channel
🔵 Support line below
🔴 Resistance line above
---
Key Zones & Levels:
📍 Demand Zone (Buy Area):
Between 191.753 – 194.016
Price might bounce here before continuing up
🔵 Likely pullback expected here
🎯 Target Point:
202.500
🚀 If price respects the demand zone, this is the upside target
🟢 Entry Point:
Around 193.964 – 194.016
Optimal buying zone before the projected rise
❌ Stop Loss:
Below 191.700
🛑 Placed to minimize losses if price breaks down
---
Indicators:
📉 EMA (70):
Currently at 192.816
✅ Acting as dynamic support
---
Trade Plan Summary:
🔄 Wait for a retracement into the Demand Zone
🛒 Enter long near 193.964
⛔ Stop loss at 191.700
🎯 Target at 202.500

Astral - Looks good to buy at bottomAstral Poly Technik Ltd was established in 1996, with the aim to manufacture pro-India plumbing and drainage systems in the country. It has also forayed into adhesive business over years.
Market Cap: ₹ 36,884 Cr.
Promoter holding: 54.1 %
FII holding: 20.2 %
DII holding:14.6 %
Public holding: 11.0 %
Fundamentals are good. Near breakout level and good to hold for the next 6 months.

Database Trading Part 3
InfluxDB is a high-performance, purpose-built time-series database designed for real-time analytics. It boasts low-latency writes, efficient storage, and a powerful query engine tailored for event-driven systems like algorithmic trading

EUR/USD 1H Trade Setup: Bullish Breakout in PlayCurrent Setup:
Price: 1.15083
EMA (7): 1.15164 (acting as dynamic support)
Trend: Bullish momentum forming.
Entry Zone
RBR Zone (Rally-Base-Rally)
🔵 Entry Point: 1.14958
🟦 Demand zone indicates bullish interest
📍 This is where buyers previously stepped in
Stop Loss Zone
🔻 Stop Loss: 1.14420
❗ Placed below the base of the RBR zone
🛡️ Protects against false breakouts.
Resistance Zone
🔴 Resistance: Around 1.15500
⚠️ Sellers may push back here
⏳ Waiting for a breakout confirmation.
Target Zone
🎯 Target Point: 1.17000
🚀 Bullish breakout goal
✅ Previous resistance level & profit zone.
Visual Trade Plan Summary:
🔽 Entry: 1.14958
❌ Stop Loss: 1.14420
✅ Take Profit: 1.17000
Quick Dotted Recap:
* Entry at demand zone 🔵
* Tight stop loss for risk control 🔻
* Bullish bias with upside potential 🚀
* Wait for candle close above resistance 🔴 before entering aggressively

More About RSIRSI is a tool that aids traders in capturing market momentum by measuring the fluctuation in prices. Traders rely on RSI to spot oversold and overbought markets and determine the right time to enter a trade. RSI helps traders identify whether a stock is either overbought or oversold.

Explanation of RSIRSI is a tool that aids traders in capturing market momentum by measuring the fluctuation in prices. Traders rely on RSI to spot oversold and overbought markets and determine the right time to enter a trade. RSI helps traders identify whether a stock is either overbought or oversold.

Bitcoin Trade Setup: Bullish Breakout Targeting $87K!🔹 Key Levels Identified:
📌 Target Point: 87,008.21 USD 🏁🔵
👉 Expected price move (+9.07%) 🚀
📌 Entry Point: 79,719.00 USD ✅
👉 Suggested buying level in demand zone 🏦
📌 Stop Loss: 78,213.25 USD ❌🔻
👉 Risk management level 📉
📊 Technical Analysis:
📈 Trendline Support:
🔵 The price bounced off the trendline 📊, confirming an uptrend 📈
🔵 Demand Zone:
🟦 Marked blue area = Buyer interest 📊
💰 Expected reversal zone if price retests
📊 Moving Average (DEMA 9):
🔸 82,343.85 USD (current level)
🔺 Price slightly below DEMA ➝ possible bullish reversal 🚀
⚡ Trade Setup:
✔️ Risk-to-Reward Ratio:
🟢 Potential profit: +7,220.76 USD
🔴 Risk: -1,500 USD
📊 Favorable trade setup with high reward vs low risk ✅
✔️ Momentum Confirmation:
🟢 Above 79,719 USD = 🚀 Bullish breakout
🔴 Below 78,213.25 USD = ❌ Stop Loss triggered
🔮 Conclusion:
🔥 Bullish setup if price holds demand zone!
🚀 Target: 87,008 USD
⚠️ Manage risk with stop loss! 📉

Option and Database tradingOptions data providers collect specific data points that can later be used to determine price movements over time. These price changes in the stock market help investors and brokers decide which stocks might be ideal to sell or buy given current market conditions.

Option Chain TradingAn option chain is a comprehensive listing of all available option contracts for a specific underlying asset, typically organized by expiration date and strike price. It provides a detailed view of call and put options, their premiums, and other relevant information like bid/ask prices, volume, and open interest. This tool is crucial for options traders to analyze market conditions, identify potential trading opportunities, and choose the right options contracts based on their investment strategy.

Candlesticks Pattern Candlestick patterns are graphical representations of price movements used in technical analysis to identify potential future price trends and reversals, based on the open, high, low, and close (OHLC) prices of a security over a specific period.

ADX ExpalanationThe Average Directional Index (ADX) is a technical analysis tool used to measure the strength of a trend, regardless of its direction, helping traders assess market momentum and make informed decisions.
