Possible Decline Toward 113 on T-Bond FuturesAccording to my analysis on the daily chart of T-Bond futures, there is a high probability of a decline toward the 113 level in the coming days.
This bearish outlook is supported by two main technical elements:
-A clear Head and Shoulders reversal pattern, indicating a potential trend change.
-A confirmed breakout, as highlighted on the chart, which strengthens the likelihood of further downward movement.
Futurestrading

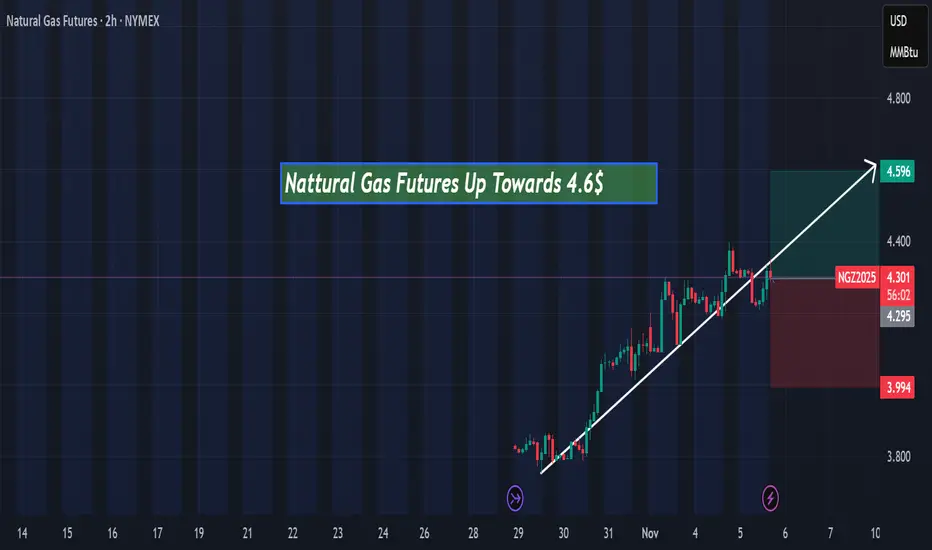
Natural Gas Futures Up towards 4.6$Hi everyone, today Natural Gas Futures is expected to rise toward $4.60 in the next few hours according to my technical analysis.
Real Knowledge of MarketCore Foundational Knowledge
Derivatives Basics: Options are derivative contracts, meaning their value is derived from an underlying asset (stocks, indices, commodities, etc.).
Key Terminology: A trader must be fluent in terms like call options (right to buy), put options (right to sell), strike price, premium, expiration date, intrinsic value, and time value.
Rights vs. Obligations: Understanding that option buyers have the right, but not the obligation, to exercise, while option sellers (writers) have the obligation if exercised, is fundamental to risk assessment.
Leverage: Options offer significant leverage, meaning a small amount of capital can control a large position in the underlying asset, which amplifies both potential profits and losses.

“Nifty 50 Intraday Key Levels | Buy & Sell Zones 31th Oct 2025”Want to learn more? Like this post and follow me!”
26240🔴 Above 10m closing Shot Cover Level
Strong resistance — short covering likely above this.
26080🟠 Below 10m hold PE By level /
Above 10m hold CE by level
25980🟣 Above 10M hold positive trade view
Below 10M hold negative trade view
Sentiment deciding level — crucial for trend direction.
25818⚫ Above Opening S1 10m Hold CE By level
Bullish entry level — CE hold area.
25690🟠 Below Opening R1 10m Hold PE By level
Below 10m hold PE By Risky Zone Weak zone — PE may strengthen below this.
25490🟢 Above 10M hold CE By Safe Zone level
Safe bullish zone — CE can be held confidently above.
25470🔵 BELOW 10M hold UNWINDING level
Breakdown zone — unwinding or heavy selling possible below.

“Nifty 50 Intraday Key Levels | Buy & Sell Zones 29th Oct 2025”“Want to learn more? Like this post and follow me!”
26233🔴 Above 10m closing Shot Cover Level
Strong resistance — short covering likely above this.
26138🟠 Below 10m hold PE By level /
Above 10m hold CE by level
26028🟣 Above 10M hold positive trade view
Below 10M hold negative trade view
Sentiment deciding level — crucial for trend direction.
25913⚫ Above Opening S1 10m Hold CE By level
Bullish entry level — CE hold area.
25828🟠 Below Opening R1 10m Hold PE By level
Below 10m hold PE By Risky Zone Weak zone — PE may strengthen below this.
25690🟢 Above 10M hold CE By Safe Zone level
Safe bullish zone — CE can be held confidently above.
25670🔵 BELOW 10M hold UNWINDING level
Breakdown zone — unwinding or heavy selling possible below.

“Nifty 50 Intraday Key Levels | Buy & Sell Zones 17th Oct 2025”“Want to learn more? Like this post and follow me!”
25832 🔴 Above 10m closing Shot Cover Level
Strong resistance — short covering likely above this.
25720 🟠 Below 10m hold PE By level /
Above 10m hold CE by level
25623 🟣 Above 10M hold positive trade view
Below 10M hold negative trade view
Sentiment deciding level — crucial for trend direction.
25523 ⚫ Above Opening S1 10m Hold CE By level
Bullish entry level — CE hold area.
25433 🟠 Below Opening R1 10m Hold PE By level
Below 10m hold PE By Risky Zone Weak zone — PE may strengthen below this.
25327 🟢 Above 10M hold CE By Safe Zone level
Safe bullish zone — CE can be held confidently above.
25318 🔵 BELOW 10M hold UNWINDING level
Breakdown zone — unwinding or heavy selling possible below.

“Nifty 50 Intraday Key Levels | Buy & Sell Zones 16th Oct 2025”“Want to learn more? Like this post and follow me!”
25580 🔴 Above 10m closing Shot Cover Level
Strong resistance — short covering likely above this.
25433 🟠 Below 10m hold PE By level /
Above 10m hold CE by level
25370 🟣 Above 10M hold positive trade view
Below 10M hold negative trade view
Sentiment deciding level — crucial for trend direction.
25280 ⚫ Above Opening S1 10m Hold CE By level
Bullish entry level — CE hold area.
25170 🟠 Below Opening R1 10m Hold PE By level
Below 10m hold PE By Risky Zone Weak zone — PE may strengthen below this.
24990🟢 Above 10M hold CE By Safe Zone level
Safe bullish zone — CE can be held confidently above.
24980🔵 BELOW 10M hold UNWINDING level
Breakdown zone — unwinding or heavy selling possible below.

“Nifty 50 Intraday Key Levels | Buy & Sell Zones 9th Oct 2025”“Want to learn more? Like this post and follow me!”
25278🔴 Above 10m closing Shot Cover Level
Strong resistance — short covering likely above this.
25178🟠 Below 10m hold PE By level /
Above 10m hold CE by level
25078🟣 Above 10M hold positive trade view
Below 10M hold negative trade view
Sentiment deciding level — crucial for trend direction.
24980⚫ Above Opening S1 10m Hold CE By level
Bullish entry level — CE hold area.
24890🟠 Below Opening R1 10m Hold PE By level
Below 10m hold PE By Risky Zone Weak zone — PE may strengthen below this.
24780🟢 Above 10M hold CE By Safe Zone level
Safe bullish zone — CE can be held confidently above.
24,770 🔵 BELOW 10M hold UNWINDING level
Breakdown zone — unwinding or heavy selling possible below.

“Nifty 50 Intraday Key Levels | Buy & Sell Zones” 3rd Oct 2025“Want to learn more? Like this post and follow me!”
25,073 → Above 10m closing Shot Cover Level
25,070 → Below 10m hold PE By Safe Zone
24,988 → Above 10m hold CE By Entry Level
24,980 → Below 10m hold PE By Risky Zone
24,888 → Above 10m hold Positive Trade View
24,790 → Above Opening S1 hold CE / Below Opening R1 hold PE
24,690 → Above 10m hold CE By Level / Below 10m hold PE By Level
24,590 → Above 10m hold CE By Safe Zone
24,580 → Below 10m hold Unwinding Level

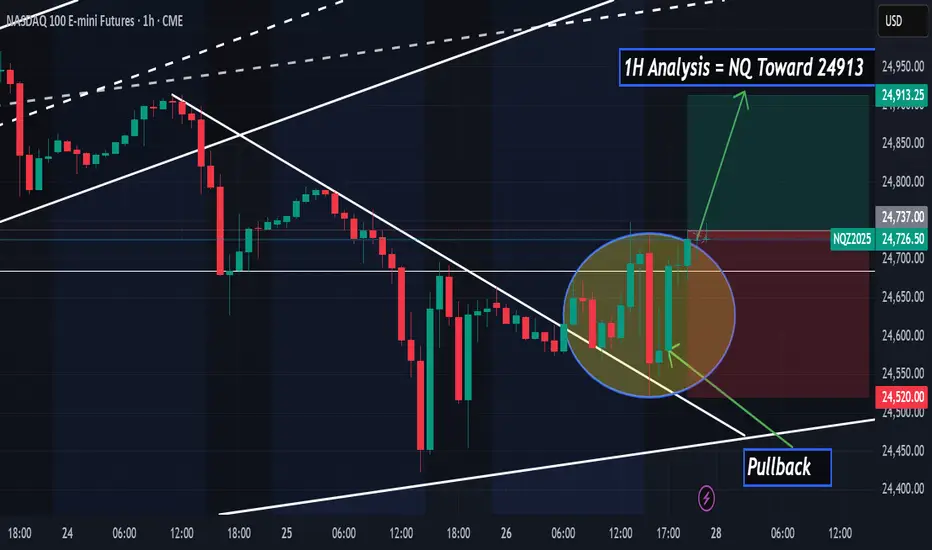
Bullish Opportunity on Nasdaq 100hello,
On the 1-hour chart, the Nasdaq 100 shows a pullback to the trendline, suggesting a high-probability buying opportunity.
Ibrouri Abdessamad
“Nifty 50 Key Levels & Trade Zones – 30th Sept 2025”
“Follow me and like this post for more learning tips!”
Key Levels from the Chart
24,890 – Above 10M Closing Shot Cover Level
24,820 –Above 10M Hold CE by Entry Level
Below 10M Hold PE by Risky Zone
24,722 –Above 10M Hold Positive Trade View
Below 10M Hold Negative Trade View
24,590 –Above Opening S1 10M Hold CE by Level
Below Opening R1 10M Hold PE by Level
24,470 –Above 10M Hold CE by Level
Below 10M Hold PE by Level
24,370 –Above 10M Hold CE by Safe Zone Level
Below 10M Hold Unwinding Level

Silver - Trade PlanCritical levels marked for a potential long setup.
Keep an eye on these zones for a possible entry.
Trade safe, manage risk.

From a correction to a potential impulse on Bitcoin.Bitcoin has corrected significantly after making all time highs and is not coming into a high probability Demand Zone on the higher time frames. I expect to see a potential bounce in Bitcoin from the marked Demand Zone on the chart

Gold, Silver & Commodity Trading (MCX)What is MCX (Multi Commodity Exchange)?
The Multi Commodity Exchange of India Ltd. (MCX) is a government-regulated commodity derivatives exchange, launched in 2003. It is regulated by SEBI (Securities and Exchange Board of India) and allows traders to buy and sell commodity futures contracts across various categories like:
Bullion: Gold, Silver
Energy: Crude oil, Natural gas
Base Metals: Copper, Zinc, Lead, Aluminum, Nickel
Agricultural commodities: Cotton, Cardamom, Mentha Oil
MCX operates similarly to stock exchanges like NSE or BSE but deals in commodity contracts rather than equities.
Factors That Influence Gold & Silver Prices
Understanding price drivers helps traders anticipate market movement:
🏦 1. Global Economic Conditions
Inflation
Recession fears
GDP data
🪙 2. Currency Movements
Gold is priced in USD globally. The USD-INR exchange rate significantly impacts domestic prices.
📉 3. Interest Rates
Rising interest rates make non-yielding assets like gold less attractive, pushing prices lower, and vice versa.
💥 4. Geopolitical Tensions
War, political instability, or crisis (Middle East conflict, Ukraine war, etc.) often boost gold/silver prices.
🛢️ 5. Crude Oil Prices
High oil prices can lead to inflation, making gold more attractive as a hedge.
💼 6. Central Bank Policies
Actions by RBI or Federal Reserve (US) in terms of gold reserves, rate hikes, or monetary policy changes affect sentiment.
Nifty 50 Intraday Plan for July 23, 2025📌 For more insights & live explanations,
👉 Visit my YouTube channel – Click the icon above ☝️
🔺 Bullish Zones (Call Side - CE):
25,138 – Positive Trade View Start
If the market sustains above this level for 10 minutes, the sentiment turns positive.
Possible intraday up-move.
Look for CE entries.
25,260 – CE Entry Level
Strong confirmation of bullish breakout.
Entry point for aggressive CE buyers.
25,380 – Short Covering Zone
If price closes above this, short-sellers may exit in panic.
Expect a sharp up-move / breakout.
24,960 & 25,040 – CE Hold Zones
If holding CE positions, monitor these levels.
Supportive price areas where bulls may defend.
24,760 – Safe CE Zone
A very strong support zone.
If price bounces from here, good for fresh CE trades.
🔻 Bearish Zones (Put Side - PE):
25,120 – Negative Trade View
If price breaks this level and stays below 10 mins, bias turns bearish.
25,018 – Opening R1 PE Hold
Below this, market may gain bearish strength.
Short trades may get active.
24,938 – PE Hold Level
Important support zone.
Break here can give aggressive PE momentum.
24,700 – Unwinding Level
If price sustains below this, it can trigger long unwinding.
Strong bearish continuation expected.

Nifty 50 Intraday Plan for July 22, 2025🔼 Bullish Levels (Call Side - CE):
Above 25,038 : If the market opens and sustains above this level for 10 minutes, you can consider buying CE. This is the first breakout point, indicating possible upward movement.
Above 25,128: Holding above this level indicates a positive trade view. Momentum is expected to increase, and buyers may become more aggressive. Good zone to initiate or add to CE positions.
Above 25,260 : This is the CE entry level where breakout confirmation happens. If price reaches and sustains this zone, it signals strong bullish strength.
Above 25,380 : This is marked as the short-covering zone. If the price reaches here, it means many short traders may exit, creating a spike. Ideal for booking profits on CE trades.
🔽 Bearish Levels (Put Side - PE):
Below 25,038 : If the price fails to sustain above this level and breaks down with 10-minute candle confirmation, it indicates weakness. PE trades can be considered from here.
Below 24,938 : This level is a clear PE entry level. Sustained trading below this suggests downward continuation.
Below 24,920 : This is the risky PE zone. If the market trades here, PE positions should be handled with caution unless strong selling pressure is seen.
Below 24,800 : This is a safe PE zone. Breakdown below this signals confirmed bearish sentiment, and you can aggressively hold PE options.
Below 24,780 : This is the unwinding level, meaning big players may start exiting their positions, possibly triggering sharp declines. Ideal for booking PE profits or trailing stop-loss tightly.

Monday Trade Plan (Nifty 50) 🔼 Bullish Levels (Call Side Entry):
Above 25,008
🔹 Hold CE (Call) — Positive trade view.
Above 25,118
🔹 Hold CE by Entry Level
🚨 Below this: Risky Zone for PE (Put)
Above 25,218
🔹 10 min Closing Short Cover Level
✅ Strong momentum expected above this zone
🔽 Bearish Levels (Put Side Entry):
Below 25,000
🔻 Hold PE — Negative trade view.
Below 24,888
🔻 Opening R1 10m — Hold PE by level
Below 24,788
🔻 Hold PE by level
Below 24,688
🔻 Hold PE by Safe Zone level
Below 24,600 (Approx)
🧯 UNWINDING ZONE
🔻 Strong downward momentum expected
⚠️ Mid-Zone / Risk Areas:
Between 25,000 – 25,008: No clear direction
Between 25,088 – 25,118: Risky Zone for PE
Between 24,788 – 24,888: Rangebound area, watch for breakout

Advance Option Trading Why Institutions Prefer Options
Leverage – Control large positions with small capital
Risk Management – Protect portfolios
Cash Flow – Earn premium income
Volatility Play – Earn from IV rise/fall
Customization – Tailored exposure using exotic options
Core Strategies Used by Institutions
1. Protective Puts
Buy puts to insure large stock holdings against downside risk.
2. Covered Calls
Earn premium income on long-term stock holdings.
3. Calendar Spreads
Take advantage of time decay and volatility differences.
4. Straddles & Strangles
Bet on volatility movement, not direction.
Tools Used by Institutional Option Traders
Bloomberg Terminal – Real-time data, pricing models
Quantitative Models – Black-Scholes, Binomial Trees
Algo Execution – Smart order routing
Risk Management Software – VaR, Greeks analysis
Option Analytics Platforms – Orats, Trade Alert

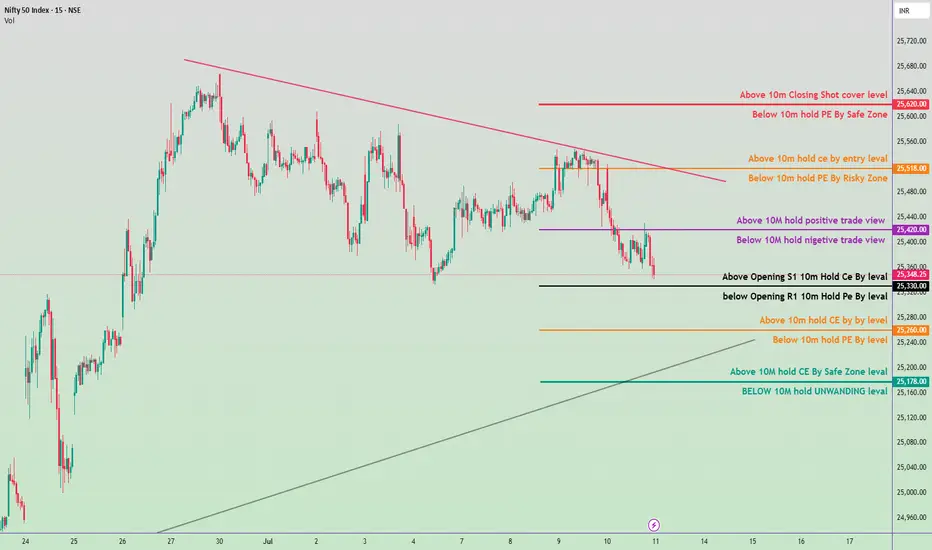
Nifty 50 Intraday Trade Plan 11 july 2025🔴 Resistance & Shorting Zones:
25,620.00
🔹 Above 10m Closing = Short Cover level
🔹 Below 10m = PE by Safe Zone
25,518.00
🔹 Above 10m = Hold CE by Entry level
🔹 Below 10m = PE by Risky Zone
25,420.00
🔹 Above 10m = Hold Positive Trade View
🔹 Below 10m = Negative Trade View
⚖️ Neutral / Opening Zone:
25,348.25 (CMP)
🔸 Above Opening S1 = Hold CE by Level
🔸 Below Opening R1 = Hold PE by Level
🟠 Intermediate Support/Resistance:
25,260.00
🔸 Above 10m = Hold CE by Level
🔸 Below 10m = Hold PE by Level
🟢 Support & Unwinding Zones:
25,178.00
🔹 Above 10m = CE by Safe Zone
🔹 Below 10m = Unwinding Level
📌 Summary:
A move above 25,420 may shift view to bullish/intraday CE hold.
Below 25,260 suggests weakness, possible PE play.
Major support at 25,178, breakdown below this might trigger heavy unwinding.
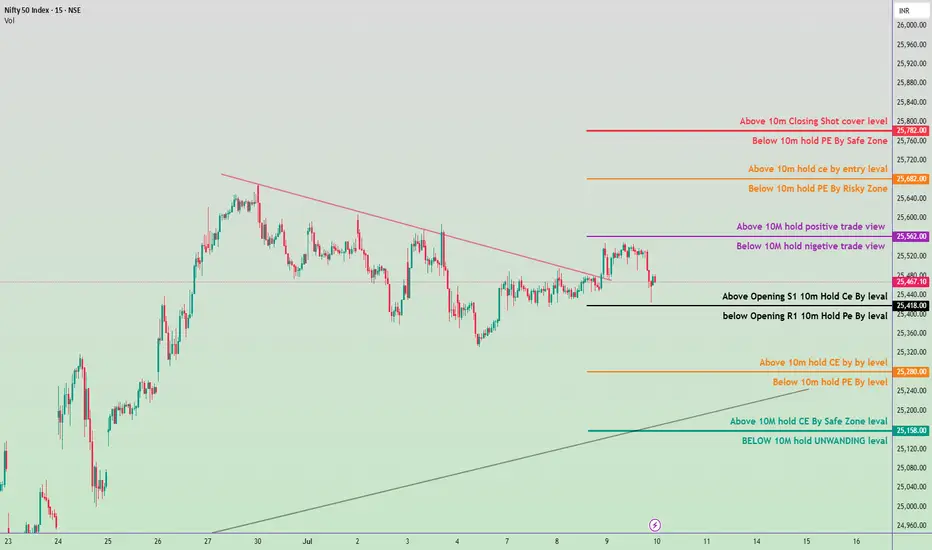
Nifty 50 Intraday Trade Plan 10 july 2025🟣 1. Trend Confirmation Zone (Level: 25,562.00)
Above 25,562.00 → Positive View Active
If Nifty sustains above this level for more than 10 minutes, it indicates bullish momentum. Call Option (CE) traders can stay in the trade or consider new entries.
Below 25,562.00 → Negative View Active
If Nifty stays below this level, bearish momentum is likely. Put Option (PE) trades are favorable.
⚫ 2. Opening Range Levels
Above 25,467.10 (Opening S1) → Hold CE (Call Option)
If the market holds above this after the opening 10-minute candle, you can go long (buy CE).
Below 25,418.00 (Opening R1) → Hold PE (Put Option)
If Nifty breaks this level on the downside, and sustains for 10 mins, it suggests weakness – PE trade is favorable.
🟠 3. Entry-Level Zone
Above 25,682.00 → Entry for CE (Call Option)
Bullish breakout level – good for fresh buying positions if sustained above.
Below 25,682.00 → Risky PE (Put Option) Zone
Aggressive traders may consider short trades, but this is a risky area.
🔴 4. Safe Zone for Positional Traders
Above 25,782.00 → Closing Shot / Cover Level
Indicates overbought or strong bullish continuation – exit PE positions if short.
Below 25,760.00 → Safe Zone for PE
A good place to hold PE (put) positions, as the market is weak below this.
🟠 5. Support Resistance Flip Zone
Above 25,280.00 → CE Hold Level
Support for intraday buyers. A bounce from here can give a CE opportunity.
Below 25,280.00 → PE Hold Level
Breaking this means more downside is likely – favorable for PE.
🟢 6. Strong Support / Breakdown Level
Above 25,158.00 → CE Safe Zone Level
Indicates strong buying support. If held, expect intraday recovery.
Below 25,158.00 → Unwinding Level
Panic selling or unwinding of long positions may start. Avoid CE, prefer PE.
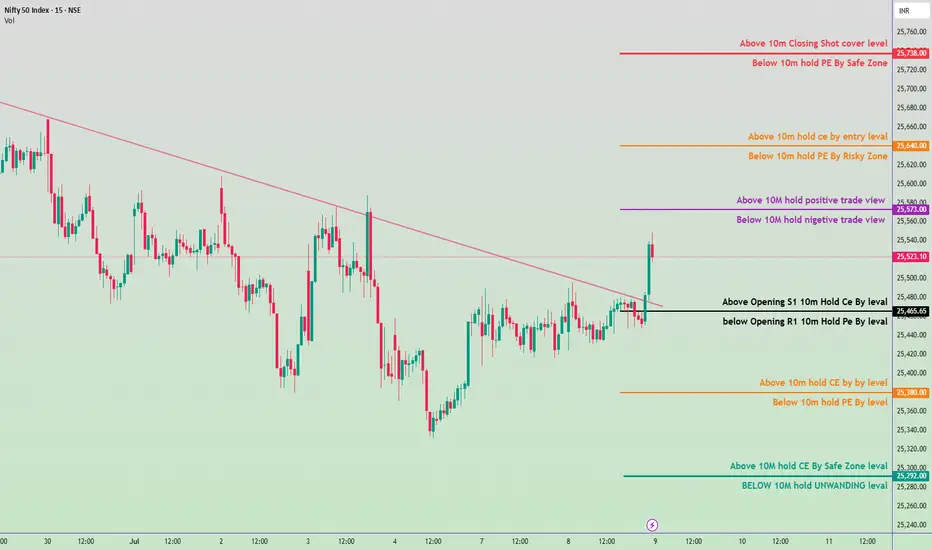
Nifty 50 Intraday Trade Plan for July 9, 2025🔴 Upper Resistance Zones (Short Covering Area)
🔺 25,738.00 – Shot Cover Level
If a 10-minute candle closes above this level, expect short covering – bullish breakout.
If price comes below this after testing, it's a safe zone to hold PE (puts).
🟧 25,640.00 – CE Entry Zone
Above this: Call options (CE) can be held.
Below this: Risky zone for holding PE, volatility may increase.
🟪 25,573.00 – Sentiment Zone
Above this: Positive trade bias.
Below this: Negative trade bias, indicating weakness.
⚫ Midpoint Zone (Opening & Pivot-Based Decision Area)
⚫ 25,465.65 – Opening + S1/R1 Zone
Above this level: Hold CE positions (bullish intraday setup).
Below this level: Hold PE positions (bearish setup).
🟠 Lower Mid-Level (Support/Breakdown Test)
🟠 25,380.00
Above: Intraday buy CE zone.
Below: PE can be held for more downside.
🟢 Bottom Support Zone (Safe Zone / Unwinding Zone)
🟢 25,292.00 – Safe CE Hold Zone
If the price holds above this level after 10 min: safe to hold CE.
🟢 25,282.00 – Unwinding Zone
Below this level: Risk of unwinding and larger sell-off increases.
📌 How to Use This Plan (Summary)
Wait for 10-minute candle confirmations near these levels.
Follow directional bias: CE (calls) if price sustains above levels, PE (puts) if price remains below.
Trade only after confirmation, not just touch.
Trading Master ClassPost-Trade Processing
Clearing and Settlement: Trades are cleared by clearing houses and settled typically on T+1 or T+2 basis.
Regulatory Reporting: All trades must be reported for transparency and compliance.
Performance Review and Compliance
Evaluation: Execution quality, cost efficiency, and market impact are reviewed.
Audit Trails: Maintain detailed records for regulatory bodies like SEBI, SEC, etc.
Continuous Improvement: Algorithms and strategies are refined based on trade performance.
Key Components in Institutional Trading
Liquidity Management: Large trades need sufficient liquidity to avoid market disruption.
Algorithmic Support: Automated systems manage trade slicing and timing.
Risk Control: Continuous monitoring of exposure, slippage, and adverse market moves.

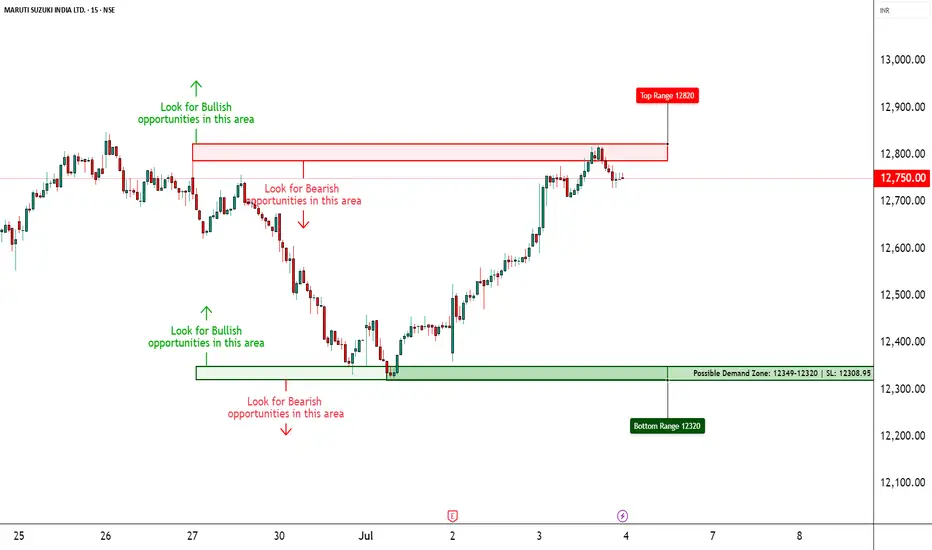
MARUTI – Strong Call Long Build-Up Dominance________________________________________
📈 MARUTI – Strong Call Long Build-Up Dominance | OI + Price Action Analysis
🕒 Chart Type: 15-Minute
📆 Date: July 3, 2025
________________________________________
🔍 What’s Catching Our Eye:
MARUTI closed around ₹12,752, and the entire Call side up to 13,500 is showing strong Long Build-Up, indicating aggressive bullish sentiment from option buyers. Meanwhile, the Put side is displaying Short Build-Up, further confirming bullish undertones. The price is steadily climbing, supported by strong institutional participation.
________________________________________
📌 What We’re Watching For:
If MARUTI sustains above ₹12,800, bullish continuation looks likely. Watch for follow-through toward ₹13,000 and 13,200+ if momentum persists. However, a drop below ₹12,500 could temporarily halt this upward bias.
________________________________________
📊 Volume Footprint:
Options activity is backed by strong volume — over 17k+ contracts at ₹13,000 CE and 15k+ at ₹12,800 CE — showing traders are betting big on further upside.
________________________________________
📈 Option Chain Highlights:
The OI data is highly supportive of the bulls:
• Calls (Long Build-Up):
o ₹13,000 CE: +104,450 OI | Price ↑ 8.6%
o ₹12,800 CE: +101,800 OI | Price ↑ 12.04%
o ₹12,900 CE: +95,650 OI | Price ↑ 10.07%
o Even OTM CE like ₹13,500 is active → trend belief is strong
• Puts:
o ₹12,800 PE & ₹12,700 PE both showing Short Build-Up, i.e., buyers believe downside is limited
Inference: Bulls are clearly in control, with both Call buyers active and Put sellers stepping in. This aligns with the broader bullish trend seen in the stock.
________________________________________
🔁 Trend Bias:
🟢 Bullish – Confirmed via price action and derivative sentiment
________________________________________
🧠 Trade Logic / Reasoning:
Strong accumulation is seen at every major Call level, from ATM to slightly OTM strikes. Short covering at ₹12,500 CE and long build-up in higher CE strikes confirms that the bulls are expecting a continuation rally. PE writers are unwinding or adding shorts – classic sign of strength.
________________________________________
📍 Important Levels to Mark:
🔺 Top Range (Resistance): ₹13,200 – ₹13,500
🔻 Bottom Range (Support): ₹12,500
________________________________________
🎯 Trade Plan (Educational Purpose Only):
✅ Best Buy (Equity): Above ₹12,800 with strong bullish candle
✅ Best Sell (Equity): Avoid unless ₹12,500 is broken
✅ Best CE to Long: ₹13,000 CE – Strongest long build-up with momentum
✅ Best PE to Long: Avoid PE long – sentiment doesn’t support bearish bets
🟢 Demand Zone: NA
🔴 Supply Zone: NA
⚠️ Invalidation Below:
Bullish bias is invalidated below ₹12,500 with high volume selling
________________________________________
⚠️ Disclaimer:
This analysis is for educational purposes only.
STWP is not a SEBI-registered advisor.
No buy/sell recommendations are made.
Please consult your financial advisor before trading.
STWP is not responsible for trading decisions based on this post.
________________________________________
💬 Did this help you spot the momentum early?
Drop your views in the comments ⬇️
🔁 Share this with traders watching MARUTI
✅ Follow STWP for clean price + option chain trades
🚀 Let’s educate more traders with patience and clarity!
________________________________________