NZD/USD Technical Analysis 🧠 NZD/USD Technical Analysis | Smart Money Perspective
Currently, the NZD/USD pair is trading around 0.5960, positioned between a well-defined resistance zone (0.6130–0.6150) and a support zone (0.5890–0.5900).
Here are the key technical aspects to note:
🔹 1. Liquidity Sweep
The price recently dipped below the previous swing low near 0.5900, tapping into a pool of sell-side liquidity. This move is typically seen as a liquidity grab, where institutional players push the price to trigger retail stop losses before reversing direction.
🔹 2. Double Bottom Formation
The chart suggests a potential double bottom forming at the support level — a classic sign of accumulation. This pattern indicates buyers may be coming in after liquidity has been cleared, expecting a reversal.
🔹 3. Fair Value Gap (FVG)
A Fair Value Gap, or imbalance, is visible between 0.5985 and 0.6015. This gap was created due to a sharp bearish move, leaving price action unbalanced. The price is now likely to retrace into this area to rebalance orders, which is typical smart money behaviour.
🔹 4. Market Structure Outlook
If the double bottom confirms with a bullish break of structure above 0.5980, we could see a continuation towards:
- First Target: FVG zone around 0.6015
- Second Target: Major resistance near 0.6150, where past distribution occurred
✅ Conclusion
This setup integrates key smart money concepts:
- Liquidity grab below support
- Accumulation phase at demand
- FVG as a target
- Potential bullish shift in market structure
Traders should keep a close watch on price action around the support zone for confirmation, such as a bullish engulfing candle or a break of recent short-term highs, before taking long positions. Targets remain at the FVG and resistance zones; however, sound risk management is crucial in case of a deeper sweep or any macroeconomic developments.
Fvg

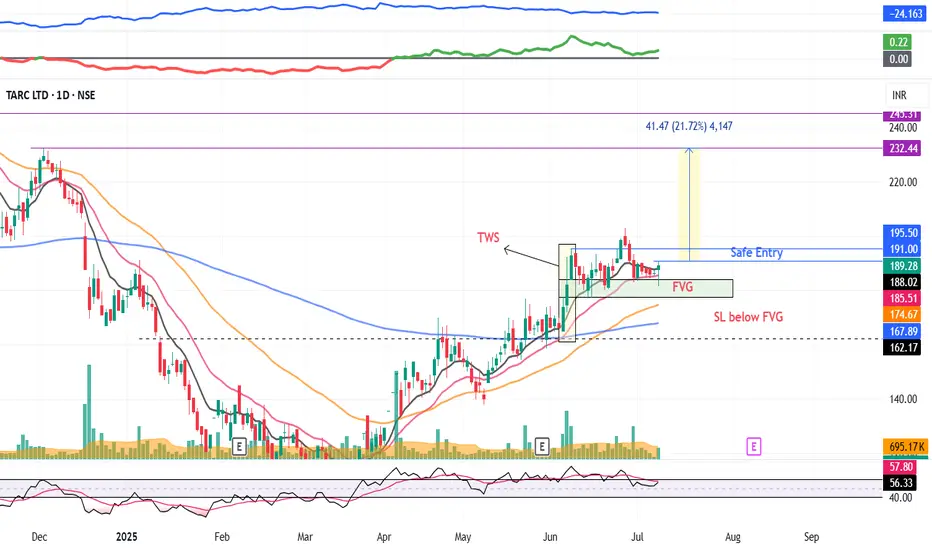
TARC: Swing Pick (Breakout Candidate)#Tarc #swingtrade #threewhitesoldiers #fvg #fairvaluegaps #trendingstock #breakoutstock
TARC : Breakout Candidate
>> Up-trending stock
>> TWS Visible
>> Bounce back from FVG
>> Trending setup
>> Good Volume & Strength
>> Risk Reward Favorable
Swing Traders can lock profit at 10% and keep Trailing
Please Boost, comment and follow us for more Learnings.
Disc : Charts shared are for learning purpose only, not a Trade recommendation. Do your own research and consult your financial advisor before taking any position.
Breakout Confirmation Above ₹2491 - Trend Reversal in Play?After months of downtrend, Asian Paints is showing signs of reversal. A clear Change of Character (CHoCH) has been marked, and the price is approaching a key resistance at ₹2491.
🔍 Trade Idea:
Entry (Trigger): Weekly close above ₹2491 (break of recent BSL)
Target: ₹3203 (Previous high + Weekly Fair Value Gap zone)
Stop Loss: Below swing low around ₹2110
Risk-Reward: Approx. 1:2.8+
📌 Technical Confluences:
CHoCH confirmed in mid-2025
Weekly FVG above offers price imbalance that price may seek to fill
Current structure forming a higher low with bullish momentum
💬 Idea: Wait for a strong weekly close above ₹2491 for confirmation. Once confirmed, a potential rally towards ₹3200+ is in play, targeting the FVG zone and liquidity above the previous swing high.
⚠️ Disclaimer: This analysis is for educational purposes only and not financial advice. Always do your own research and use proper risk management.

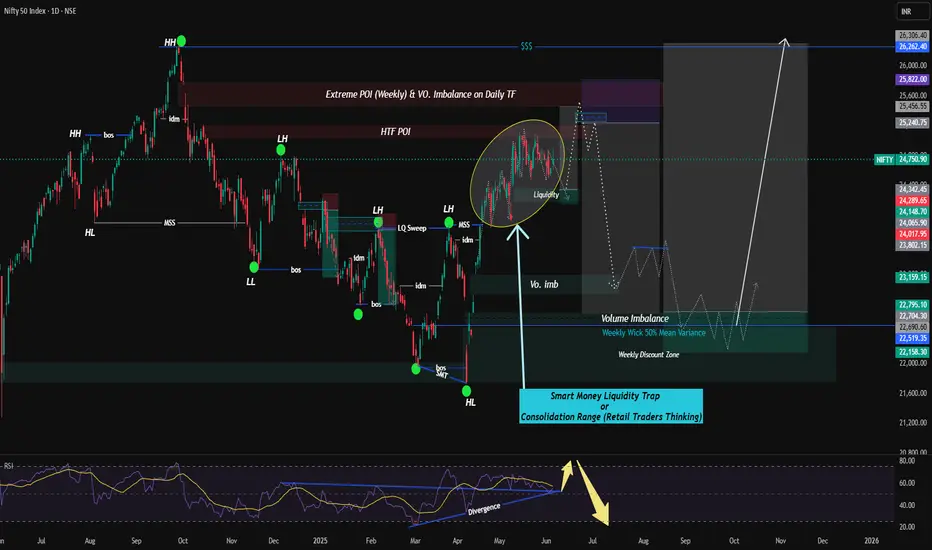
Nifty Analysis - Smart Money Concepts or LiquidityI would like to present my Nifty Analysis based on Liquidity or Smart Money Concepts.
This Analysis is based on Multi-time frame (Weekly & Daily) Time Frame. here chart is used on Daily Time Frame.
Current Scenario - (Weekly TF Analysis)
==Weekly Time Frame Analysis -
The current move is retracing into a weekly POI zone which also has-
-Daily Imbalance
-HTF Supply Block
-Smart Money Trap Zone (marked)
Right now, HTF is still in broad bearish retracement structure.
==Daily TF Annalysis -
-Price is consolidating in a range within a clearly defined HTF POI (High Probability Reversal Area)
-Inside the range:
-Multiple internal BOS & MSS
-Clean liquidity pool build-up (marked in yellow)
-Potential for buy-side liquidity sweep followed by sell-off into discount
Price Projection & Bias -----
1. Short-Term Bias (Next 3–5 Weeks): Downside after Extreme POI liquidity grab
-Expectation is there will be a Fakeout above the liquidity pool (25,500–25,800), or in retail language say it is Stop Loss Hunt then sell-off.
-Target: Volume Imbalance near 23,200–22,700.
-This will be aligned with - Liquidity sweep , Mitigation of volume imbalance , Entry into Weekly Discount Zone.
2. Mid-Term Bias or say 2-3 months expectation (After Re-accumulation)
-If price reacts with storng bullish order flow from 22500-22000 range then expect -
-Reversal into bullish structure
-Target - 26200 or 26400
-Supported by mean reversion + reaccumulating idea
(For Entry Module)
- Consider 15min to 1 hour Time frame setup for confirmation before taking shorts from above supply zone.
- expect a long setup around 22200-22400 only if bullish BOS + FVG Filled and also consider HTF Liquidity sweep near weekly wick discount zone or say 50% mean reversion.
Disclaimer -- (Views are only for Educational Purpose only. Always consult your financial Advisor before doing Any Investments).
Your Views or Comments are welcomed.
CHoCH + FVG = Institutional Entry Point for Option Traders!Hello Traders!
Today, we’re diving into one of the most powerful Smart Money Concepts — combining CHoCH (Change of Character) with FVG (Fair Value Gap) to identify high-probability institutional entry zones. This setup works brilliantly for both equity and option traders , especially when you want to catch the move before the breakout.
What is CHoCH (Change of Character)?
CHoCH occurs when the market shifts from a bearish to bullish structure or vice versa. It marks the first sign that market structure is shifting , and smart money is potentially stepping in.
What is a Fair Value Gap (FVG)?
An FVG is an imbalance between buyers and sellers. When price moves sharply in one direction, it leaves behind an area (usually 1-2 candles) with no trading activity — that’s the gap smart money fills later to enter or add positions.
Why This Combo Works Like Magic
CHoCH gives confirmation that market direction is changing.
FVG gives the entry zone where big players are likely to buy or sell again.
High Risk-Reward : You’re entering close to where institutions enter — not chasing breakouts.
Ideal for Option Traders looking for momentum entries at discounted zones.
How to Trade This Setup
Wait for a CHoCH on the 5min/15min chart.
Mark the FVG zone created after CHoCH.
Enter near the FVG zone with confirmation (rejection candle, volume spike, or VWAP bounce).
Place stop loss below the FVG and target swing high or based on option premium chart.
Rahul’s Tip
Don’t just chase the breakout. Learn to identify where smart money accumulates before the rally. CHoCH + FVG = sniper-level precision for option scalpers.
Conclusion
This setup is becoming a go-to for institutional-style intraday traders. It’s clean, logical, and extremely efficient when executed with discipline. Start spotting these patterns and backtest your entries — you’ll be amazed by the results!
Have you tried CHoCH + FVG before? Let me know your experience in the comments!

PARAGMILK By KRS Charts24th Feb 2025 / 11:42 AM
Why PARAGMILK?
1. Fundamentally Undervalued Stock with Good Financial figures. 🎯
2. Technically, Wave counts wise It is in last leg of correction.🔥
3. After Wave count it is showing Higher Low as per Dow Theory. ✅
4. +OB with FVG is visible, most importantly reversal is confirmed by Green Candle from 50% Encroachment. 📈
5. RSI is above 40. which is good for swing Trade buy side.
Expected Target Short and Med T is posted in Chart 👆
SL as per Closing basis in 1D.

INTL CONVEYORS by KRS Charts8th Oct 2024 / 10:02 AM
Why INTL CONVEYORS ❓
1. Fundamentals are Good despite having Low Stock Price and P/E Ratio is under 10. ⚡
2. Accumulations are visible at bottom side multiple times ❗
3. Golden Zone is satisfying on 1W TF and Now retesting Price on Resistance as well as on Golden Zone 🔅
4. In Feb 2024, Big Green Candle with Strong Volume justified as a Buyers Trap ✅
5.Also, for more Bullish Support, +OB with FVG is also visible as we can see in Chart. 📊
6. Today in 1D Price is at 100 EMA underneath 📌
Target for INTLCONV will be ~124 Rs Short Term and Further will be Revealed Later 👍

The Great Debate: Which PD Array is the Best?There’s been an ongoing debate across social media platforms about which PD array is the best in the PD Arrays matrix. Influencers have taken sides, with some giving more attention to certain arrays, claiming they’ve mastered it better than others. You’ve probably seen posts like "OB > FVG" or "FVG > everything" floating around.
But let’s be real here, the names behind these claims aren’t worth mentioning, because it only adds more attention to those chasing the hype. The real credit belongs to ICT, the mind behind these concepts. So let’s redirect our focus to where it belongs.
Which PD Array Is Actually the Best?
Take a good look at the PD Array matrix again.
Now, if you truly understand the PD array matrix, you wouldn’t be asking, “Which is the best?” The answer is literally in front of you.
Here’s a little tip: The arrays are listed in a specific order, and that order is crucial. They’re designed to form in the sequence you see in the matrix.
Food for Thought
Instead of me flat-out telling you which PD array is the top dog, let’s do a little mental exercise that will help you figure it out yourself. Ready?
Imagine you're a market maker. You’re getting ready to enter a short position, and naturally, you're greedy. You want maximum returns as quickly as possible. The question is: Which premium array would you pick for placing your orders in the most efficient way, ensuring you make the most money in the shortest time?
Think about it. The answer should be obvious now.
Got it? Perfect. Now you know which PD array might have the edge over others. It’s not about someone else telling you - it’s about understanding the logic behind how they work and how they fit into the bigger picture.
Final Thoughts
Thank you for taking the time to dive into this topic with me. I hope this post got your mind working in the right direction. And remember, understanding the PD Array matrix is more important than chasing whatever’s trending online. The more you think critically about these concepts, the better your trading decisions will be.
See you again soon with another post filled with more valuable insights!

Devyani International (W Bullish Pattern)Date : 10th April 2024
Time :12.00 PM
Devayani International is showing reversal from its usual support with other bullish indications.
As we can see ,
first of all W pattern is visible from strong support. also there is a bullish Divergence too.
Wave Count on Devyani is also looks like its time for ABC wave till depth of correction price level, which is 198 Rs.
Order Blocks on multiple time frame is also visible after last bullish movement.
With A Stop Loss of 150 Rs. [ i] We can Long Devyani Int.
Entry Zone will be 162 to 155 Rs with Target of 198 Rs
and RR is Minimum 1:3

Kokuyo camlin : Breakout Stock#kokuyocmln #breakoutstock #tws #fvg #patterntrading #chartpattern #inverseheadandshoulder
Kokuyo Camlin : Swing Trade / Short term(1-3 Months)
>> Breakout Stock
>> TWS Visible
>> Stock Bouncing from FVG Area
>> Good Strength & Volumes might Pickup soon
>> Low Risk High Reward Trade
Swing Traders can lock profit at 10% and keep trailing.
Please give a Boost or comment if u r Liking the analysis & Learning from it. Keep showing ur Love by following
Disclaimer : This is not a Trade Recommendations & Charts/ stocks Mentioned are for Learning/Educational Purpose. Do your Own Analysis before Taking positions.

HDFC BANK NSEDATE - 12th March 2024.
HDFC Bank has breakout today with good amount of candle size and volume too.
Applied Concepts
Chart P. - Inverted H&S
Positive Order Block from Daily Time Frame and Previous OB of Monthly TF as shown in chart.
Only OB is not a good option so here we have applied FVG (Fair Value Gap) also, Price Action has successfully reversed from FVG and gave confirmation for potential upside movement.
Targets
1st Target as per Chart P. is 1555 Rs.
and Further upside Target as per OB and FVG is 1700+.
Thank You!
Have a Good Day.

M&M ICT M&M has grabbed solid sell side liquidity and has broken past its short term low forming a FVG and a valid MSS... Applying ICT concepts, this triggers an entry and a stop with target as noted.
Keep It Simple

ICT-3 ICT concepts coupled with price action
575 was the best entry as it formed a FVG after a MSS and sell side liquidity was taken out.
Au bank released its earnings and although profits fell, NPA,GPA were down as well showing strong management. NII was up 10% which is another major sign and it beat estimates.
Technical signals
Bullish flag with a bullish engulfing candle which is validated by volume and on the 50ema couples with ICT also trading makes it a high probability set up.
Keep It Simple

ICT- 4 ITC HAHA ICT=ITC anagram...
ITC currently has iCT concepts in play and I am expecting a target of 456. The first FVG formed around 412.. sadly I missed the entry. A continuation FVG formed at 423 where I have entered and am expecting 456.
ITC earnings can create volatility but set up is solid and concepts are in play
Yes price action has already happened but this is just to show you a new perspective of the market and how these concepts work.
Keep it Simple

Apollo Tyres- ICT 2 Concepts Of ICT- Part 2
A liquidity grab took place followed by a market structure shift leading to an imbalance being formed ( FVG ). The market beautifully trades back into the imbalance and a target of 0.5 Fib level was achieved.
Keep It Simple
All concepts from 2022 Mentorship

PVRINOX long based on ICT concepts. Swing trade
PVR has swept a monthly low and closed above a bearish weekly FVG so for the time being, I will be expecting higher prices. On the daily chart, we have a sweep at the lows again before creating a new bullish FVG upward.
I do not think price will retrace deep into the recent bullish leg because of all the PD arrays stacked one against another. Therefore, I will enter at the midpoint of the most recent bullish FVG and target the weekly imbalance with stops at the low.

Take a chance in correction phase | Long BiasOn week chart
After ADA has broken out the resistance zone at $0.46 and now it's pulling back to support zone around 0.45 - 0.43
Wait for confirmation around this level to join

NZDUSD 4H short position | fvg entry updateThis is the update of my previous post on NZDUSD 4H sell setup , beautiful 1:3.5 RRR trade

NZDUSD 4H short idea | FVG setup Confirmations:-
1] market structure shift
2] order block
3] fvg entry
4] trend continuation
5] engulfing bar candlestick confirmation
Target:- 1:3.5 RRR

USDJPY 4H entry setup, waiting for the FVG entry Confirmations:-
1] bullish trend
2] break of structure
3] fair value gap entry
4] Fibonacci 50%
Target confirmations:-
1] swing high

Pullback | Support Zone | Long BiasOn 1h TF
IMX is pulling back to support zone around $2.05 this level is Fair Value Gap
Besides, the ascending trend line is supporting for this bullish
So wait for rejection at this level before open position
Time will tell

SMC Concept | Pullback | Long BiasOn 1h TF
HBAR is pullback to 0.0786 this level is Good Entry Zone based on #SMC
Wait for rejection around this level to join

Fair Value Gap, Chance Zone | Long BiasOn Week TF
Solana's in Fibo Channel and it's trading at $108 now
I found a #FairValueGap around in range $80 - $96 so I expect SOL will pullback and bounce back from this range
Besides, this range included #GoldenRatio
So I think the chance for long position
Time will tell
