Gabriel India: Super bullishInverted H&S in monthly time frame. There could be some retracement as it has hit resistance but the bigger picture is still bullish. keep adding in small small quantity could take like more than 6 months and the first target is ATH. in smaller time frame one can aim for 170-173.
Disclaimer-i am not sebi registered. you are responsible for your profit and losses
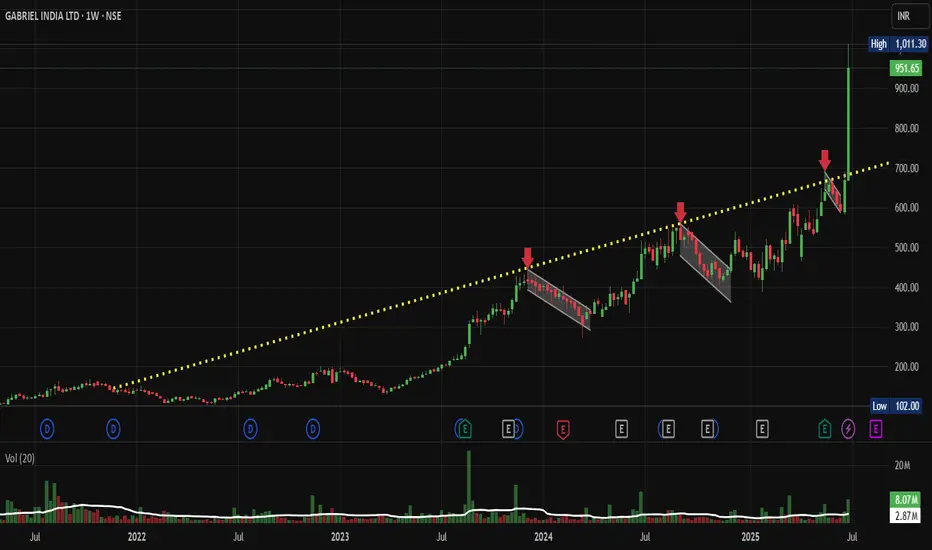
GABRIEL

Gabriel India: Ascending Trendline Breakout, Chart of the WeekNSE:GABRIEL : A Technical Breakout Story That Could Double Your Investment? Let's Analyze it in my "Chart of the Week" Idea.
Price Action Analysis:
• The stock has shown a remarkable multi-year uptrend from around ₹100 levels in 2022 to current levels above ₹950
• A clear ascending channel pattern is visible with the yellow dotted trendline acting as dynamic support
• Recent price action shows a powerful breakout from a consolidation phase around ₹600-700 levels
• The stock is currently trading near all-time highs with strong momentum
• Volume expansion during the recent breakout confirms genuine buying interest
Volume Spread Analysis:
• Volume patterns show significant spikes during major price advances
• The recent breakout phase is accompanied by above-average volume, indicating institutional participation
• Volume tends to contract during consolidation phases, which is a healthy price action
• The volume profile suggests strong accumulation during the base-building phases
Key Technical Levels:
Base Formation:
• Primary base formed between ₹100-200 levels during 2022-early 2023
• Secondary base established around ₹400-500 levels in late 2023
• Most recent consolidation base around ₹600-700 levels before the current breakout
Support Levels:
• Immediate support: ₹850-900 (recent breakout zone)
• Strong support: ₹700-750 (previous resistance turned support)
• Major support: ₹600 (base of recent consolidation)
• Critical support: ₹500 (psychological level and previous consolidation zone)
Resistance Levels:
• Immediate resistance: ₹1000-1050 (psychological barrier)
• Next resistance: ₹1200 (measured move target)
• Extended target: ₹1400-1500 (based on channel projection)
Technical Pattern Recognition:
Primary Patterns:
• Long-term ascending channel with consistent higher highs and higher lows
• Multiple cups and handle formations during the uptrend
• Recent flag/pennant consolidation followed by breakout
• Classical stage 2 uptrend characteristics with expanding volume
Technical Indicators:
• Price trading above all major moving averages
• Strong momentum as evidenced by the steep price advance
• Healthy pullbacks followed by resumption of uptrend
• Volume-price confirmation during breakouts
Trade Setup:
Entry Levels:
• Aggressive entry: Current market price (₹950-970)
• Conservative entry: On pullback to ₹850-880 levels
• Breakout entry: Above ₹1000 with volume confirmation
• Accumulation entry: Any dip towards ₹800-820 levels
Exit Levels:
• First target: ₹1200 (26% upside from current levels)
• Second target: ₹1400 (47% upside)
• Extended target: ₹1600 (68% upside)
• Trailing stop strategy recommended for long-term positions
Stop-Loss Placement:
• For aggressive entries: ₹800 (16% risk)
• For conservative entries: ₹750 (12% risk from ₹850 entry)
• For breakout entries: ₹900 (10% risk from ₹1000 entry)
• Weekly closing basis stop-loss recommended
Risk Management Framework:
Position Sizing:
• Risk per trade: Maximum 2-3% of portfolio
• For ₹800 stop-loss from current price: Position size = (Portfolio × 2%) ÷ ₹150
• Recommended allocation: 5-8% of equity portfolio given the risk-reward profile
• Consider scaling into position over 2-3 tranches
Risk Parameters:
• Maximum drawdown tolerance: 20% from peak
• Time-based stop: Exit if consolidation exceeds 6 months
• Sector rotation risk: Monitor auto sector performance
• Market correlation: High beta stock, reduce position size in volatile markets
Sectoral Backdrop:
Auto Ancillary Sector Dynamics:
• Indian automotive sector showing strong recovery post-COVID
• Shift towards electric vehicles creating new opportunities for component manufacturers
• Export potential increasing with global supply chain diversification
• Government's PLI scheme supporting auto component manufacturing
Industry Trends:
• Increasing focus on high-quality, precision components
• Growing aftermarket business providing stable revenue streams
• Consolidation in the sector is favouring established players
• Technology upgrades driving margin expansion
Fundamental Backdrop:
Company Overview:
• NSE:GABRIEL is a leading manufacturer of automotive shock absorbers and suspension systems
• Strong presence in both OEM and aftermarket segments
• Diversified customer base across passenger vehicles, commercial vehicles, and two-wheelers
• Established relationships with major automotive manufacturers
Financial Highlights:
• Consistent revenue growth is driven by industry expansion
• Improving margins through operational efficiency and product mix optimization
• Strong balance sheet with manageable debt levels
• Increasing return on equity and return on capital employed
Growth Drivers:
• Expanding automotive production in India
• Growing replacement market for suspension components
• Export opportunities in emerging markets
• New product development and technology partnerships
Investment Thesis:
• Well-positioned to benefit from India's automotive growth story
• Strong competitive moat through technical expertise and customer relationships
• Potential for multiple expansions as the company scales operations
• Dividend yield providing downside protection for long-term investors
My Take:
The technical setup for NSE:GABRIEL presents a compelling risk-reward opportunity with the stock breaking out from a multi-month consolidation phase. The combination of strong sectoral tailwinds, robust fundamental backdrop, and bullish technical patterns creates a favourable investment environment. However, investors should maintain proper risk management given the stock's high beta nature and current extended valuation levels.
Keep in the Watchlist.
NO RECO. For Buy/Sell.
📌Thank you for exploring my idea! I hope you found it valuable.
🙏FOLLOW for more
👍BOOST if you found it useful.
✍️COMMENT below with your views.
Meanwhile, check out my other stock ideas on the right side until this trade is activated. I would love your feedback.
Disclaimer: "I am not a SEBI REGISTERED RESEARCH ANALYST AND INVESTMENT ADVISER."
This analysis is intended solely for informational and educational purposes and should not be interpreted as financial advice. It is advisable to consult a qualified financial advisor or conduct thorough research before making investment decisions.
Gabriel India Limited - Breakout Setup, Move is ON..#GABRIEL trading above Resistance of 518
Next Resistance is at 673
Support is at 415
Here are previous charts:
Chart is self explanatory. Levels of breakout, possible up-moves (where stock may find resistances) and support (close below which, setup will be invalidated) are clearly defined.
Disclaimer: This is for demonstration and educational purpose only. This is not buying or selling recommendations. I am not SEBI registered. Please consult your financial advisor before taking any trade.

Gabriel - Rounding Bottom patternA Rounding Bottom (also called a Saucer Bottom) is a bullish reversal pattern, typically indicating that the price is moving from a downtrend to an uptrend.
Rounding Bottom Formation: This pattern often forms over a long period and suggests that after a sustained decline, the asset is gradually transitioning into an uptrend. The price action forms a smooth, rounded curve, rather than a sharp, angular reversal.
Neckline Breakout: The "neckline" is the resistance level that is typically drawn at the top of the rounding formation, where the price has repeatedly failed to move higher. A breakout above this level is a key signal that the trend may be shifting from bearish to bullish.
Price Target: We are expecting that if the neckline is broken, the price could cross 500 level (a psychological round number), which suggests you’re anticipating a significant upside move once the breakout is confirmed. This is consistent with the typical behavior of a rounding bottom pattern, where the potential price target is often calculated by measuring the distance from the bottom of the pattern to the neckline and then projecting that distance upwards from the breakout point.
Trade Details: I am waiting for confirmation of the breakout before providing more details about the trade, including entry points, stop-loss levels, and exit strategy.

Gabriel India Limited - Long Setup, Move is ON...#GABRIEL trading above Resistance of 335
Next Resistance is at 518
Support is at 183
Here are previous charts:
Chart is self explanatory. Entry, Resistances and Support are mentioned on the chart.
Disclaimer: This is for demonstration and educational purpose only. This is not buying or selling recommendations. I am not SEBI registered. Please consult your financial advisor before taking any trade.

Gebriel - Bullish viewReasons for buying:
1. Multiple breakouts in 1 day chart.
2. Recent breakout with good volumes and retest in 15 mins chart.
I have entered the trade as per marked levels.
All my trades are strictly for educational purpose. I am not responsible for your profit or loss. Do your own analysis before entering in to any trade.

"Swing Trading Opportunity: GABRIEL - A Fundamental & Technical"GABRIEL seems to be a promising candidate for a swing trade, backed by both solid fundamentals and a positive technical outlook. The company likely possesses strong financials, which serve as a sturdy foundation for its stock performance. Additionally, the technical structure of the stock appears favorable, possibly indicating an imminent breakout with significant volume support.
For swing traders considering a long position in GABRIEL, it's crucial to conduct thorough analysis and consult with a financial advisor before making any investment decisions. While the charts may suggest specific targets and stop-loss levels, individual risk tolerance and investment objectives should always be taken into account.
Overall, GABRIEL seems to offer an attractive opportunity for swing trading, but it's essential to approach it with caution and seek professional advice to ensure alignment with your investment strategy.

GABRIEL - Bullish Swing Reversal with VolumesNSE: GABRIEL is closing with a bullish swing reversal candle supported with volumes.
Today's volumes and candlestick formation indicates strong demand and stock should move to previous swing highs in the coming days.
The stock has been moving along the horizontal support for the past few days which is indicating demand.
One can look for a 12% to 19% gain on deployed capital in this swing trade.
The view is to be discarded in the event of the stock breaking previous swing low.
#NSEindia #Trading #StockMarketindia #Tradingview #SwingTrade

GABRIEL - Breakout in Daily timeframeGABRIEL - Breakout in the daily timeframe. The stock is in an uptrend in the higher timeframe and has taken a small dip, with this breakout - it looks like the uptrend is going to continue.
Fundamentally the company has strong numbers.

GABRIEL - Ichimoku BreakoutStock Name - Gabriel India Limited
Ichimoku Cloud Setup :
1). Today's close is above the Conversion Line
2). Future Kumo is Turning Bullish
3). Chikou span is slanting upwards
All these parameters are showing bullishness at Current Market Price
and more bullishness AFTER crossing 349
#This is not Buy and Sell recommendation to any one. This is for education purpose and a helping hand to learn trading in Market.
#CloudTrading
#IchimokuCloud
#IchimokuFollowers
#Ichimokuexpert
I hope you all like my analysis.
Please do share your thoughts into comment section.
Please give a like, share & subscribe for daily analysis.

GABRIEL for 70% (approx..) GainGABRIEL is showing Cup and Handle breakout with good amount of Volume. The fundamental is also very nice. Wait to buy at lower level 210-215.
CMP : 227
TG : 350
SL : Below 21 EMA
Stock's selection based on 5 Point Analysis:
1: Idea : Breakout .
2: Support : Volume , Delivery & VWAP. ( To view this, click sedg.in )
3: Technical : 9/21/55/200-EMA, RS>0, MACD, RSI & Super trend up.( To view this, click sedg.in )
4: Fundamental : PE, PAT, Industry & peer PE and sector performance. ( www.screener.in )
5: Timing : Entry Timing on Daily chart.
Disclaimer : It is my personal view as a trader and for educational purpose only. Equity market involves risk .
Please consult your financial adviser before taking any decision.

Gabriel India Limited - Long Setup, Move is ON...#GABRIEL trading above Resistance of 222
Next Resistance is at 335
Support is at 152
Here is previous chart:
Chart is self explanatory. Entry, Resistances and Support are mentioned on the chart.
Disclaimer: This is for demonstration and educational purpose only. This is not buying or selling recommendations. I am not SEBI registered. Please consult your financial advisor before taking any trade.


Long GABRIEL - Move is ON..NSE:GABRIEL
✅ #GABRIEL trading above Resistance of 185
✅ Next Resistance is at 222
✅ Trading at 52-week high which is a sign of strength
Related chart:
Charts are self-explanatory. Levels of breakout, possible up-moves (where stock may find resistances) and support (close below which, setup will be invalidated) are clearly defined.
Disclaimer: This is for demonstration and educational purpose only. This is not buying or selling recommendations. I am not SEBI registered. Please consult your financial advisor before taking any trade.

Gabriel India 1dGabriel formed cup and handle pattern in 1 day time frame
Breakout is successfull
Swing trade
Risk reward ratio is 1:5
#dyor

Gabriel India LimitedGABRIEL:- Stock may have formed head and shoulders and also given breakout, keep an eye
Hello traders,
As always, simple and neat charts so everyone can understand and not make it too complicated.
rest details mentioned in the chart.
will be posting more such ideas like this. Until that, like share and follow :)
check my other ideas to get to know about all the successful trades based on price action.
Thanks,
Ajay.
keep learning and keep earning.

Weekend pick -> Gabriel IndiaChart -> Gabriel Weekly
Stock has given a breakout from 3 times resistance with volume confirmation.
CMP: 182
Target: 222
Good to add: Around 170
SL: 150 Weekly Close
Disclaimer: This is for educational purposes only, not any recommendations to buy or sell. As I am not SEBI registered, please consult your financial advisor before taking any action.

GABRIEL #Watchlist
#GABRIEL (W):-CMP 182.1 Looks Good for more upsides :)
#Disclaimer:-View shared is for educational purposes only.

GABRIEL - Ichimoku Bullish Breakout Stock Name - Gabriel India Limited
Ichimoku Cloud Setup :
1). Today's close is above the Conversion Line
2). Future Kumo is Turning Bullish
3). Chikou span is slanting upwards
All these parameters are showing bullishness at Current Market Price
and more bullishness AFTER crossing 180
#This is not Buy and Sell recommendation to any one. This is for education purpose and a helping hand to learn trading in Market.
# Cloud Trading
# Ichimoku Cloud
# Ichimoku Followers
I hope you all like my analysis.
Please do share your thoughts into comment section.
Please give a like, it motivates me to do analysis.


Gabriel, strong chart, C&H & Trendline BO on daily/weekly & MontGabriel looks strong on daily. weekly, Monthly chart, a closing above 167 will open the Gate for 190/200+. Volumes are decent, less when it was correcting, high when it was on up move.Daily,Weekly & Monthly all the 3 RSI above 60.
Disc; Holding. Please DYOR, not a reco to buy or sell.


Inverted Head & Shoulder Pattern in Gabriel IndiaTrend reversal in Gabriel india Targets 202, 218 and 393
